
Abstract
Although several health departments collect coyote blood samples for plague surveillance, the association between reported human cases and coyote seroprevalence rates remains anecdotal. Using data from an endemic region of the United States, we sought to quantify this association. From 1974 to 1998, about 2,276 coyote blood samples from four Arizona counties were tested for serological evidence of exposure to Yersinia pestis, the causative agent of plague. Using a titer threshold presumed to be indicative of recent infection (serum titers of ≥1:256), we found a statistically significant relationship between years with >17% sero-positive coyotes and years with two or more human cases reported. Moreover, when the annual coyote seroprevalence rates were dichotomized at 17%, 84% of the years were correctly classified using four biologically relevant meteorological variables in a linear regression. This is the first time a statistically significant temporal association between human plague cases and coyote seroprevalence rates has been shown. However, issues with data resolution and surveillance effort that potentially limit the public health utility of using coyote seroprevalence rates are discussed.
Introduction
Coyotes and other canids are not widely believed to serve as reservoirs of plague bacteria (Barnes 1982), and the very few human infections directly linked with exposure to predators were associated with direct contact with infectious carcasses in the absence of proper personal protective equipment (Poland et al. 1973, von Reyn et al. 1976, Wong et al. 2009). Nonetheless, coyotes and other carnivores are potential sentinels of increases in plague activity because of their contact with potentially infectious small mammals and because they often survive plague infection and seroconvert (Archibald and Kunitz 1971, Willeberg et al. 1979, Gage et al. 1994, Salkeld and Stapp 2006).
In the western United States, annual seroprevalence rates in coyotes are typically around 15% (Barnes 1982), but can reach near 80% during an active plague epizootic (Poland et al. 1973). Such data have been used to spatially delineate plague risk areas (Willeberg et al. 1979, Barnes 1982). A recent study found 62.9% of positive coyote samples collected by passive surveillance to be within 1 km of human plague risk areas (Lowell et al. 2009). Fewer studies have discussed the annual variance in plague exposure in carnivores (Gese et al. 1997, Hoar et al. 2003). Geographical and temporal differences in seroprevalence rates have been attributed to plague prevalence rates in coyote prey (Gese et al. 1997). The abundance of Y. pestis susceptible prey, in turn, has been associated with meteorological variables such as temperature and rainfall patterns (Ernest et al. 2000).
Although state and local health and wildlife departments, the U.S. Department of Agriculture (USDA), and the CDC collect coyote blood samples, the association between rates of human infection and coyote seroprevalence rates has not been quantitatively established. Anecdotally, canine serological data reflect patterns in the rates of infection in humans (Archibald and Kunitz 1971, Barnes et al. 1988). In this study, we test for an association between coyote seroprevalence rates and human plague cases reported from four plague-endemic counties in Arizona, where enhanced surveillance activities were conducted from 1974 through 1998. We also investigate meteorological predictors of annual variation in coyote seroprevalence rates as a tool for identifying years with elevated plague risk.
Materials and Methods
Study area
Coyote blood samples were collected as part of a collaborative effort between the Arizona Department of Health Services (ADHS) and Wildlife Services to amass pathogen exposure data on predatory animals along the southern parts of Apache and Navajo counties and most of Coconino and Yavapai counties (shaded areas of Fig. 1). These plague-endemic areas are comprised of both high-use tourist destinations and ranchlands where coyotes are considered nuisance animals. The land-cover consists primarily of Rocky Mountain Ponderosa Pine Woodland, Colorado Plateau Piñon-Juniper Woodland, Mountain Basins Semi-Desert Shrub Steppe, and Mountain Basins Semi-Desert Grassland.
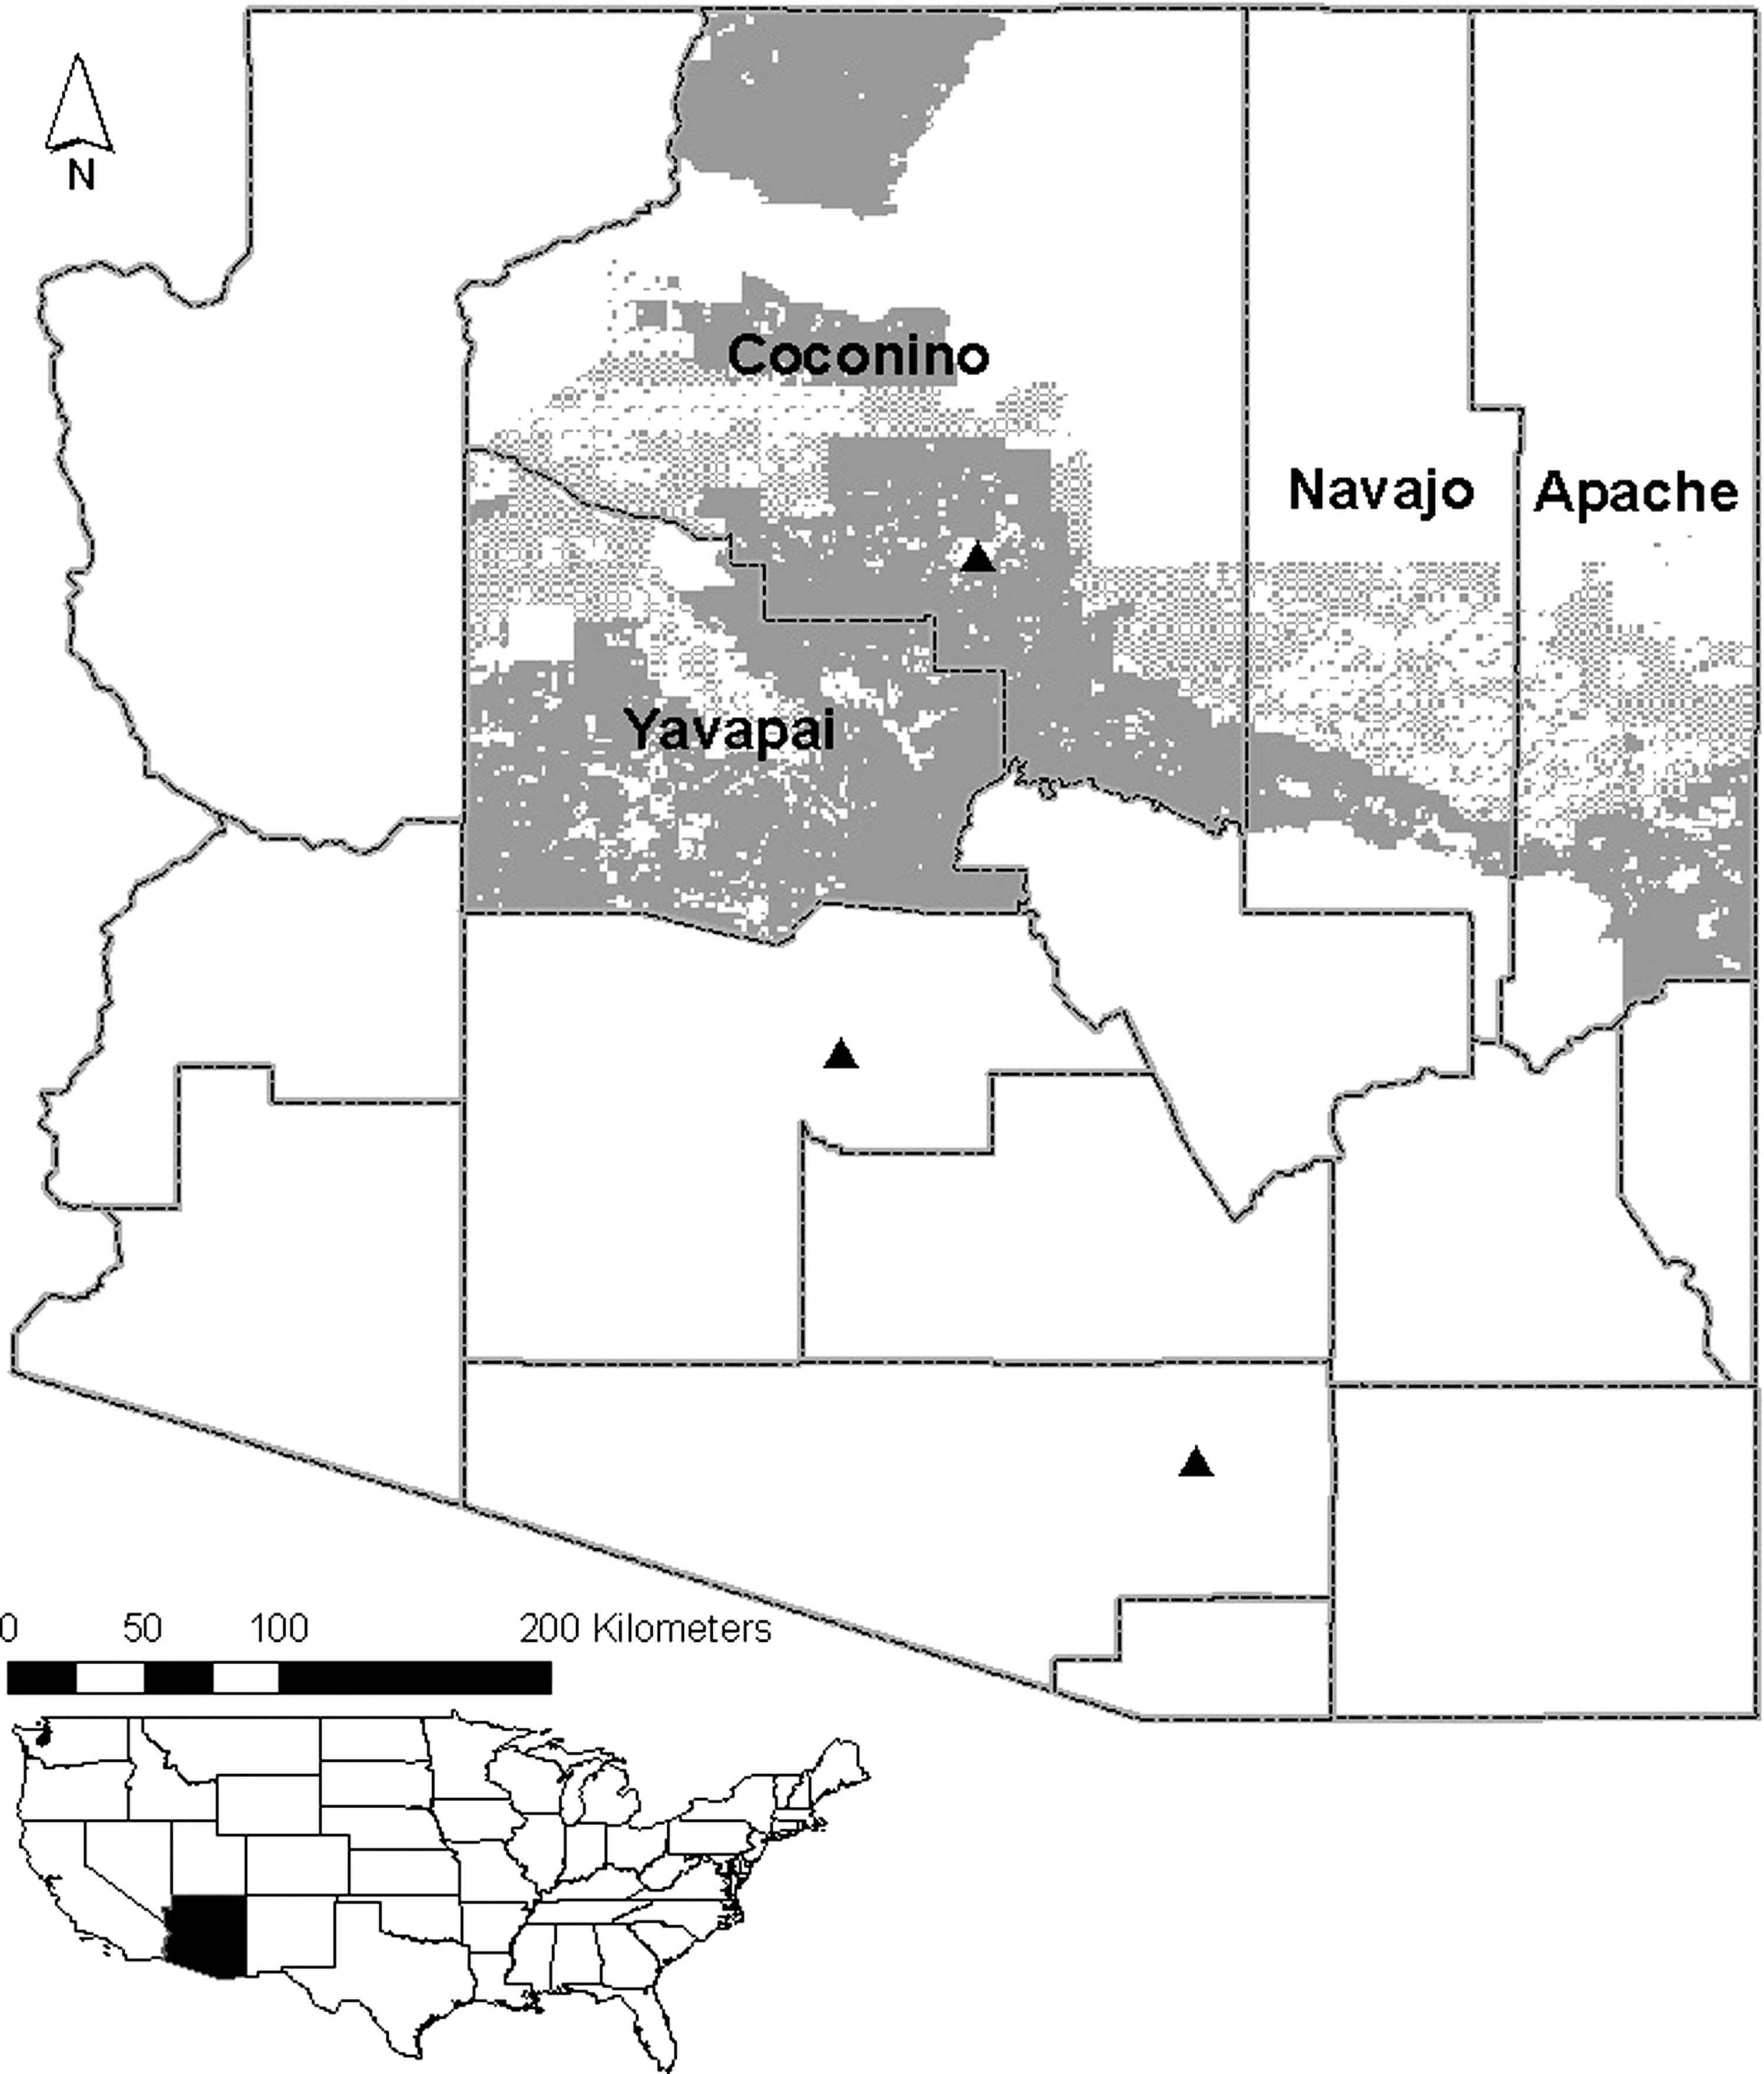
Map of Arizona, United States, showing Yavapai, Coconino, Navajo, and Apache counties and an inset national map to show location of Arizona in the Southwest. Public lands, shading, are the most likely areas from whence the coyote data were acquired. For reference, the three most populated cities, Flagstaff, Phoenix, and Tucson (north to south), are shown.
Coyote data
Between 1974 and 1998, about 2,276 (annual range: 21–206, median: 88) coyote blood samples (nobuto strips; Advantec MFS, Pleasanton, CA) were collected in Arizona and sent to the CDC (Fort Collins, CO), where they were tested for antibodies to Y. pestis using the passive hemaglutination assay (Chu 2000). A positive test result is indicative that the coyote survived infection by Y. pestis. Because coyotes maintain low titers for long periods (Barnes 1982), we assumed high antibody titers, 1:256 or greater, to be indicative of recent exposure. Using this elevated titer, 354 samples were positive (16%; annual median 14.3%, range 0%–65.6%). This is compared to 806 positives at titers of 1:32 or greater (39.1%) which is a more commonly used threshold and the lower limit of detection using nobuto strips.
Human data
Plague is a nationally notifiable disease and confirmation of a human case is defined as isolation of Y. pestis from a clinical specimen or a fourfold or greater change in paired (acute and convalescent) serum antibody titers to the F1 antigen (Poland and Dennis 1999). Because of the disease severity and mandatory reporting requirements, it is unlikely that many human cases go un-reported in the United States. Annual human plague case reports by county were obtained from the ADHS (
Meteorological data
In the absence of latitude and longitude coordinates for the blood sample collection locations, we extracted meteorological data from 80 randomly generated points in the area of interest (ArcGIS, ESRI, Redlands, CA). The mean distance between points was 15 km to facilitate unique pixel selection with respect to the 2.5 arcmin (4 km2) resolution climate data. The areas for the randomly selected points were limited to public lands (Bureau of Land Management, State Land, U.S. Fish and Wildlife Service, Military) in Coconino Co., Yavapai Co., and in the southern parts of Apache and Navajo counties consistent with where the coyote samples were most likely collected (Fig. 1).
Monthly average minimum and maximum temperature (°F) and precipitation (inches) data for 1970–1998 were extracted from the online PRISM Data Explorer (
Because we were looking for meteorological predictors of annual variance in coyote seroprevalence rates, we also inspected monthly temperature and precipitation data for extreme values. Months with greater variability for either temperature (October and December minimum temperatures; March, April, May, June, and July maximum temperatures) or precipitation (cumulative January, February, and March) were identified for testing as independent variables.
A total of 21 variables were tested against the square root transformed percent of coyote titers above 1:256 to identify significant temporal lags up to 5 years for testing in the model. Temporal lags allow for the possibility of predictive models, where meteorological data from 1 year should have a measureable effect on plague activity in subsequent years (Gage and Kosoy 2005). Seventeen possible variables were significantly correlated and tested in the model (Spearman correlation coefficient, r s>0.3).
Analysis of association between coyote and human data
We dichotomized the human case data at the median into “elevated human case years” (i.e., years with two or more human cases) or “average human case years” (i.e., years with one or no human cases). We used logistic regression to test whether elevated human case years were associated with annual seroprevalence in coyotes across all four counties. We then sought a threshold for the percent of coyote titers ≥1:256 tested to identify elevated human case years that would maximize sensitivity (i.e., the correct identification of elevated human case years) and specificity (i.e., the correct identification of average human cases years). In addition, positive (PPV) and negative predictive values (NPV) are reported as measures of the correctness of using coyote seroprevalence rates to identify elevated human years or average human case years, respectively.
Modeling the association between coyote seroprevalence and meteorological data
To model annual variation in coyote seroprevalence rates, we used forward stepwise linear regression. All variables were normally distributed (Shapiro–Wilk W test for normal data p≥0.12). Each of the 17 possible predictors (Table 1) was tested in a univariate model. Predictors were added to the model based on improvements in the coefficient of determination (r 2). Once the final predictors were determined, variables were tested for multicolinearity. Correlations >0.9 were considered indicative of multicolinearity and these variables were not included in the same model. The models were compared using Akaike Information Criterion, and variables were added until the difference in Akaike Information Criterion between models was ≤2, indicating that the models were comparable and the more parsimonious model was selected (Burnham and Anderson 2002).
The most parsimonious model was evaluated using the leave-one-out cross-validation (LOOCV) method (Martens and Næs 1989, Efron and Tibshirani 1993), consisting of serial removal followed by replacement of each year to calculate the r2. The LOOCV output was used to calculate a 95% confidence interval (CI) for the r2. Highly variable r2 values indicated that the model was overly sensitive to specific years. If the r2 of our model fell within the 95% CI calculated for the r2, the model was considered stable.
We then compared the predictions derived from meteorological data with respect to both the observed coyote and human data. The meteorological-based model predictions of percent seropositive coyotes for each year were dichotomized at the determined threshold and compared with the observed coyote seroprevalence rates and with the dichotomized human data. Again, sensitivity, specificity, PPV, and NPV are presented as measures of the diagnostic value of the predicted coyote seroprevalence rates.
All statistical analyses were conducted in Stata v10.0 (StataCorp LP, College Station, TX). Data that were transformed to normal were back transformed for presentation.
Results
Associations between coyote and human data
A significant positive association between annual human cases and annual coyote seroprevalence rates (square root transformed for normal Shapiro-Wilk W=0.96, Z=0.03, p=0.49) was observed. For every percent increase in coyote seroprevalence rates, the odds of having an elevated plague year increased by 2.64 (95% CI: 1.0–2.63; X2=5.06, df=1, p=0.03; Fig. 2).
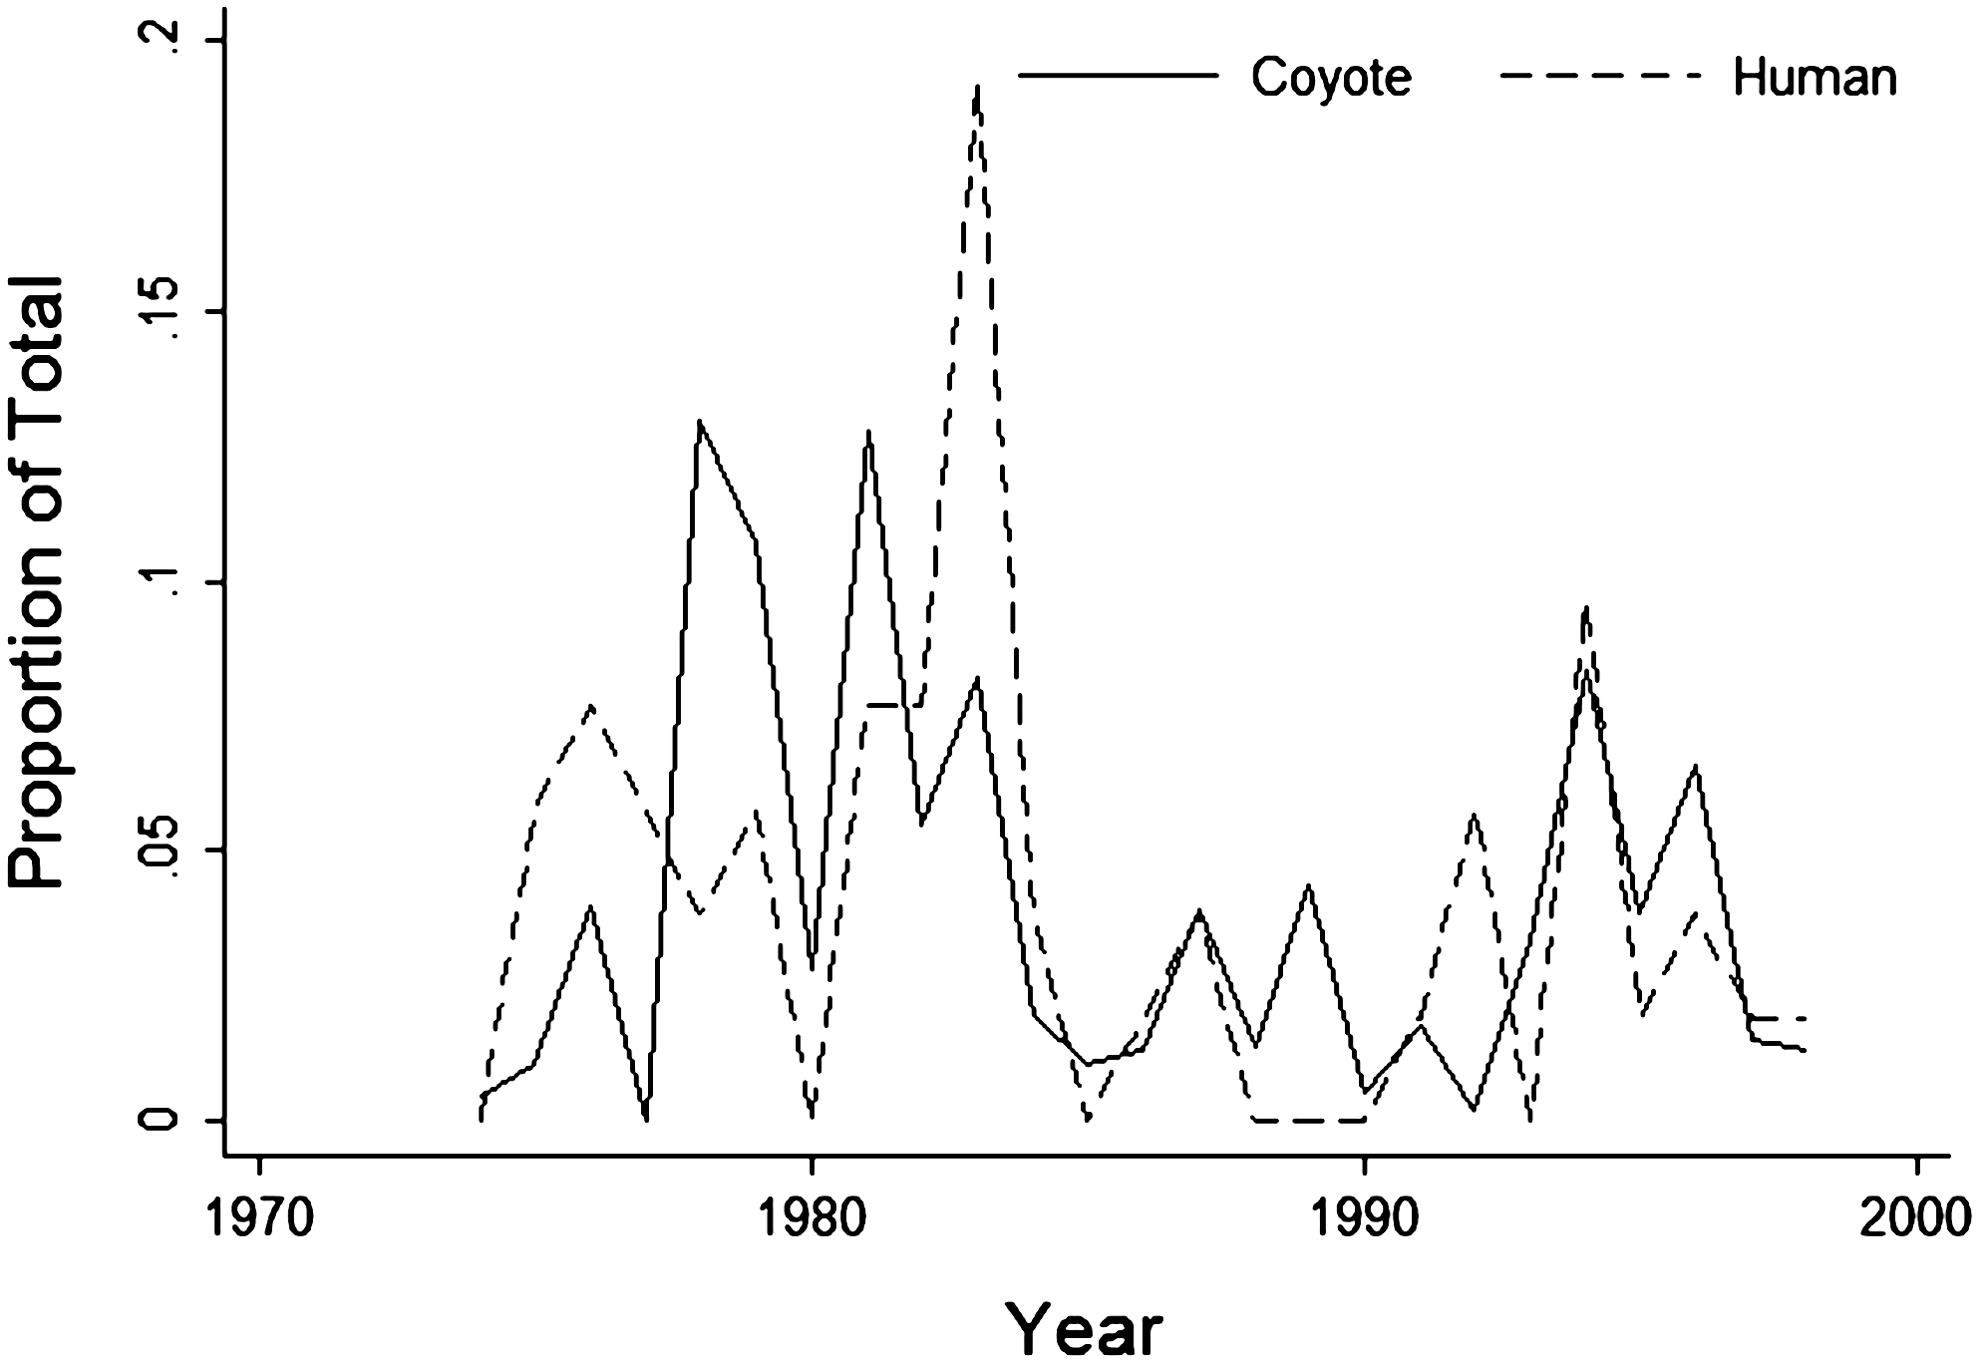
Comparison of human cases and seropositive coyote samples by year. The y-axis is the annual proportion of total to facilitate comparing human (median per year=2) and coyote data (median per year=14%).
Classifying the coyote data as elevated when the percent positive (titers ≥1:256) for a given year was >17% resulted in 76% agreement with the dichotomized human case years (elevated=≥2 cases; average=1 or no cases) (Table 2). For this relatively rare disease we were willing to accept a model with high specificity (83.3%) and moderate sensitivity (69.2%). That is, though some elevated human case years might not be identified we had greater confidence with respect to the ability to detect average human case years. The positive and negative predictive values were high (81.8% and 71.4%, respectively), indicating that the 17% threshold accurately identified years of average or elevated human cases.
Two or more cases per year=elevated human case years.
Dichotomized where years where 17% or more of samples have titers of ≥1:256 are considered elevated.
Sn, sensitivity; Sp, specificity; PPV, positive predictive value; NPV, negative predictive value; Accuracy, overall accuracy.
Coyote seroprevalence and meteorological data model
The best forward stepwise linear regression model of interannual coyote seroprevalence included four variables: a positive association with the previous year's winter minimum temperature and the current year's maximum in July, and a negative association with the previous May's maximum temperature and the April maximum temperature 3 years prior (F(4, 20)=14.88; r 2=0.70, p<0.001; Table 3 for model comparison and Fig. 3 for predictions). This model was stable across the 25 years of data (LOOCV 95% CI: 0.69–0.71).

Observed (dark circle) and predicted (open circle) coyote seroprevalence rates based on four meteorological variables (previous year's winter minimum temperature, current year July temperature maximum, previous May maximum temperature, and the 3-year prior April temperature maximum) identified by linear regression analysis (F(4, 20)=14.88; r2=0.70, p<0.001). Bars indicate the difference between observed and predicted values for the seroprevalence rates of coyote samples. With respect to the 17% threshold (dashed line), shaded bars indicate concordance where both the observed and predicted values were above or both were below the threshold and open bars indicate discordance where observed values were above the threshold, but were predicted to be below threshold or vice versa).
AIC, Akaike Information Criterion; CI, confidence interval.
Dichotomizing the predictions at an annual seroprevalence rate of 17% resulted in 81.8% of years being correctly classified as elevated and 85.7% as average (Table 4 and Fig. 3). Specificity, the number of average coyote seroprevalence years identified as average was 85.7%. The sensitivity of the predictions derived from meteorological data was also high; 81.8% of elevated years were identified as elevated.
With respect to the observed human cases, the PPV of using predicted coyote seroprevalence to identify years with elevated human cases was 72.7% and the NPV was 64.3% (Table 4). Overall accuracy was 68% and sensitivity was moderate (61.5% of elevated human case years were identified as elevated). Specificity was good (75%).
Discussion
To our knowledge, this is the first time a temporal association between human plague cases and coyote seroprevalence rates has been quantifiably shown. In addition to quantifying this temporal association, we identified meteorological variables that were predictive of annual coyote seroprevalence rates.
The positive association between human cases and coyote seroprevalence rates was expected because coyotes prey upon plague-susceptible rodents over large areas and typically survive the infection and seroconvert (Archibald and Kunitz 1971, Willeberg et al. 1979, Gage et al. 1994). It is assumed that passive coyote sampling may detect less noticeable rodent epizootics, which pose a risk to humans from infectious flea bites encountered while outside or brought to the home by their companion animals (Eidson et al. 1988, Gould et al. 2008). Indeed, Holt et al. (2009) showed a significant association between plague activity in ground squirrels and passive coyote seroprevalence in California. In contrast to previous attempts to establish an association between human plague cases and coyote seroprevalence (Hopkins and Gresbrink 1982, Brinkerhoff et al. 2009), our approach of restricting positive titers to ≥1:256 in a highly endemic area with enhanced surveillance likely influenced our ability to identify a correlation.
We were able to predict annual coyote seroprevalence rates (84% accuracy at the 17% seropositivity threshold) using just four meteorological variables. Temperature and above-average winter–spring precipitation have been shown to be associated with the annual occurrence of human plague cases (Parmenter et al. 1999, Enscore et al. 2002) presumably because of their influence on rodent reproduction and primary plant production (Davis 2005, Kastrud 2007). These same meteorological events markedly influence flea activity (Bacot and Martin 1924, Amin 1966, Olson 1969, Cavanaugh and Marshall 1972). The associations between warmer winter minimum temperatures and milder spring temperatures were likely due to the beneficial effects of milder weather on rodent and flea population growth.
An explanation for the positive association with maximum temperature in July of the current year was less apparent. We expected summers with temperatures that exceeded 27°C (80.6°F) to have a negative effect on plague occurrence (Bacot and Martin 1924, Cavanaugh and Williams 1977). However, we found a positive association with July maximums despite that average July maximum temperatures (32°C [89.7°F]) were above this dampening threshold. This was similar to the findings of Enscore et al. (2002), who demonstrated a positive association between annual human cases and the number of days in a year with temperatures >32.2°C (90°F), and a negative association with days over 35°C (95°F). Likewise, Ben Ari et al. (2008) used a higher temperature threshold (days >37°C) along with the annual human plague incidence per county and the Pacific Decadal Oscillation to model annual human plague cases in the western United States.
A possible explanation for the differences in how temperature relates to plague occurrence highlights the importance of microclimates and data resolution. For example, Brown et al. (2010) reported that elevation was important to the annual distribution of companion animal plague cases in New Mexico; higher elevations showed a more sporadic distribution of cases over the year, whereas lower elevations exhibited a distinct peak that collapsed when temperatures rose. Thus, while excessively high temperatures may reduce plague activity locally, the averaged monthly temperatures derived from 4 km2 pixels we used here may be too coarse a scale to accurately predict plague dynamics on a smaller scale.
The association between meteorological events and plague occurrence is specific to geographic location. A comparative study of meteorological predictors of prairie dog epidemics in Montana and Colorado found a strong association in Montana, but no measurable association in Colorado (Collinge et al. 2005). Likewise for human cases, models built for plague incidence in northeastern Arizona were not predictive in northwestern New Mexico though similar variables were significant in both models (Enscore et al. 2002). The 17% threshold we identified here is specific to this region in Arizona and should not be applied elsewhere without further testing.
Improving the spatial resolution of these data could improve the utility of coyote serporevalence data. Although the home range of transient coyotes can be >100 km2 and occasional long distance travel (e.g., >300 km in 6 months) have been documented, mean home range sizes for adult coyotes is about 10 km2 (Andelt and Gipson 1979, Gese et al. 1988, Rosatte 2002). Meteorological data vary in space, especially within the diverse habitat of the Southwest (Parmenter et al. 1995, Sheppard et al. 2002). We expect a stronger association between coyote seroprevalence rates and meteorological predictors if latitude and longitude data were available for the samples.
We posit that, in the absence of intensive surveillance efforts such as the pet surveillance carried out by the New Mexico Department of Health [described in Brown et al. (2010)], coyote data will continue to be useful for the spatial delineation of plague risk and potentially will be useful for detection of meteorological related changes in the temporal distribution of plague. Identification of collection date and specific location of coyote serosurveillance samples would allow for more accurate predictions of increased risk. However, the data as collected from these four Arizona counties represent the best coyote surveillance data available. The collaboration between the ADHS and the USDA resulted in regular collections in a semiregular spatial distribution. Many of the other nobuto strips submitted to the CDC for processing have more sporadic sampling that is highly localized to limited areas. These latter data are less likely to be useful beyond periodic confirmation that plague is in an area.
Footnotes
Acknowledgments
We thank numerous employees of the USDA, Animal and Plant Health Inspection Services, Wildlife Services, for the collection of coyote samples. We thank John Young, CDC, NCEZID, DVBD, for helpful discussion. This research was supported in part by the appointment of Heidi E. Brown to the Research Participation Program at the CDC, NCEZID, DVBD, administered by the Oak Ridge Institute for Science and Education through an interagency agreement between the U.S. Department of Energy and the CDC.
Disclosure Statement
No competing financial interests exist.