
Abstract
Lyme disease is the most common vector-borne disease in the United Kingdom and its incidence has been increasing in recent years. However, limited information is available on its epidemiology and dynamics in the U.K. A survey in wild deer to investigate the presence of antibodies reactive to Borrellia burgdorferi was conducted to obtain initial information on the distribution pattern of the spirochete in England and Wales. Samples from roe deer (n=604) and red deer (n=80) were collected in eight different locations. An ELISA protocol was developed to identify antibodies reactive to B. burgdorferi s.l. Seropositivity was investigated by location of sampling, over time, and in relation to the level of deer tick infestation. Twenty-three percent of animals had a positive serology. Seroprevalence varied according to location with the southern forestry districts showing higher seroprevalence rates. One northern location showed an unexpectedly high proportion of positive deer. Variations in the proportion of positive animals were also observed over time. Tick load was higher from spring through autumn, and its relation to seroprevalence was compatible with higher tick infectivity during the spring and summer months. This study represents the first assessment of distribution of Borrelia antibodies in deer in the U.K. and identifies areas that are potential hot spots for human Lyme borreliosis. Targeted epidemiological studies should be conducted to evaluate the actual disease risk for humans.
Introduction
In western Europe, Borrelia burgdorferi sensu latu infection is transmitted by ticks of the species Ixodes ricinus. Several animal species are reservoirs of the pathogen, making its epidemiology and transmission cycle complex (Barbour 1998; De Meneghi 2006; Linard et al. 2007; Jaenson et al. 2009). Borrelia infection causes disease in humans and in certain animals such as ruminants, horses, and dogs (Williams et al. 2002). Various Borrelia burgdorferi genospecies are known to cause Lyme disease, five of which have so far been identified as pathogenic in Europe (Jaenson et al. 2009) and three others, although they have been found in human cases, are of unknown pathogenicity at present (European Concerted Action on Lyme Borrelliosis). Ixodes ricinus ticks are commonly found in the British Isles (Pietzsch et al. 2005; Scharlemann et al. 2008; Jameson and Medlock 2011). Small mammals and birds are the most important reservoir for B. burgdorferi infection. However, other vertebrates such as deer, although incompetent reservoirs for the spirochete, act as feeding source for ticks, potentially contributing to the dissemination of this infection (Simpson 2002; Williams et al. 2002). A rapidly increasing wild deer population in England, estimated to be 320,000 animals in 2004 (Alastair Ward, personal communication) is often mentioned as a major factor in increased tick abundance (Bohm et al. 2007).
Previous studies conducted in various European countries have found a high proportion of wild deer with specific antibodies against B. burgdorferi antigen, demonstrating that although unable to infect vectors, they are usually in contact with infected ticks (Martinez et al. 1999; Travnicek et al. 2003; Skarphedinsson et al. 2005). Therefore, it has been suggested that deer could act as sentinels for the presence of the pathogen in a given area (Skarphedinsson et al. 2005). To date, partly due to the limited interest in the disease and the historically low number of human cases, there are no systematic studies on the distribution of antibodies against B. burgdorferi in deer in England and Wales (Lovett et al. 2008). Therefore, the aims of this study were to conduct a general assessment of the pattern of B. burgdorferi presence in various locations in England and Wales using antibodies in deer as a proxy, to evaluate associated risk factors for higher seroprevalence, and to contribute to our understanding of this infection in the U.K.
Materials and Methods
Samples and data collection
Blood samples were collected from wild red deer (Cervus elaphus) and roe deer (Capreolus capreolus) at the time of culling in eight different locations across England and Wales from April 2009 to March 2010. Seven forestry commissions (FC) in England and one in Wales participated in the study, representing diverse eco-geographical areas (Fig. 1). A few additional samples (n=12) were received from non-FC stalkers. Convenience sampling was performed by instructed rangers. Blood samples were collected in plain tubes and were kept refrigerated (+4°C) until postage to the laboratory. Rangers recorded the degree of tick infestation of each deer sampled based on three categories: none (no visible ticks in the animal body), low (only few ticks on the legs), and high (ticks present on both the lower and the upper parts of the animal's body). Up to 5 ticks were collected from each sampled deer infested with ticks. Collection of ticks was not systematic (i.e., not proportional to the tick infestation level or representative of the range of ticks on the animal). The ticks were morphologically identified as previously described (Hillyard 1996).
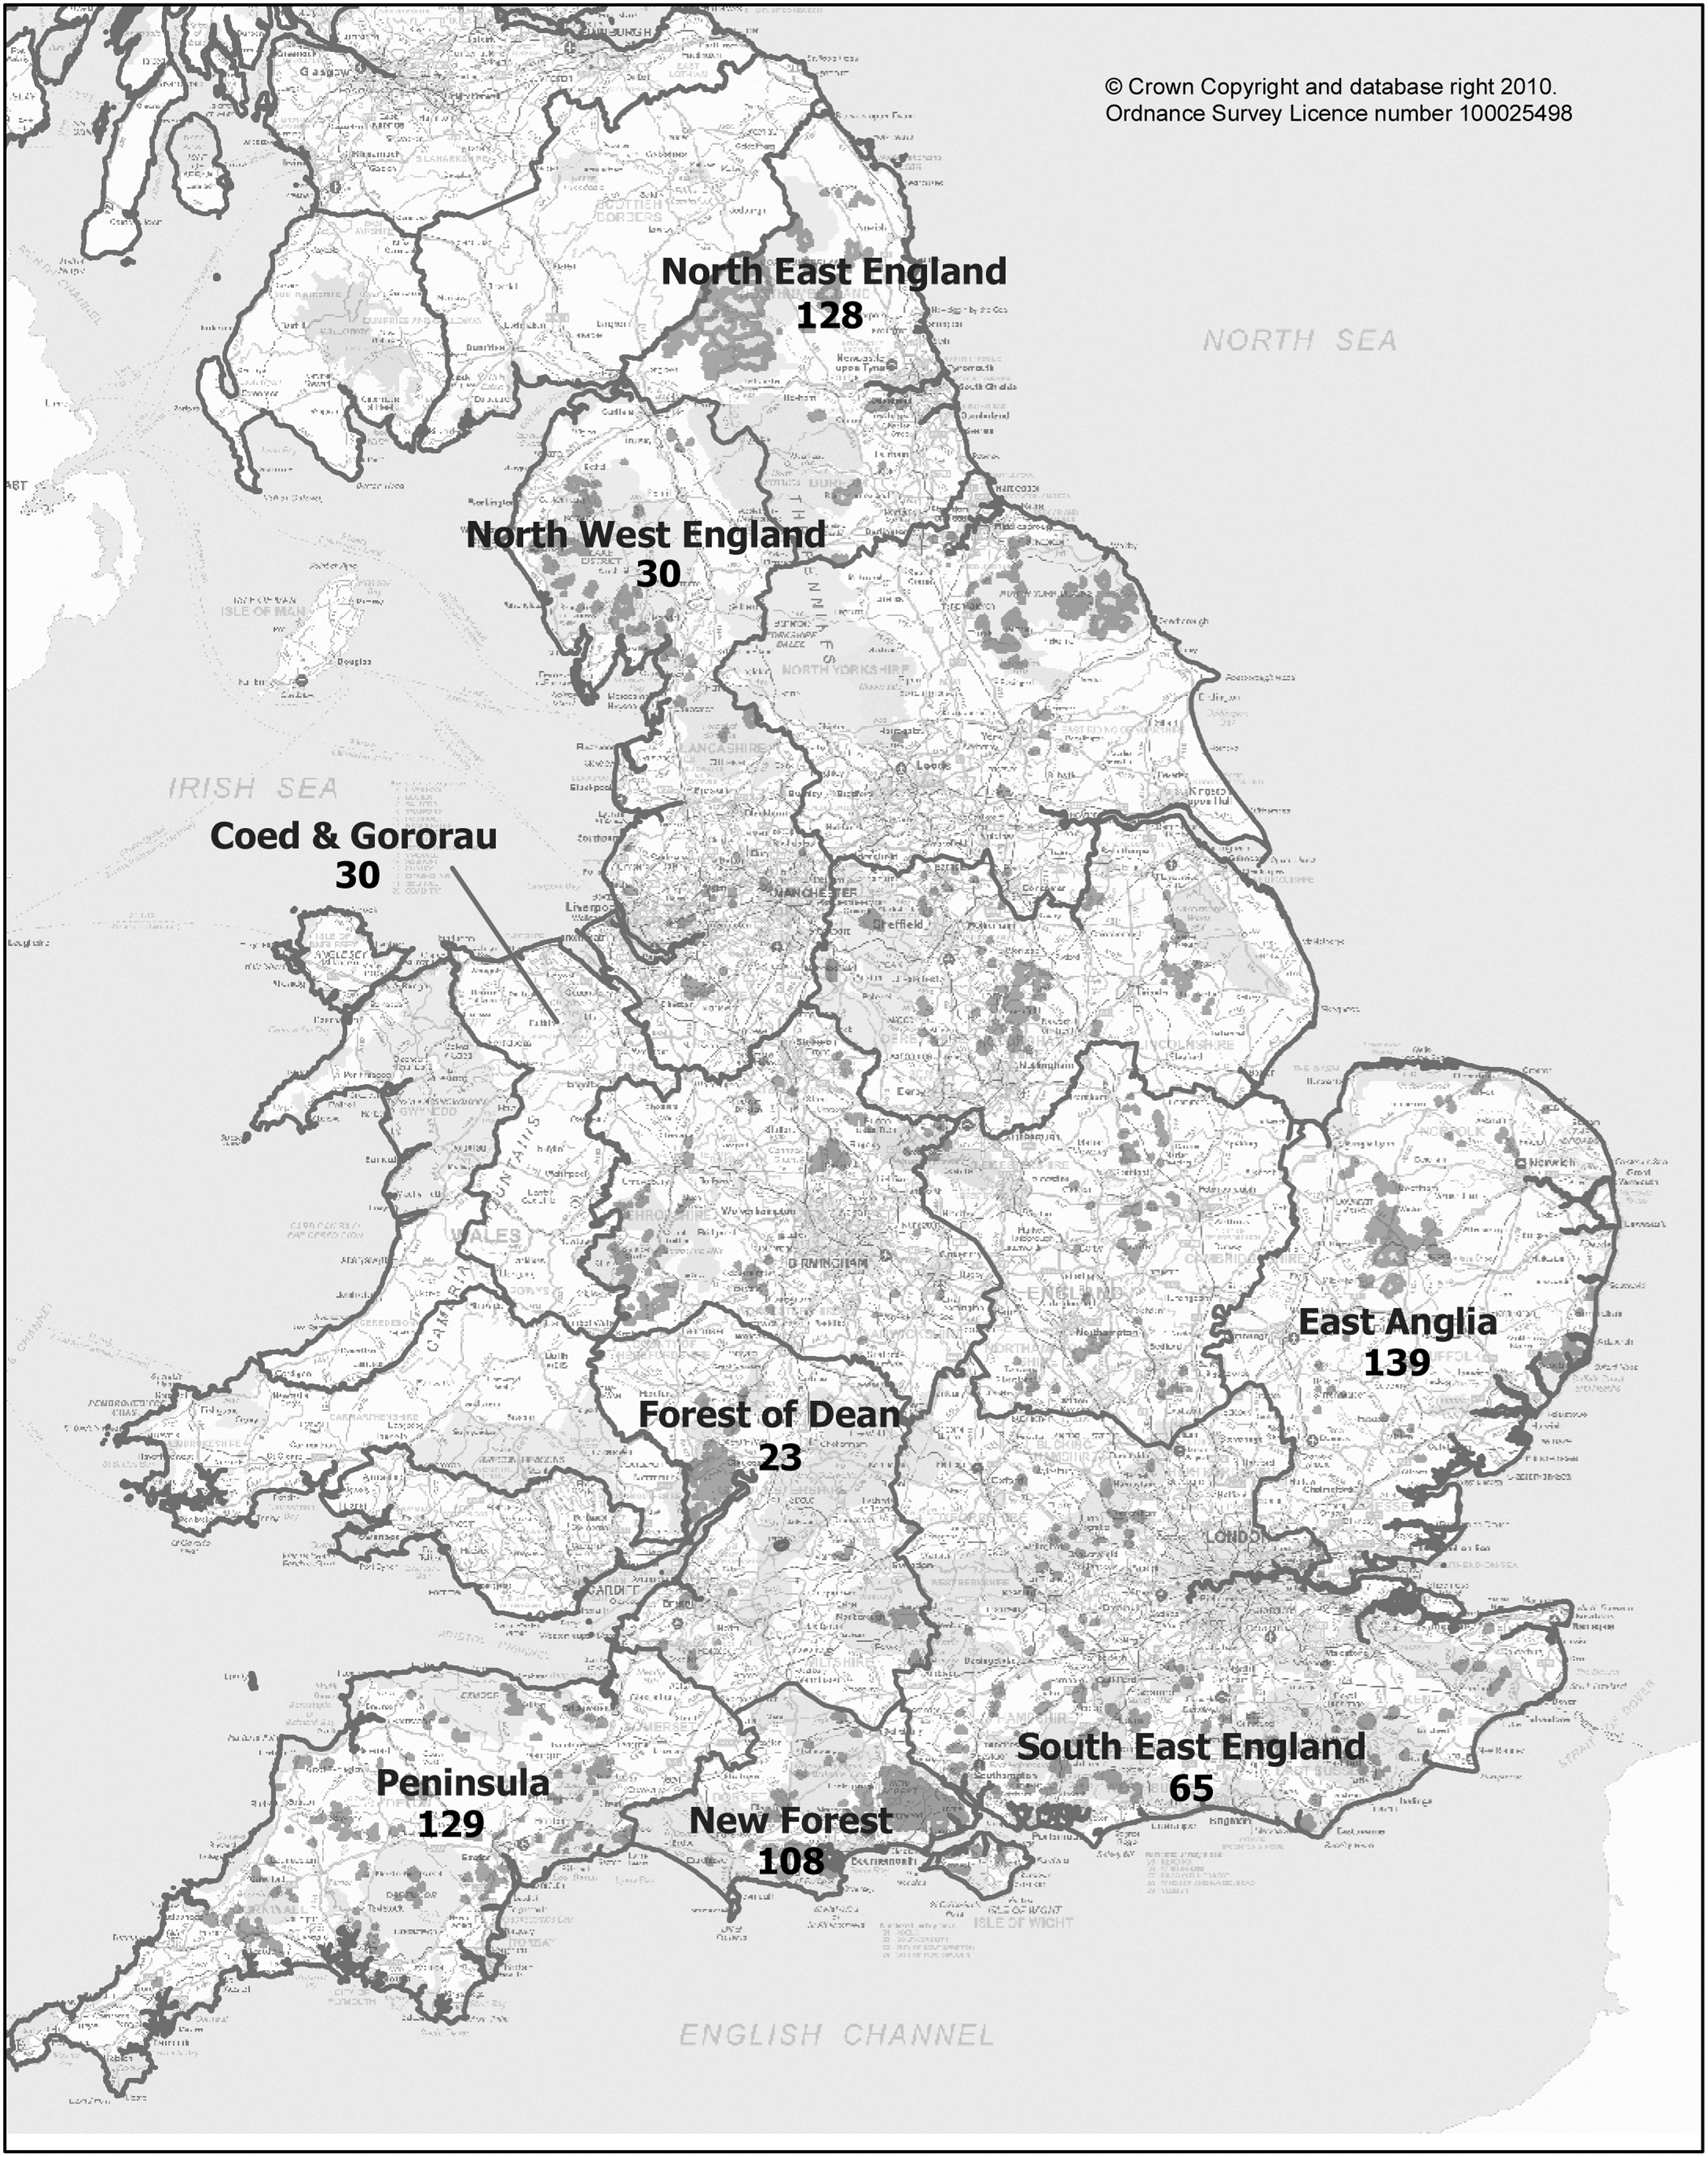
Map showing sampling locations (England and Wales) and total numbers of samples collected.
Information on the characteristics of each of the sampled deer was obtained from the centralized database of the forestry commission, where information on each culled deer in the U.K. is kept. This included the animal identification number (National TAG number), the date and location of culling (FC name and number), the species, gross weight, and approximate age (<1 year, 1–2 years, and ≥3 years), as well as the National Grid Reference coordinates for the point where the animal was culled.
On arrival to the laboratory, the samples were centrifuged and sera was separated and stored at −20°C until analysis.
Sampling frequency varied over the year, as did the relative proportion of deer species and the sex of sampled animals. These variations are determined by the structure of the National culling program, with roe deer males being culled from April to October each year, red deer males culled from August to April each year, and females of both species being culled from November until the beginning of the calving season at the end of March.
Antibody testing
An ELISA protocol for antibodies against Leishmania spp. (Riera et al. 1999) was adapted to detect B. burgdorferi antibodies in sera from deer, taking into consideration ELISA protocols previously described by other authors (Magnarelli et al. 1993; Bhide et al. 2004). Briefly, microtiter plates were coated with 0.1 mL of B. burgdorferi (30-AL40; Fitzgerald Industries International, Concord, MA) whole antigen solution (10 μg mL−1 in 0.05 M carbonate bicarbonate, pH 9.6), and incubated overnight at 4°C. One hundred microliters per well of deer sera, diluted 1:100 in PBS+0.05% Tween 20 (PBST)+1% dried skimmed milk (PBST-M), was incubated for 1 h at 37°C. After three washes with 0.2 mL PBST and one wash with 0.2 mL PBS, 100 μL per well of rabbit anti-deer IgG conjugated to horseradish peroxidase and diluted 1:1000 in PBST-M was added and incubated for 1 h at 37°C. The washes were then repeated. The substrate solution, orthophenylenediamine dichloride (0.5 mg mL−1; Pierce, Rockford, IL), was added at 100 μL per well and developed for 20 min at room temperature. The reaction was stopped with 50 μL of 2 M H2SO4. Absorbance values were read at 490 nm in an automatic ELISA reader (Biotek EL808 9 Channel absorbance reader; BioTek Instruments Inc., Winooski, VT). B. burgdorferi-positive (n=10) and B. burgdorferi-negative sera controls (n=40) from wild white-tailed deer as determined by immunofluorescence antibody assay were obtained from the Connecticut Agricultural Experiment Station, New Haven. All reagents were tested with the positive and negative controls to optimize working conditions and ensure standardization. The diagnostic accuracy of the developed ELISA was evaluated using receiver operating characteristic curve (ROC) analysis. This allows assessment of the discrimination performance of a test, or the capacity to correctly identify positive and negative samples (Gardner and Greiner 2006; Tripepi et al. 2009). ROC curves were also used to identify the cut-off for the positive value of the ELISA test (the value that determines a positive result) by “identifying the optical density (OD) value that maximizes the Sensitivity (Se) and Specificity (Sp) of the test” (Gardner and Greiner 2006; Tripepi et al. 2009). ROC curves, including Se and Sp of the selected cut-off for positive value, were calculated using SPSS statistical software (PAWS statistics 18; SPSS Inc., IBM, Chicago, IL). Other measures of ELISA performance, such as within-assay and inter-assay precisions, were calculated with coefficients of variation (CV) expressed as a percentage (mean/SD; Stockham and Scott 2008). The within-assay CV was calculated by three replicates of eight positive and four negative controls within the same ELISA plate. The inter-assay CV was calculated from the values observed for four positive controls on eight different days. The ELISA was considered of good precision if the intra- and inter-assay CV were below 10% and 20%, respectively. The same positive and negative controls were always included in each plate. To minimize variability, all conditions were kept as constant as possible on the various days of testing. ELISA plates were prepared and stored at 4°C and used within 5 days of preparation. Commercial antigen from the same batch was used in all experiments.
Data analysis
STATA software (STATA 9.0; StataCorp LP, College Station, TX) was used to analyze the data. The spatial and temporal relations between seropositivity and the level of tick infestation were described. The proportion of seropositive animals (seroprevalence) was calculated for each of the eight locations in the study and compared to the level of tick infestation in the area, estimated as the proportion of animals recorded as carrying ticks. For those sampling sites which provided more than 100 samples (3 locations), the relation between seroprevalence and tick infestation was explored over time. For this purpose, time was split into four categories (winter: December to February; spring: March to May; summer: June to August; autumn: September to November). Moreover, in each of those 3 locations, the influence of season on seropositivity was further assessed (Pearson's chi-square test). At the individual animal level, the association between specific animal characteristics (including tick infestation, time of sampling, species, age, and sex), and the serological findings was also assessed. This was done using conditional logistic regression in order to account for the degree of clustering of the samples in the eight specific locations.
Results
Deer sampling
A total of 684 blood samples from deer were collected over 12 months. The sampling rate was not homogenous across locations, and ranged between a minimum of 20 to a maximum of 139 samples (Fig. 1). Twelve samples were received from stalkers outside the FCs, and were combined with the FC samples for the purposes of analysis. Thirty-two samples did not report the origin and were therefore excluded from the analysis. The characteristics of deer sampling are listed in Table 1. Red deer were sampled in only three locations, due to the more restricted distribution of this species in the country, and represented no more than 30% of the total samples for each area. Fifty-seven percent of the deer were infested with ticks, and the majority of those were reported as having a low infestation level. All ticks (n=2207) were identified as Ixodes ricinus, with female ticks being three times more frequently collected than males. Co-infestation with insects of the order Diptera (n=16) was observed in 10 deer.
Number of samples with information on that variable (out of a total of 652 samples).
Antibody testing
The results of the ROC analysis demonstrate the robust accuracy of the developed test (area under the curve=0.975; 85% CI 0.932,1.00). Sera with an OD on the ELISA higher than 0.55 were considered positive. This cut-off for the positive value corresponded to 90% sensitivity (95% CI 0.54,0.99) and 93% specificity (95% CI 0.79,0.98). The reproducibility of the test was good, with within-assay and inter-assay coefficients of variation of 8% and 13.7%, respectively.
Overall, 156 blood samples (23%) were found to be positive for B. burgdorferi s.l. Seroprevalence and tick presence by location are summarized in Figure 2. The proportion of seropositive animals varied among locations in the study, as did the proportion of animals presenting with ticks. East Anglia showed the highest seroprevalence, followed by the rest of the southern locations. In the northern areas, seroprevalence differed greatly across locations. Thirty-seven percent (37%) of animals in the North West District had a positive serology, while the Kielder District produced very few positive animals (1.5%). The observed serological pattern followed, to a great extent, the degree of tick infestation, with higher seroprevalence observed in areas with higher tick infestations. This relationship was very clear in Kielder District, where very few animals presented with ticks (21%), and only two deer had a positive serology. It was also very conspicuous in East Anglia, where high infestation rates were coupled with high proportions of seropositive animals. The Lake (Wales) and Kielder Districts were the areas with lower numbers of infested deer. Indeed, none of the deer sampled in Wales (n=30) were infested with ticks, and none had antibodies against B. burgdorferi.
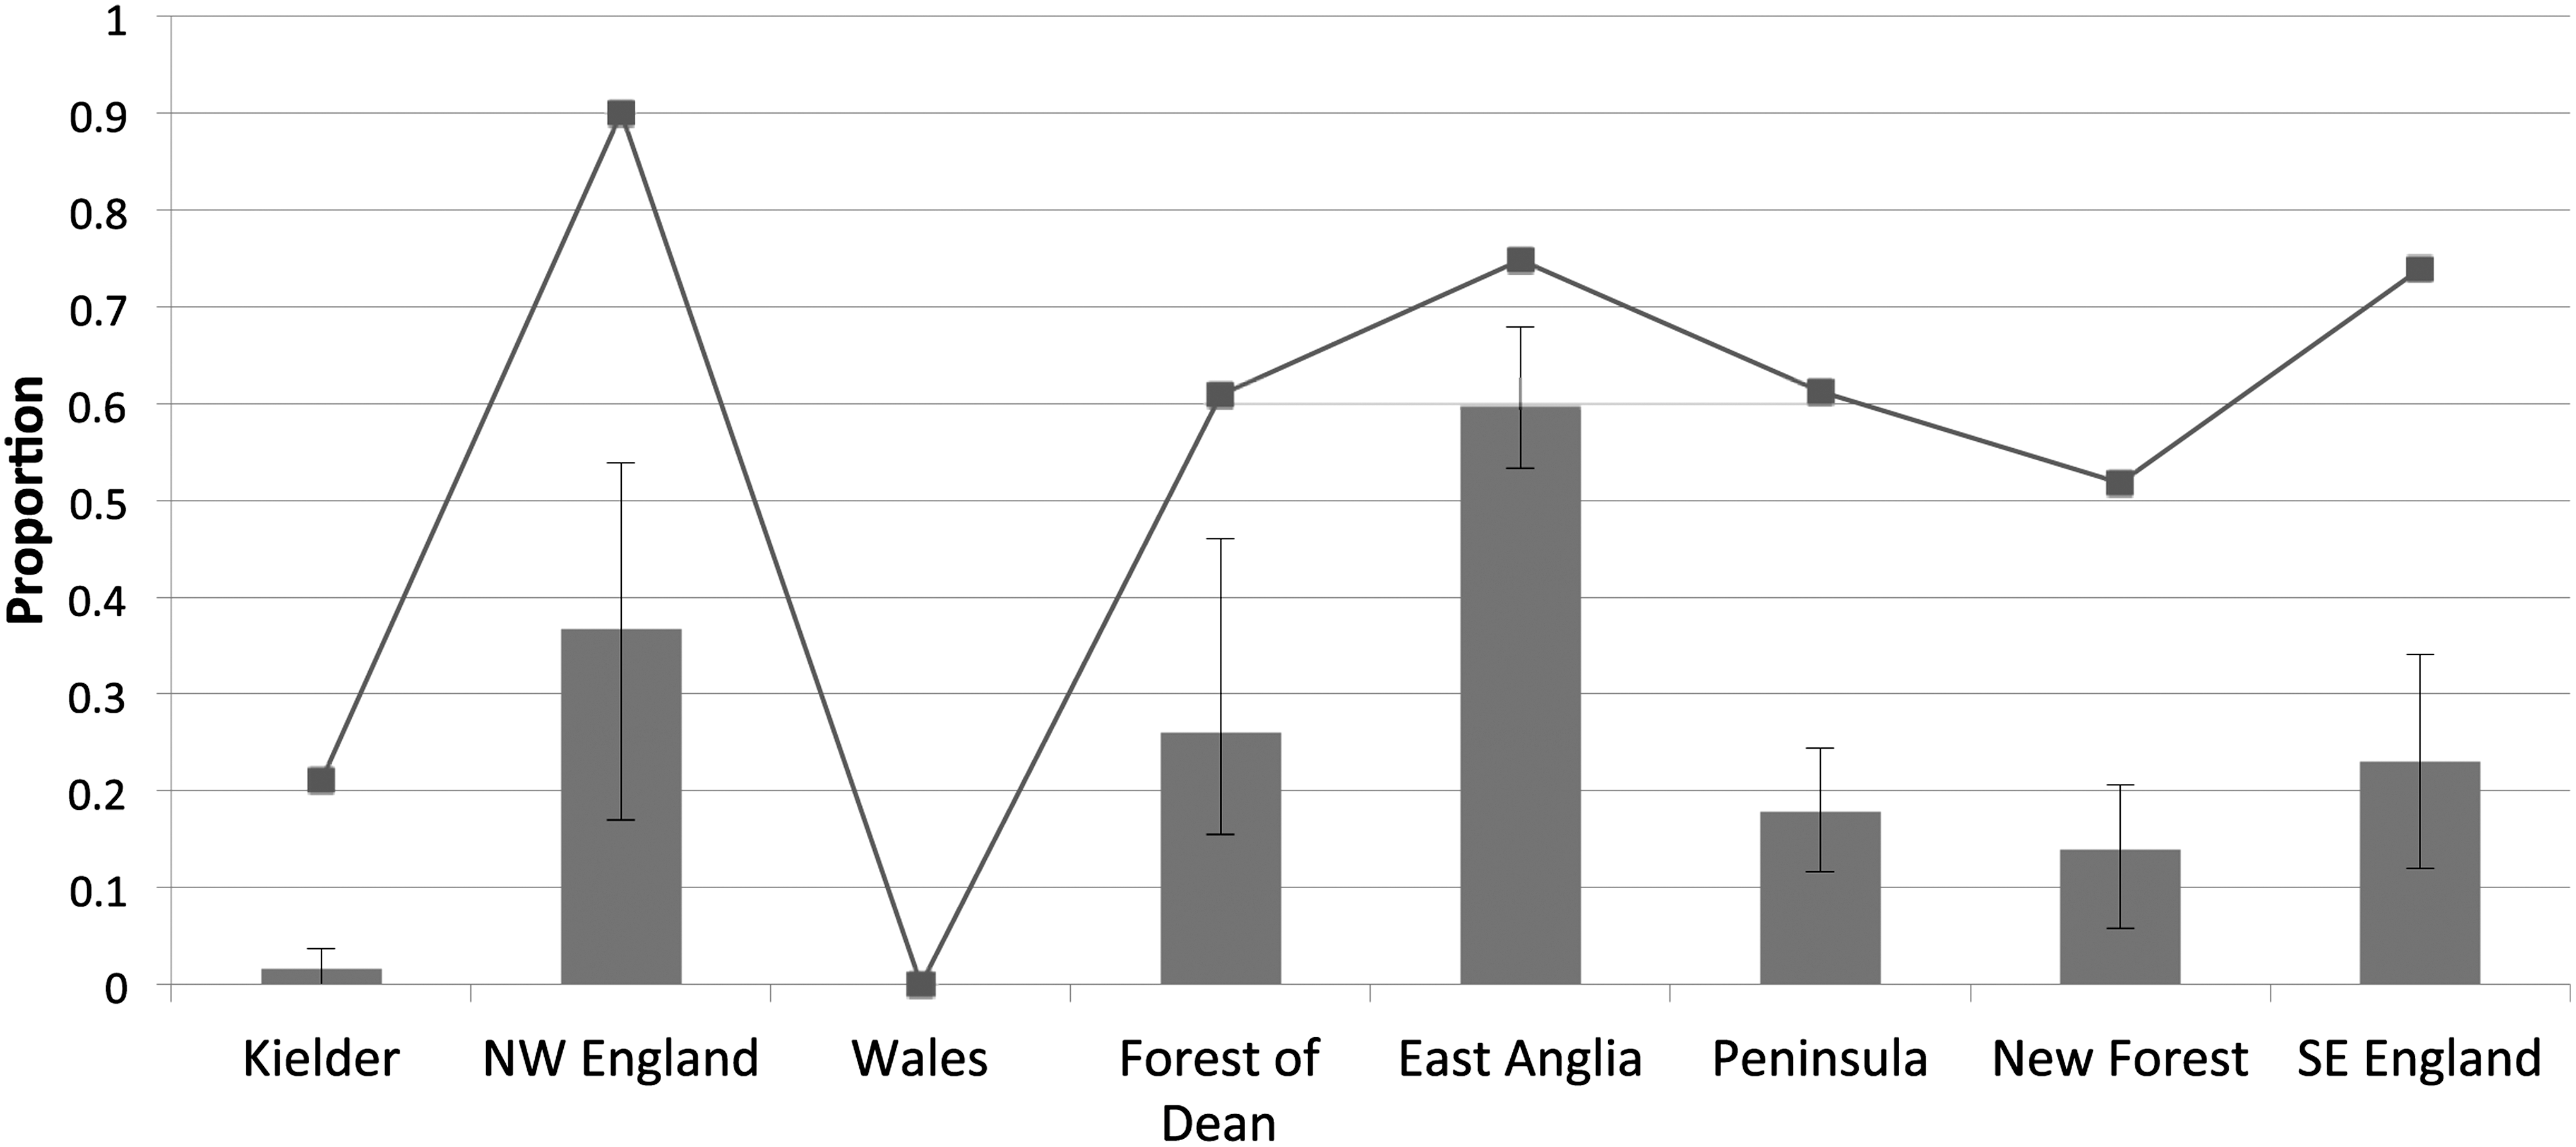
Seroprevalence and tick infestation by location. Chart showing seroprevalence in wild deer (95% CI) by location, and the proportion of animals infested with ticks.
The seroprevalence and tick infestation over time are described for three locations in Figure 3. In general, the proportion of seropositive animals varied over the year, with more positive animals observed in spring (March to May). When exploring this observation further, we found a strong association between the season and the outcome of serology (p<0.01) in two locations (East Anglia and Peninsula), while no association was found in the New Forest District (p=0.12). The proportion of deer infected with ticks increased from April onwards, which reveals a long-lasting presence of ticks in forest areas, with decreased activity only in the winter months.
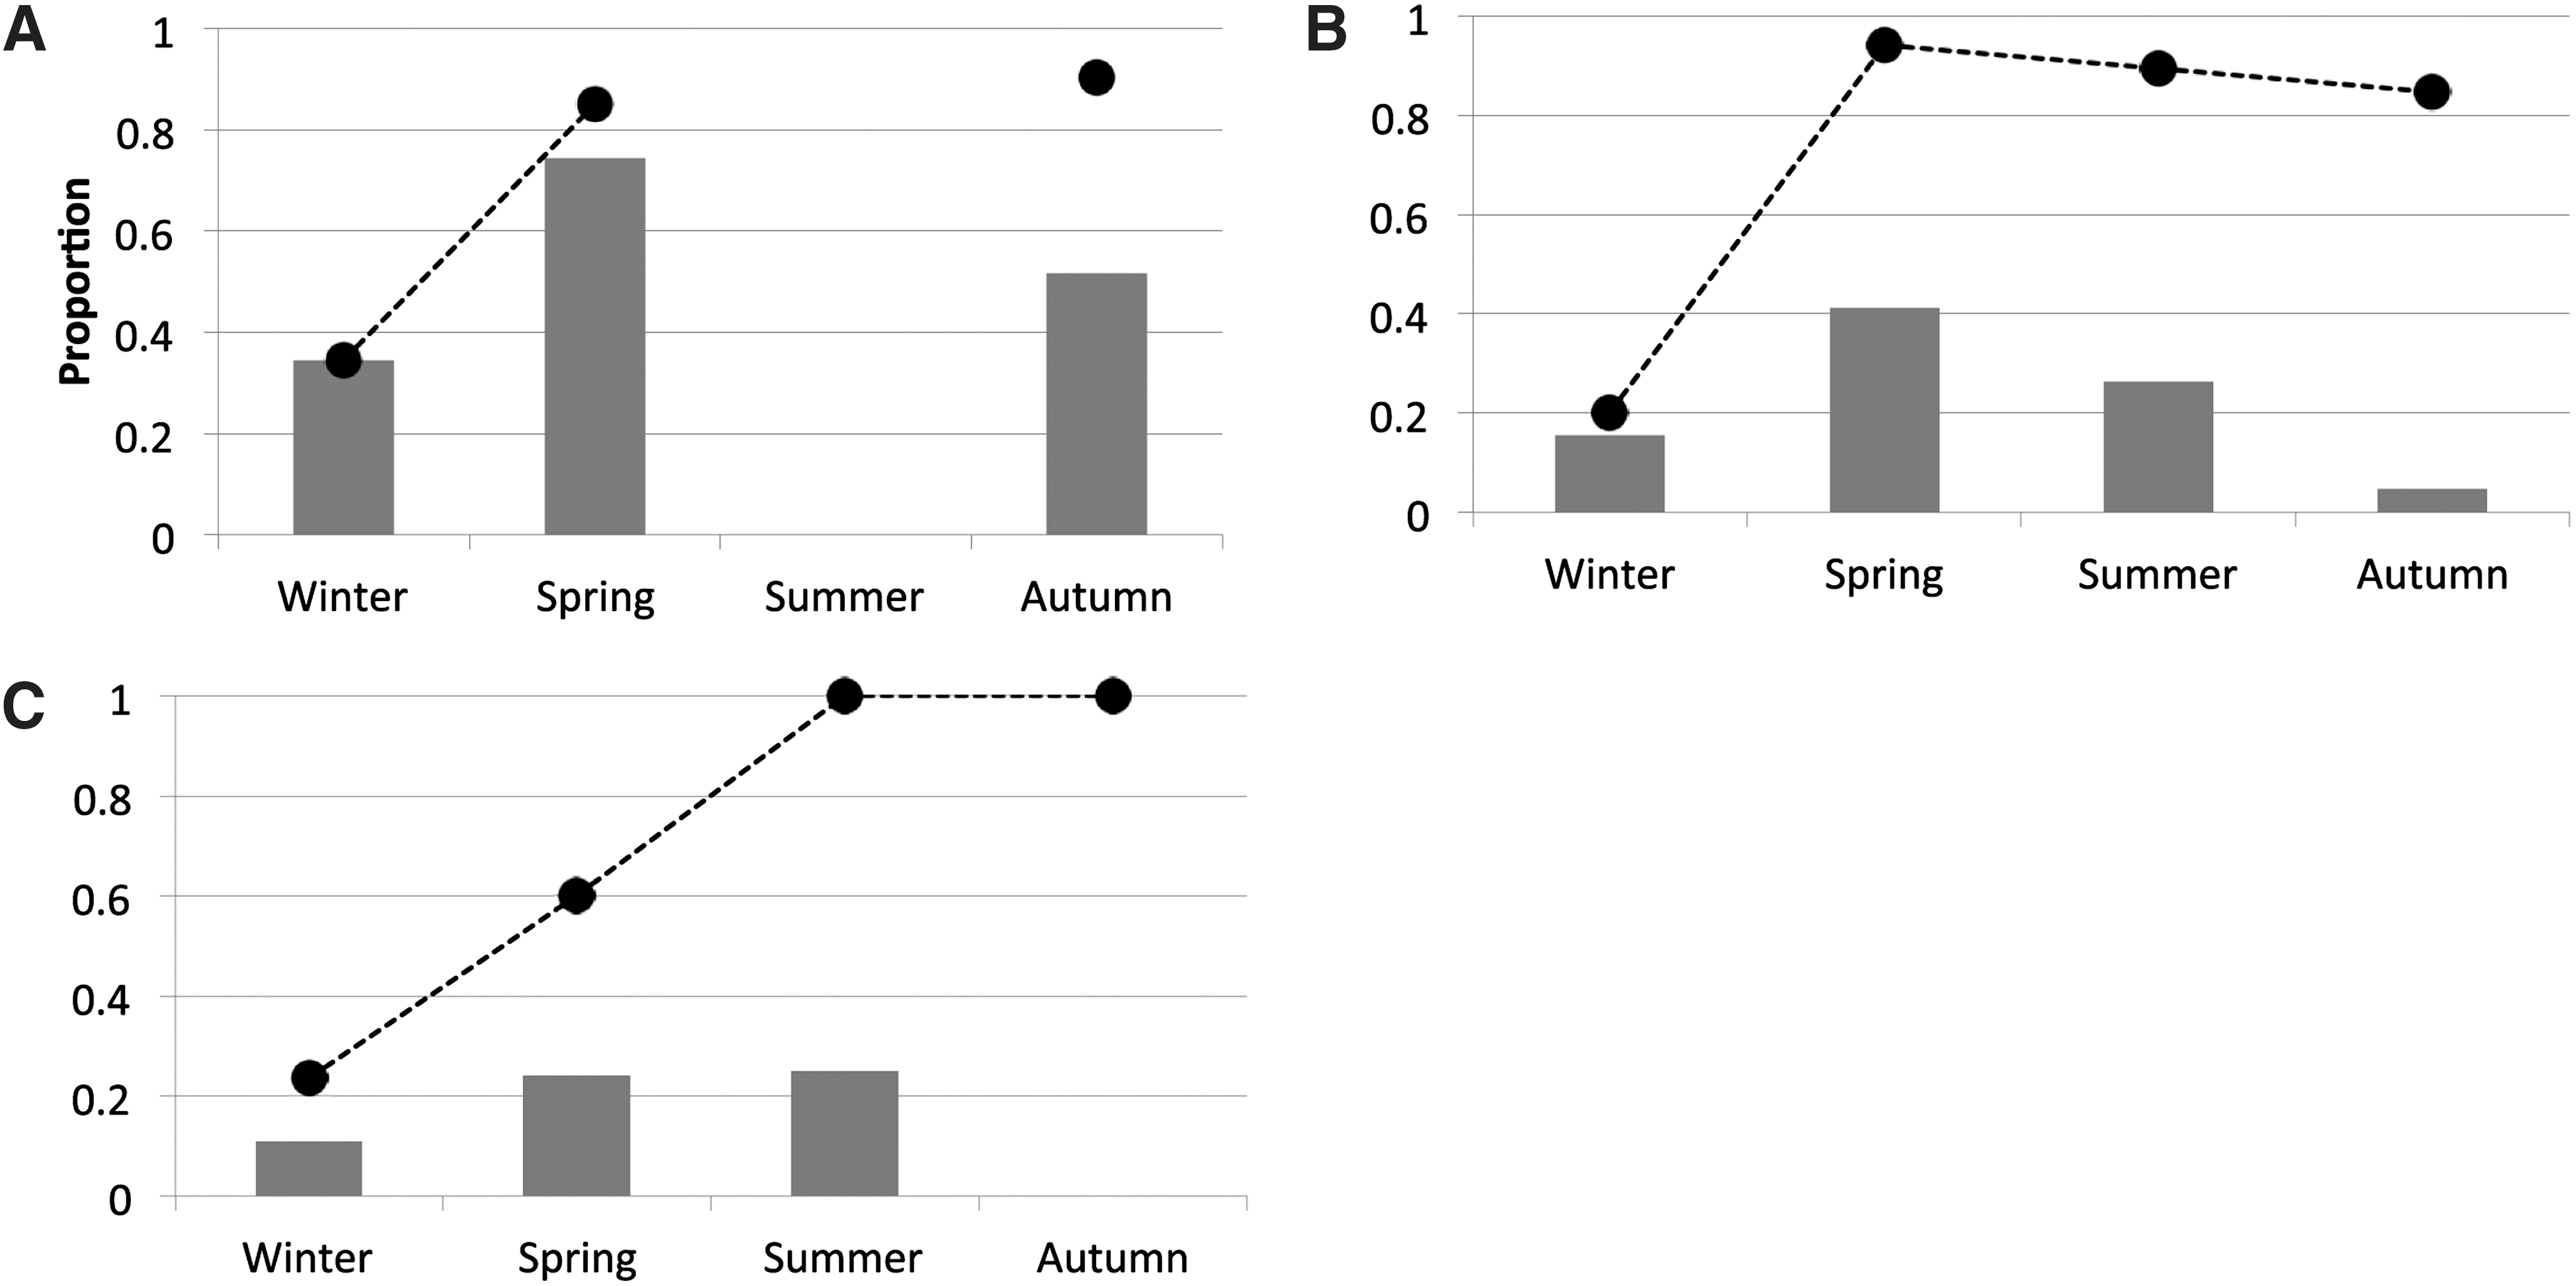
Seroprevalence and tick infestation over time. Shown is the seroprevalence in wild deer over time in three different locations. The dashed line indicates the proportion of tick-infested animals. (
At an individual level, animals infested with ticks were more likely to be seroreactive to B. burgdorferi (p<0.0001). However, when accounting for the effect of time and location, the presence of ticks on an animal was not associated with a positive serology (p=0.105, OR=1.47, 95% CI 0.92,2.33). A positive serology was found to be more frequent in males (p<0.001), with 32% of males being seropositive compared to 18% of females (OR=2.2, 95%CI 1.4,3.5, p=0.001), even when the effect of time was taken into account in the model. Roe deer were more likely to be seropositive compared to red deer (OR=2.95, 95% CI 1.4,3.2; p=0.004). Age was not found to be associated with positive serology.
Discussion
This study presents the first available data on the distribution of antibodies against B. burgdorferi s.l. in wild deer in the U.K. A relatively low proportion (23%) was found when compared to reports from other European countries. In Slovakia, seroprevalence rates of up to 45% were found in various studies (Travnicek et al. 2003; Bhide et al. 2004), a finding in agreement with the theory that Borrelia species are more predominant in the central areas of Europe (Smith and Takkinen 2006). Relatively lower deer seroprevalence rates, ranging from 28% to 39%, were also found in different parks in Ireland (Gray et al. 1996). Significant differences in seroprevalence were found in Denmark across the country, ranging from 27% to 47% (Skarphedinsson et al. 2005). Our results also showed great diversity in seroprevalence across the various locations studied. The proportion of animals presenting with I. ricinus ticks was also variable, probably reflecting a heterogeneous distribution of ticks across the country (Pietzsch et al. 2005). Consistently higher seroprevalence rates were found in the southern regions, which are the areas where the majority of reported human Lyme disease cases originate (Department for Environment Food and Rural Affairs, 2008).
There is still no agreement on the actual effect of deer density on the spread of Borrelia infection. Though their amplifying effect on transmission has been described in endemic countries (Hinrichsen et al. 2001), some authors suggest that as dead-end hosts for Borrelia, deer could reduce the burden of infection on vectors, and therefore reduce the transmission rate (LoGiudice et al. 2003; Ostfeld et al. 2006; Pugliese and Rosa 2008). It would be valuable to evaluate how our findings compare to the disease incidence in humans in each of the studied locations. Our results show that the degree of pathogen exposure in wild deer decreases towards the north of the country. In accord with this, the seroprevalence in the Kielder District was very low, and only very few animals presented with ticks at the time of culling. This confirms the findings of extensive field studies conducted in that location, where ticks positive for Borrelia were not found (Richard Birtles, personal communication). Nevertheless, in our study North West England produced a relatively large number of positive deer. This suggests that latitude may only explain part of the variability seen in the spatial distribution of Borrelia in the U.K. This was supported by Gilbert (Gilbert 2010), who highlighted that specific microclimates and landscape characteristics are factors that can support the presence of I. ricinus in unexpected latitudes. However, our findings in northwest England should be interpreted with caution, due to the limited number of samples obtained in that location. Further testing should be conducted to confirm whether North West England may be a northern focus for borreliosis.
The higher Borrelia seroprevalence rates found from March to May in the present study corresponds with the months of increased tick activity (Randolph et al. 2000; Pietzsch et al. 2005). Similar findings were reported in studies in the United States (Magnarelli et al. 1995), with seroprevalence rates decreasing over the winter until April. Nevertheless, a small number of samples was collected from June to August, and this limits our capacity to make an accurate interpretation of the seroprevalence trend over the summer months. We observed a direct relationship between tick infestation and deer seropositivity over the summer months, but the strength of that relationship decreased over the following months (i.e., the tick load was high, but fewer deer had positive serology). This is not surprising, given that spring and summer are known to be the seasons of highest transmissibility of infection by ticks (Department for Environment Food and Rural Affairs, 2008). It is also possible that antibodies in deer decay over time, and deer infected during the spring and summer may not show antibodies by autumn. There is limited information in the scientific literature on the duration of the immune response to Borrelia in deer. Luttrell and associates (Luttrell et al. 1994) detected antibodies by ELISA in four animals 2–3 weeks after experimental inoculation with B. burgdorferi. Antibodies were still present 10 weeks post-infection, although two animals started to show antibody decay by that time. These results would be compatible with increased pathogen transmission from ticks in the spring and summer months, with a subsequent decay of antibodies in infected deer. However, seroreversion (from positive to negative status in two consecutive tests) was studied by Magnarelli and colleagues in recapture studies, and they found that only a few animals (4/31) had their serological status reversed in a period of 10 months (Magnarelli et al. 1995). The seroprevalence trend observed over time in our study is compatible with a decay of antibodies gradually after exposure; if the antibody response in deer lasted longer, we would have observed constant seroprevalence levels throughout the year and across areas in our study.
Unsurprisingly, the majority of collected ticks were I. ricinus (Pietzsch et al. 2005; Jameson and Medlock 2011). It should be emphasized that our study did not aim to undertake a survey of tick infestation in deer. Our identification of ticks is likely to be biased towards the most prevalent tick species in the country (Pietzsch et al. 2005; Jameson and Medlock 2011), and we cannot exclude the presence of other tick species in the animals. A more complete survey would require systematic examination of animals and collection of all tick species present on the animal, but this was outside the scope of the present study.
Surprisingly, gender and species were found to be factors associated with positive serology, with males and roe deer showing highest seroprevalence rates. However, due to the structure of the culling program in the U.K., females were only culled in the winter months (from November to March), and as a result only samples from males were available for the months when highest seroprevalence would be expected. The structure of the sampling over time may have further biased our results, since in those months only roe deer were sampled. Gender was not found to be a risk factor in other studies from Europe and the U.S. (Travnicek et al. 2003; Skarphedinsson et al. 2005; Murdock et al. 2009).
This study aimed to provide the spatial distribution of wild deer seropositivity for B. burgdorferi s.l., which could serve as an indication of the presence of the pathogen in the areas where serological responses were detected. There is ongoing debate about the reliability of deer serology as an indicator of the presence of Borrelia, due in part to the fact that antibodies do not persist in these animals for life, and also due to doubtful sensitivity and specificity of the available diagnostic tests. Reported human cases, and in some cases active tick collection and testing, can be used as measures of the presence of the pathogen. The sensitivity and specificity of these methods is also questionable. Studies to evaluate the association between seropositivity in wild deer and infection status of ticks in the area could help elucidate the extent to which both estimates are in agreement, and would clarify the extent to which systematic testing of wild deer represents a viable means of monitoring the pathogen's spread.
In conclusion, evidence of antibodies against B. burgdorferi indicates that infection is prevalent in the deer population in England and Wales, with high variability seen across different regions. This study identified areas that are potential hot spots for human Lyme borreliosis, including southern England, where further studies should be carried out. Spatial analysis of these results could provide information on the factors that may determine the spread of the pathogen in the U.K.
Footnotes
Acknowledgments
This project was funded by an internal grant from the Royal Veterinary College. Sample collection was funded by the British Deer Society. The authors would like to thank the British Deer Society for their financial support for conducting the sampling, and the Deer Initiative for the coordination of the sampling. We thank also the Connecticut Agricultural Experiment Station for providing control sera, and the University of Veterinary Medicine (Kosice, Slovakia) for their initial support. We also thank Laurianne Tavernier and Daphne Boulicault who helped with the serological testing.
Author Disclosure Statement
No competing financial interests exist.