
Abstract
More than 500 small mammals were trapped at 3 localities in northern Ethiopia to investigate Bartonella infection prevalence and the genetic diversity of the Bartonella spp. We extracted total DNA from liver samples and performed PCR using the primers 1400F and 2300R targeting 852 bp of the Bartonella RNA polymerase beta subunit (rpoB) gene. We used a generalized linear mixed model to relate the probability of Bartonella infection to species, season, locality, habitat, sex, sexual condition, weight, and ectoparasite infestation. Overall, Bartonella infection prevalence among the small mammals was 34.0%. The probability of Bartonella infection varied significantly with species, sex, sexual condition, and some locality, but not with season, elevation, habitat type, animal weight, and ectoparasite infestation. In total, we found 18 unique Bartonella genotypes clustered into 5 clades, 1 clade exclusively Ethiopian, 2 clades clustered with genotypes from central and eastern Africa, and the remaining 2 clades clustered with genotypes and species from Africa and Asia. The close relatedness of several of our Bartonella genotypes obtained from the 3 dominant rodent species in Tigray with the pathogenic Bartonella elizabethae from Rattus spp. in Asia indicates a potential public health threat.
Introduction
Bartonella spp. are Gram-negative bacteria belonging to the α2-subclass of Proteobacteria (Houpikian and Raoult 2001). They are facultative intracellular parasites of mammalian endothelial and red blood cells (Just et al. 2008, Kosoy 2010). To date, at least 20 species and subspecies are recognized worldwide, of which about 10 are reported as pathogenic to humans (Boulouis et al. 2005, Just et al. 2008). Although their mode of infection and associated risk factors are poorly known (Boulouis et al. 2005, Morway et al. 2008), infections caused by Bartonella have been associated with human diseases such as cat scratch disease, trench fever, endocarditis, and neuroretinitis. Transmission of Bartonella infections between hosts is believed to be mediated by a range of ectoparasites, including fleas, ticks, lice, and sandflies (Reeves et al. 2007, Reis et al. 2011). The sandfly Lutzomyia verrucarum, the body louse Pediculus humanus humanus, the fleas Ctenocephalides felis and Ctenophthalmus nobilis nobilis (Billeter et al. 2008), and quite recently the tick Ixodes ricinus (Reis et al. 2011) have been confirmed as arthropod vectors. Furthermore, several other fleas, sand flies, lice, and ticks are suspected vectors.
Given the large diversity of rodent species in Africa (Musser and Carleton 2005), there are relatively few reports on the detection, characterization, and prevalence of Bartonella species among African rodents. The first report on Bartonella presence and dynamics in African rodent species came from a population of the fat sand rat Psammomys obesus in Tunisia (Fichet-Calvet et al. 2000). Later Bartonella infections were reported among murine rodents in South African: Aethomys namaquensis, Mastomys natalensis, Rhabdomys pumilio, and Tatera leucogaster (Pretorius et al. 2004), and other rodent species, including Arvicanthis neumanni, Lophuromys rita, Mus minutoides, and Rattus rattus from Democratic Republic of Congo (DRC) and Tanzania (Gundi et al. 2012). From these studies we may infer that: (1) A very diverse group of rodent species in the continent is infected with the bacteria (and many more species wait investigation), (2) the Bartonella infecting the rodents are very diverse, with a high discovery rate for potentially novel species or genotypes, and (3) some of the Bartonella genotypes detected from the African rodents are genetically closely associated with species already known to be pathogenic to humans.
The objectives of this study were to: (1) Investigate Bartonella infection prevalence among small mammals trapped from domestic and peridomestic habitats and “scrublands” in Tigray, northern Ethiopia and (2) identify the genetic diversity of Bartonella species parasitizing these small mammals and estimate the phylogenic relationship of the Ethiopian Bartonella with previously described species or genotypes in Africa and elsewhere in the world.
Materials And Methods
Trapping localities and sampling
We trapped small mammals from three localities, Golgolnaele (N13°52, E39°43, 2700 meters above sea level [a.s.l.]), Mahbere Silassie (N13°39, E39°08, 2600 meters a.s.l.), and Aroresha (N12°25, E39°33, 1600 meters a.s.l.), in Tigray, northern Ethiopia (Fig. 1). The first two localities are from the Ethiopian highlands and the third locality from a lowland area. Trapping was conducted during the dry (March and May, 2010), wet (July and August, 2010), and early dry (November and December, 2010) seasons to represent the 3 main seasons as far as rodent population dynamics in Tigray are concerned (Y. Meheretu et al., unpublished data). Trapping was carried out in a total of 30 randomly selected household compounds (homesteads), 10 from each locality. We set 8 traps per household compound, 4 inside houses (near beds, food, clothing cabinets, holes, and hide or jute sacks) and 4 outside the houses (near walls and fences within the compound). Additional trapping was made in “scrublands” (a mixture of fallow field and bushy vegetation) for the whole study period in Golgolnaele, once (March, 2010) in Mahbere Silassie, but never in Aroresha. In the “scrublands,” we set a 60-×60-meter permanent square grid consisting of 7 parallel lines, 10 meters apart, with trapping stations also 10 meters apart (i.e., a total of 49 trapping stations per grid). Trapping was conducted for 2 consecutive days using Sherman LFA live traps (7.5×9.0×23.0 cm, HB Sherman Trap, Tallahassee, FL) baited with peanut butter mixed with wheat flour.
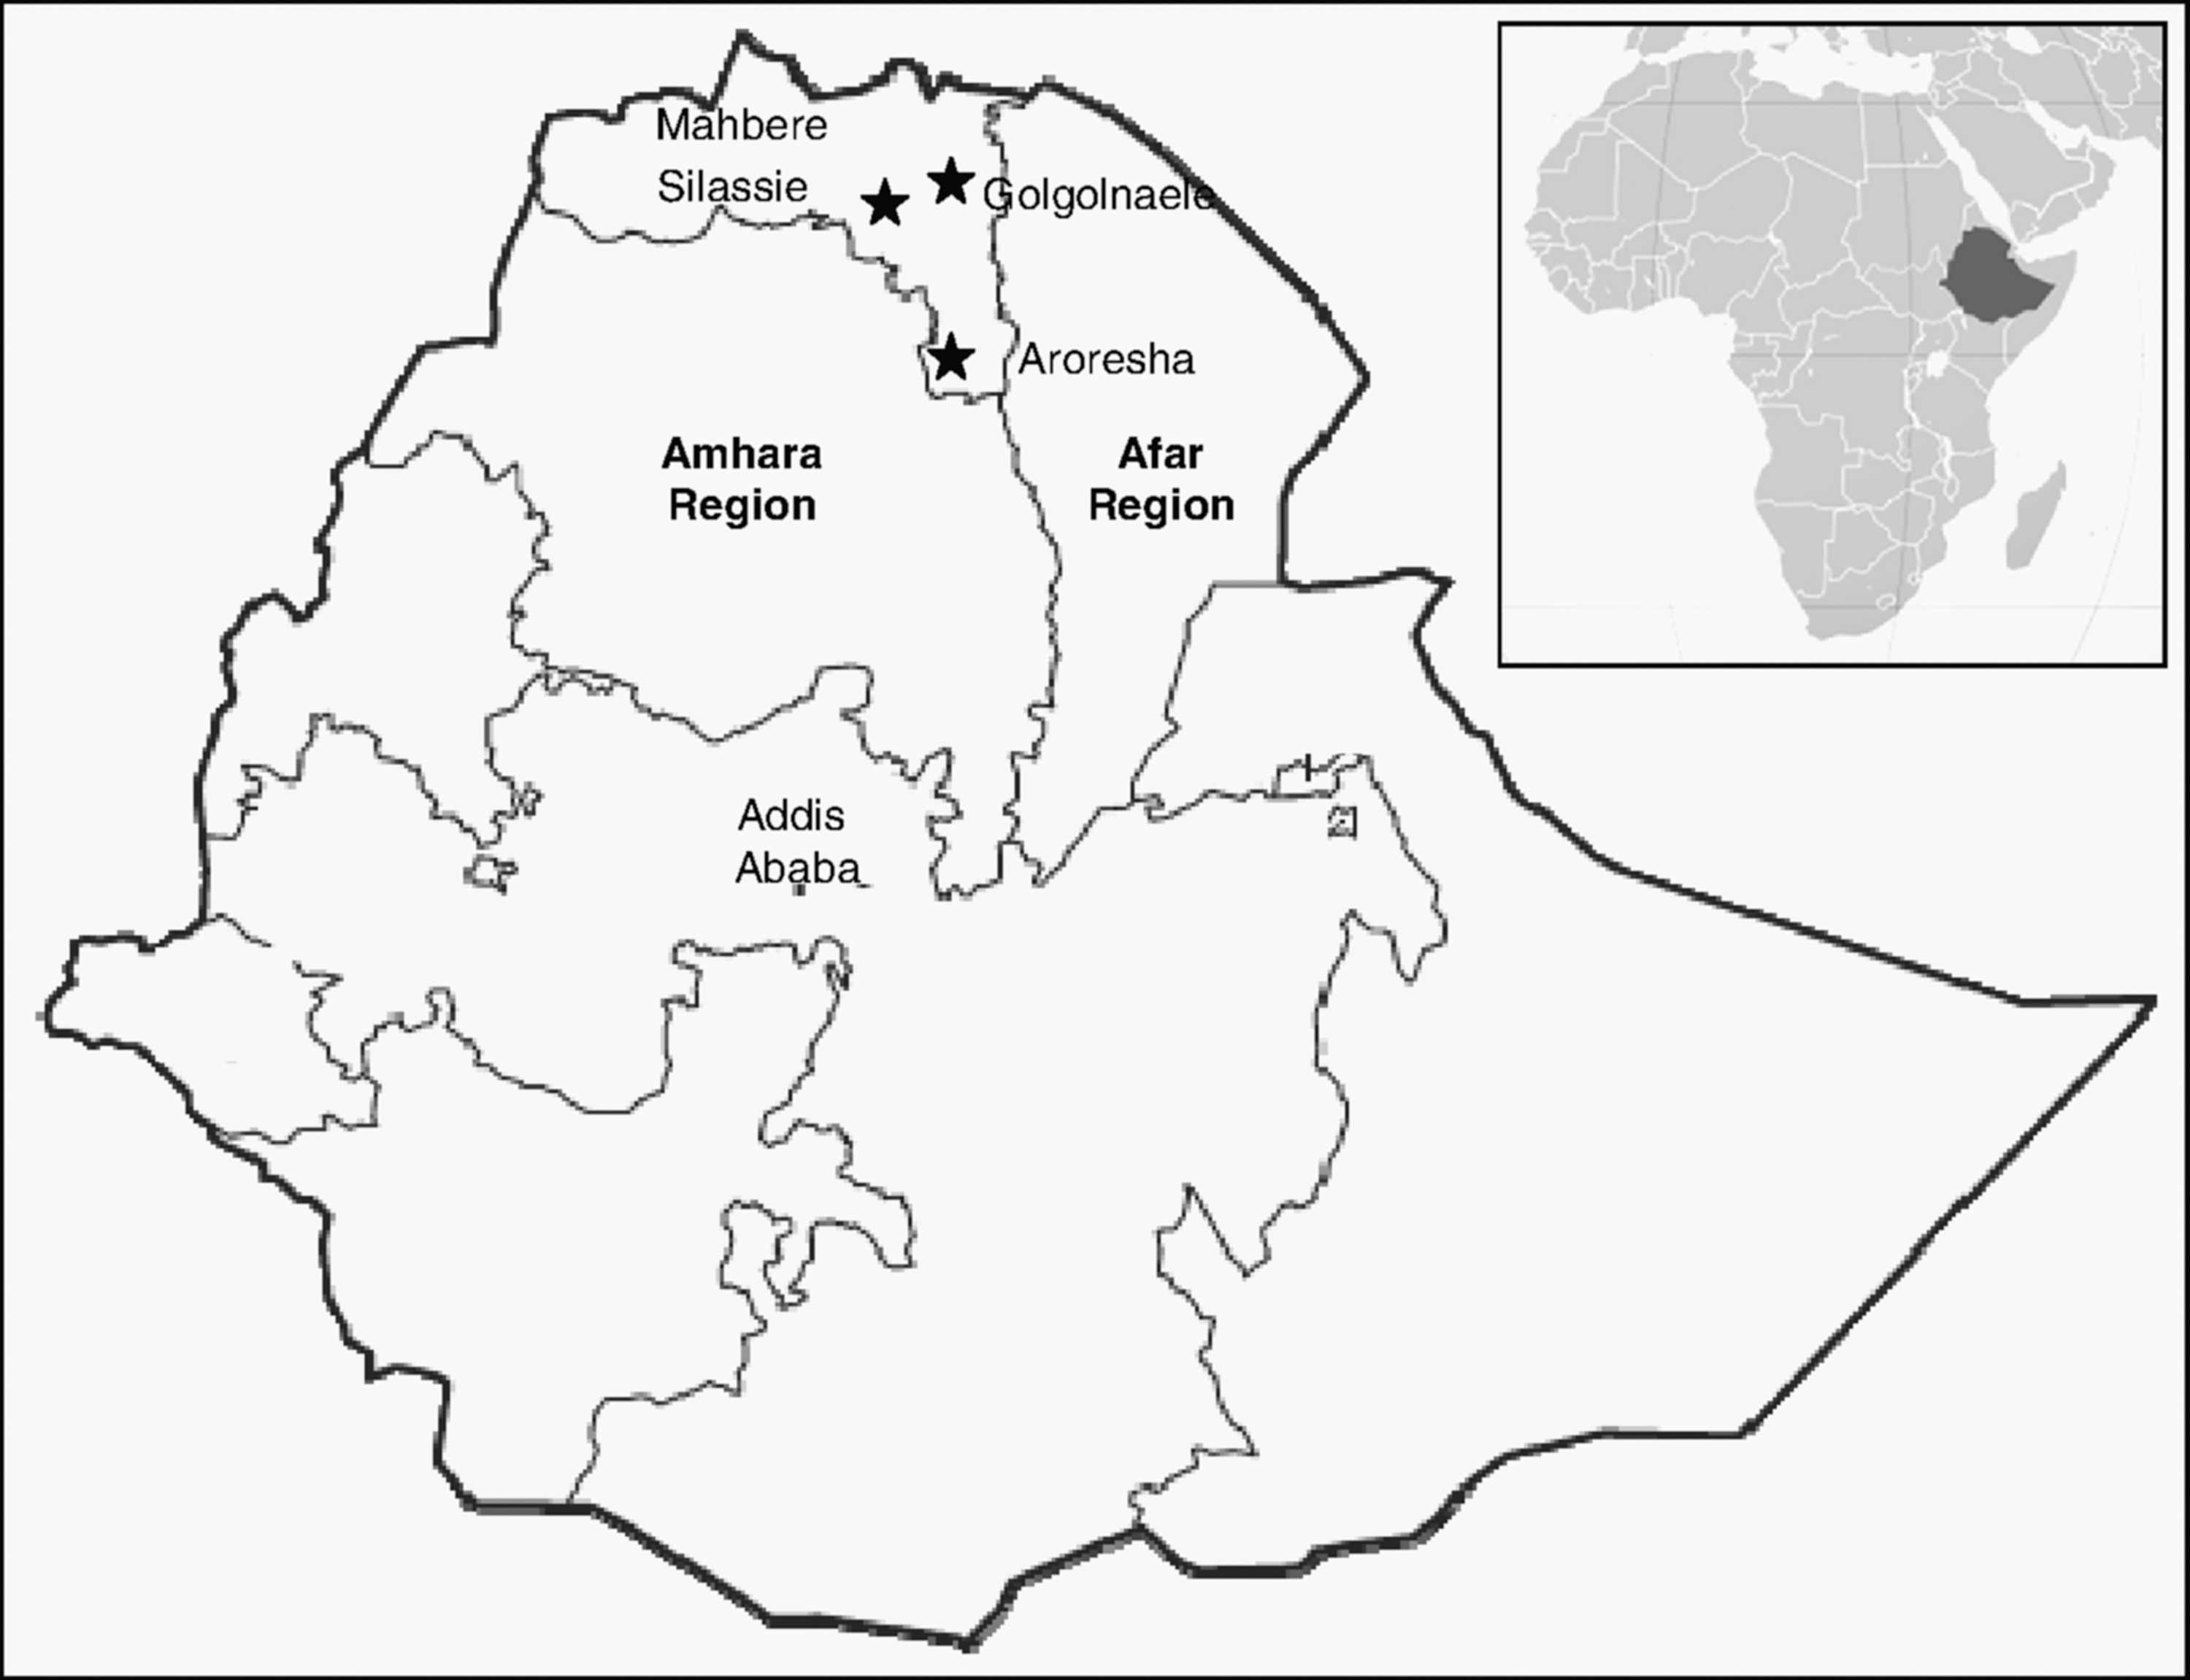
Map of Ethiopia showing the 3 study localities—Mahbere Silassie, Golgolnaele, and Aroresha—in Tigray Region (top).
Captured animals were handled following the ethical policies and guidelines approved by the committee for Animal Care and Use (Mekelle University, Ethiopia). All captured animals were sacrificed using an appropriate dose of ether. External morphological measurements (body weight, head-body, tail, hind foot, and ear lengths) were recorded for further taxonomic identification. Sexual condition was determined as follows: (male, testes abdominal [reproductively inactive], testes scrotal [reproductively active]; female, vagina plugged [reproductively inactive], vagina perforated, vagina perforated and pregnant, and vagina perforated and lactating [reproductively active]). Ectoparasites were removed while combing the fur and preserved in 70% ethanol. Tissue samples were taken from liver and kidney and preserved in 70% ethanol and/or in RNAlater (an RNA stabilization reagent).
The small mammals were initially identified in the field to genus level and later confirmed to species level at the Laboratory of the Evolutionary Ecology Group, University of Antwerp (Belgium), by combining craniometric measurements and mitochondrial DNA cytochrome b sequencing of a subset of the samples using L7 (5′-ACCAATGACATGAAAAATCATCGTT-3′) and H6 primers (5′-TCTCCATTTCTGGTTTACAAGAC-3′) (Montgelard et al. 2002). The genotyping revealed that the species tagged “Mastomys awashensis” during the initial field identification was in fact composed of two morphologically cryptic species, M. awashensis and Stenocephalemys albipes. Thus, we genotyped all individuals initially tagged as “M. awashensis.” Some representative sequences of each small mammal species are available in GenBank (AN: JQ956464-JQ956479).
Detection of Bartonella in host samples
Total DNA was extracted from liver samples using buffers ATL, AL, AW1, AW2, AE, and proteinase K (QIAGEN) with silica columns (Zymo Research) following the QIAamp DNA Mini Kit instructions. DNA was eluted in 60 μL of buffer AE. PCR was performed using the primers 1400F (5′-CGCATTGGCTTACTTCGTATG-3′) and 2300R (5′-GTAGACTGATTAGAACGCTG-3′) (Renesto et al. 2001) targeting 852 bp (positions 1456–2307 without primers) of the Bartonella RNA polymerase β-subunit (rpoB) gene, which has been shown to be useful for discriminating different Bartonella species (La Scola et al. 2003). Amplifications were performed in a 25-μL reaction volume containing 0.2 μM of each primer, 1× DreamTaq Buffer (containing 2 mM MgCl2), 0.8 mM MgCl2, 0.2 mM of each dNTP, and 1 U DreamTaq DNA Polymerase (Fermentas). The thermal profile started with an initial denaturation at 94°C for 3 min, followed by 40 cycles of denaturation at 94°C for 30 s, annealing at 53°C for 30 s, and extension at 72°C for 1 min, and a final extension at 72°C for 10 min. PCR products were visualized on 1.4% agarose gels. A sample was considered as positive for the prevalence study when a band of ∼900 bp was visible. For the phylogeny study, 77 of the positive PCR products were purified and sequenced by VIB Genetic Service Facility (University of Antwerp, Belgium) using the same primers as for the PCR.
Ecological analysis
We calculated Bartonella infection prevalence (proportion of Bartonella-positive individuals) and the 95% confidence intervals (95% CI) for each small mammal species in Quantitative Parasitology 3.0 using the Sterne exact method (Rozsa et al. 2000, Reiczigel 2003).
To analyze the correlates of host and environmental factors with the probability that an individual host was infected with Bartonella, we used a generalized linear model (GLM) with binomial family and a logit link to construct a multiple logistic model in R (R Development Core Team 2010). The GLM was fitted to relate the logit of Bartonella occurrence to host species (6 levels: Arvicanthis dembeensis, Crocidura olivieri, M. awashensis, Mus spp., R. rattus, and S. albipes), season (3 levels, wet, early dry, and dry), locality (3 levels, Golgolnaele, Mahbere Silassie, and Aroresha), habitat (2 levels, domestic versus peridomestic), sex (2 levels, male versus female), sexual condition (2 levels, reproductively active versus inactive), flea infection (2 levels, infected versus not infected), mite infection (2 levels, infected versus not infected), tick infection (2 levels, infected versus not infected), weight (continuous), and biologically relevant interactions. Note that data for “scrublands” were not included in the GLM analysis. Model selection was based on the Akaike Information Criterion (AIC) and likelihood-ratio tests (LRT), and we used a top-down protocol as described in Zuur et al. (2009). Statistical significance was declared at p values of less than 0.05.
In summary, the generalized linear starting model included the following sets of variables: Bartonella infection, host species, season, interaction between season and locality, habitat nested within locality, sex, sexual condition, flea infestation, mite infestation, tick infestation, and weight. First, we tested if the probability of Bartonella infection varied with habitat type by nesting habitat within locality. It turned out that the test was not significant (χ2=5.0, degrees of freedom [df ]=3, p=0.1708), hence habitat type was dropped from the analysis. Second, we looked at the interaction between locality and season and found out that the interaction was not significant (χ2=5.9, df=4, p=0.2086), hence it was dropped from the analysis. Third, we tested for among locality variations (to see if the three localities can be grouped in a 2-level factor [highland and lowland] or treated separately), and the test was significant (χ2=12.4, df=1, p=0.0004), indicating that the data fit best when the 3 localities are treated separately than when grouped into highland and lowland. Then, we began to drop each variable from the full model separately to reveal their importance in the analysis. Hence, our final model included species (χ2=141.5, df=6, p<0.0001), locality (χ2=17.6, df=2, p=0.0001), sex (χ2=8.7, df=1, p=0.0031), and sexual condition (χ2=7.8, df=1, p=0.0052).
Genetic analyses
Sequences were checked and aligned using Geneious Pro 5.5.3 (Drummond et al. 2010). During the checking process, clear double peaks (distinct from the baseline noise) were visible on the sequencing chromatograms of half of the samples. These were likely the result of mixed infections. The uncertainty thus introduced could be encoded by replacing double-peak positions by undetermined nucleotides (e.g., R for A or G, Y for T or C, etc.). However, because several mixed sequences seemed to result from co-infections with very different Bartonella genotypes, this encoding could produce substantial noise during phylogenetic reconstruction. Therefore, the only mixed infection sequences entered in the phylogeny were those where there was clearly one set of dominant peaks, and these were entered without uncertainty. Sequences were compared to other Bartonellae using the Basic Local Alignment Search Tool (BLAST) algorithm (Altschul et al. 1990) on the National Center for Biotechnology Information (NCBI) website. The new sequences have been deposited in GenBank (accession numbers JQ425623–JQ425636 and JQ425638–JQ425644).
Sequences were aligned with a representative subset of rpoB sequences of Bartonella isolated from rodents together with reference species, all available in Genbank. Brucella melitensis 16MT was used as an outgroup. The final alignments included 825 sites. Estimates of evolutionary divergence between sequences were computed using the p-distance method in MEGA 5.05 (Tamura et al. 2011). We estimated the phylogenetic relationship between our sequences and other Bartonellae sequences in two ways. First, for comparison with existing literature, we used neighbor-joining with the Kimura 2-parameter (K2P) model of nucleotide substitution in MEGA 5.05 (Tamura et al. 2011), as used in several recent studies of small mammal Bartonella (Inoue et al. 2008; Welc-Faleciak et al. 2008; Inoue et al. 2009; Gil et al. 2010; Gundi et al. 2010). Second, we used jModelTest 0.1.1 (Guindon and Gascuel 2003; Posada 2008) to evaluate the fit of 24 nested models of nucleotide substitution to the data using the AIC. The AIC indicated that the sequence evolution model best describing the data is HKY85 with a proportion of invariables sites and rate variation among sites with 4 rate categories (HKY85+I+G). This model of sequence evolution was then used for a maximum likelihood (ML) estimation of the phylogeny in PhyML 3.0 (Guindon et al. 2010). Branch supports were evaluated by both nonparametric bootstrap analysis (1000 replicates and 200 replicates for neighbor joining [NJ] and ML analyses, respectively) and approximate likelihood-ratio tests (aLRT) relying on a nonparametric Shimodaira–Hasegawa (SH)-like procedure (ML analysis only; Guindon et al. 2010). Where appropriate, tree branches are annotated with both support estimates. We compared the goodness of fit of the NJ and ML tree topologies using the SH test (Shimodaira and Hasegawa 1999) implemented in TREE-PUZZLE 5.2 (Schmidt et al. 2002) using both the K2P and HKY85+I+G models of sequence evolution.
Result
Small mammal community
In total, 529 small mammals belonging to at least 6 different species were trapped from the 3 localities and tested for Bartonella infection. An overview of the number of samples tested for Bartonella infection and the subsequent result are summarized in Table 1. In Golgolnaele and Mahbere Silassie, 2 species, A. dembeensis and S. albipes, comprised 81.9% and 67.7% of the tested small mammals, respectively. In Aroresha, R. rattus and M. awashensis comprised 66.7% of the tested small mammals. Note that, while the proportion of tested R. rattus in Golgolnaele and Mahbere Silassie was 2.3% and 4.5%, respectively, the proportion in Aroresha was 46.5%.
Columns for each season indicate the number of individuals tested, those positive for Bartonella infection and the prevalence (%). (Wet season is represented by July and August, Early Dry season by November and December, and Dry season by March and May).
Host species and Bartonella infection
We found 34.0% prevalence of Bartonella infection in the small mammals overall (CI 30.1– 38.2%). This prevalence estimate is conservative because we did not use an internal control to prove the efficiency of DNA extraction and/or possible PCR inhibitors. The highest Bartonella prevalence was observed in S. albipes (64.6%) (CI 55.3–73.0%), followed by A. dembeensis (37.9%) (CI 31.7–44.6%), M. awashensis (37.5%) (CI 24.8–52.0%), Mus spp. (5.6%) (CI 1.0–19.0%]), Crocidura olivieri (2.4%) (CI 0.13–12.7%), and R. rattus (1.5%) (CI 0.08–8.1%) (Table 1). The GLM analysis showed significant differences in the probability of Bartonella infection among the small mammal species, with higher frequency of infection in S. albipes and lower frequency of infection in R. rattus and C. olivieri (Table 2). Except for 1 R. rattus trapped from a domestic area in Golgolnaele and 1 C. olivieri trapped from a peridomestic area in Mahbere Silassie, the remaining individuals of these two species (n=66 and n=42, respectively) tested negatively for Bartonella infection.
Spatial variation of Bartonella infection
Bartonella-positive hosts were found from each of the three localities (Table 1). The highest prevalence was observed in Mahbere Silassie (45.8%, CI 38.1–53.9%), followed by Golgolnaele (37.3%, CI 31.5–43.5%) and Aroresha (10.5%, CI 6.0–17.5%). In the first two localities, Bartonella prevalence was predominantly observed in S. albipes (72.2% and 61.0%, respectively). In Aroresha, Bartonella prevalence was predominantly detected in A. dembeensis (31.3%). Despite its abundance in Aroresha, all R. rattus individuals (n=53) tested from this locality were negative for Bartonella infection.
The results of the GLM analysis indicated that the chance of small mammals being infected with Bartonella was significantly higher in Mahbere Silassie than in Aroresha (p=0.0006), but not significantly different in Golgolnaele compared with Aroresha (p=0.16). However, within localities the chance of being infected with Bartonella was not significantly different between peridomestic and domestic habitats (p=0.1708). We note that data for the “scrublands” were not included in the GLM analysis since this habitat type was not investigated in Aroresha. However, Bartonella-positive rodents were found in this habitat in both Mahbere Silassie and Golgolnaele localities.
Seasonality of Bartonella infection
Overall, Bartonella prevalence within a locality appears stable across seasons (Table 1). We detected a trend in the probability of Bartonella infection in the small mammals during the early dry season compared to the dry season (p=0.06). However, the probability of infection was not significantly different between wet and dry seasons (p=0.2.5). It is worth mentioning here that we detected Bartonella infection in each of the months distributed across the 3 seasons.
Host characteristics and Bartonella infection
The male-to-female sex ratio of the tested small mammals was 50.9% (males 269, females 260). Bartonella prevalence was 28.6% (CI 23.4–34.4%) in the males and 39.6% (CI 33.8–45.8]) in the females. The GLM analysis confirmed that the likelihood of being infected with Bartonella is significantly less in the captured males compared to the females (p=0.004).
The ratio of reproductively active small mammals to reproductively inactive ones was 52.6%. Bartonella prevalence in the reproductively active individuals was 40.6% (CI 34.9–46.6%]) and in reproductively inactive ones the prevalence was 26.7% (CI 21.5–32.6]). The likelihood of being infected with Bartonella was significantly higher in reproductively active individuals compared to reproductively inactive ones (p=0.008).
Ectoparasite infestation and Bartonella infection
In total, 1882 fleas, 1484 mites, and 219 ticks were recovered from the small mammals tested for Bartonella. The mean number of fleas per host (infested plus noninfested) was 3.6 (standard error [SE]=0.23; range, 0–48), mites 2.8 (SE=0.29; range, 0–57), and ticks 0.4 (SE=0.08; range, 0–23). Overall prevalence of flea infestation among the small mammals was 66.9% (CI 62.8–70.8%), mites 32.7% (CI 28.8–36.9%]), and ticks 15.1% (CI 12.3–18.4%). However, infestation with any of the ectoparasites did not significantly correlate with the probability of Bartonella infection in the small mammals.
Genetic characterization of Bartonella
Eighteen unique partial rpoB genotypes (designated as A–T, Table 3) of 852 bp were obtained from 66 sequenced PCR products. Eleven PCR products produced complex sequence chromatograms, likely due to mixed infections, which were not further interpreted. To relate the Ethiopian Bartonella genotypes to those known to be pathogenic to humans or found in small mammals in other parts of the world, we included 115 Bartonella sequences from GenBank in the phylogenetic analyses. The SH test showed that the ML tree topology was significantly better than the topology constructed by NJ, irrespective of which model of sequence evolution is assumed in the comparison (K2P and HKY85+I+G: Δ log L=93.82, p=0.02, and Δ log L=79.55, p=0.004, respectively). We present the ML phylogeny estimate in Figure 2, and the NJ tree as supplementary information in Appendix 1 (Supplementary Data are available at
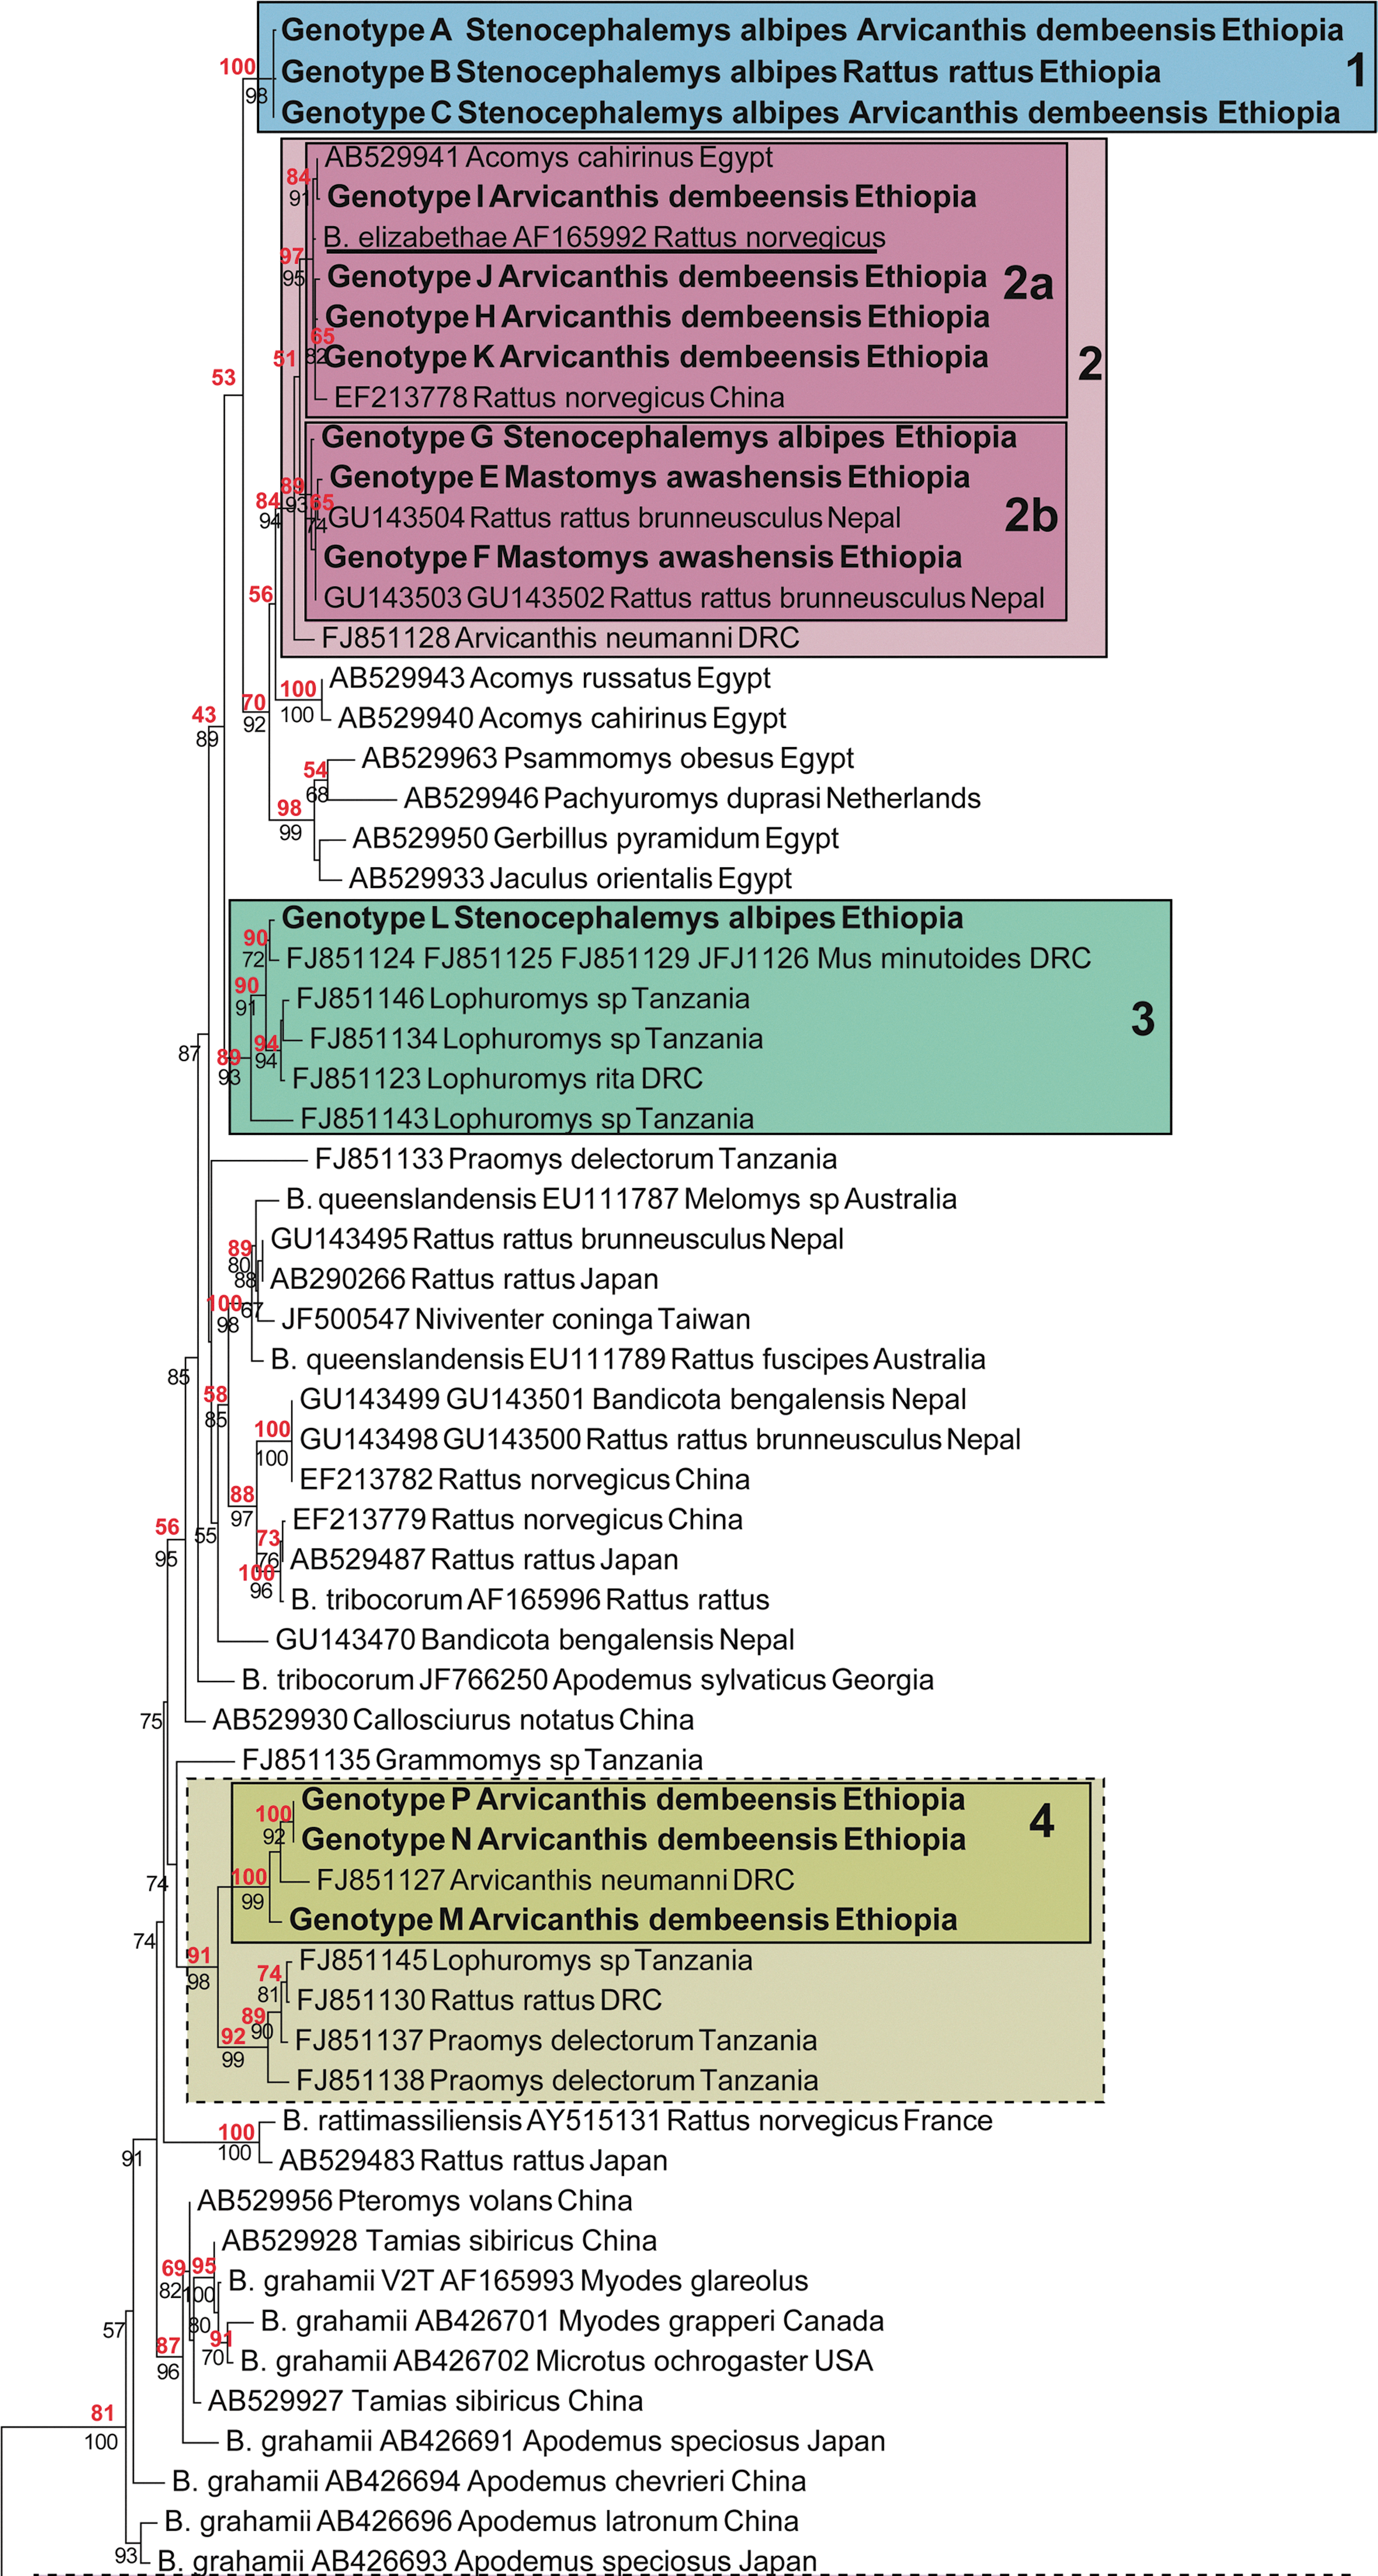
Phylogenetic tree of Bartonella based on the rpoB gene showing the position of the genotypes found in Ethiopian rodents compared to other rodent's strains or to reference Bartonella. The tree is an maximum likelihood (ML) estimate given the HKY85 substitution model and an estimated proportion 0.541 of invariant sites with 4 gamma-distributed rate categories to account for rate heterogeneity across sites. Support for internal branches was assessed both by approximate likelihood-ratio text (aLRT) tests (minimum of Shimodaira–Hasegawa [SH]-like and chi-squared–based parametric, black below branches) and bootstrap (200 replicates, red above branches). Brucella melitensis was used as an outgroup. Underlined sequences represent Bartonella known to be pathogenic for humans (Chomel and Kasten 2010). Each sequence taken from GenBank is labeled with its accession number, the name of the rodent host species and the country of origin where available. For the reference sequences, the information about the host is taken from (Chomel and Kasten 2010). Scale bar, number of substitutions per site. (Color images available online at

SA, S. albipes; MA, M. awashensis; AD, A. dembeensis; RR, R. rattus. Note that letters “D” and “O” are not used to represent genotypes.
Clade 1 contained Bartonella genotypes exclusively from our samples, grouping together genotypes obtained from S. albipes, A. dembeensis, and R. rattus from Golgolnaele and Mahbere Silassie. Two of these genotypes (A and B) were the most frequent in our dataset (Table 3). The sequence similarities of these genotypes and other Bartonella were relatively low (mean=90.6%±0.64% [range, 75.6–95.9%.).
Clade 2 is divided in 2 subclades: Subclade 2a grouped together genotypes I, J, H, and K obtained from A. dembeensis from each of our sampling localities with a sequence found in Cairo spiny mouse Acomys cahirinus from Egypt, a sequence from the cosmopolitan brown rat (Rattus norvegicus) from China, and the reference sequence of Bartonella elizabethae from R. norvegicus. Subclade 2b grouped together genotype G from S. albipes from Golgolnaele locality and genotypes E and F obtained from M. awashensis from Aroresha locality with two sequences of Bartonella found in black rats R. rattus in Nepal. The outgroup of clades 2a and 2b was a sequence from A. neumanni from the DRC. The sequence similarities of genotypes I, J, H, K and G, E, F to B. elizabethae (human pathogen) were very high, 99.5–99.8% and 98.2–98.4%, respectively.
Clade 3 was comprised of purely African genotypes. Genotype L obtained from S. albipes from Golgolnaele grouped with Bartonella sequences from Lophuromus spp. from Tanzania and DRC, and with a sequence from Mus minutoides from the DRC. Genotype L has 99.3% sequence similarity with the genotype from M. minutoides and the within-clade mean similarity was 97.8%. Sequence similarity between the sequences of clade 3 and other Bartonella was 90.25%.
Clade 4 also was comprised of purely African genotypes, genotypes M, N, and P obtained from A. dembeensis from Golgolnaele and Mahbere Silassie grouped with Bartonella from A. neumanni from DRC. Sequence similarity between the Ethiopian genotypes and the DRC genotype was on average 97.7%. Placing this clade in a wider context, its sister clade was also purely African, grouping Bartonella from Praomys delectorum and Lophuromys spp. from Tanzania together with a sequence obtained from R. rattus from DRC. Sequence similarity between the two clades was on average 94.2%.
Clade 5 grouped genotypes Q, R, S, and T with sequences from Tanzania and Egypt, and with B. birtlesii from Apodemus spp. in Japan. It is again more informative to consider the wider context—Clade 5 together with its sister clade formed an African or, perhaps Afro-Caucasian clade with the exception of the B. birtlesii. (The Netherlands origin of fat-tailed gerbils, Pachyuromys duprasi, in Fig. 2 refers to the location of the animals before being imported to Japan [see Inoue et al. 2009]; this gerbil species has a Northern Sahara distribution range.) The Caucasian aspect of the clade was a sequence obtained from the Libyan jird Meriones libycus from Georgia, the range of which spans North Africa, Arabia, and the Caucasus. The sequence similarities of genotypes Q, R, S, T, and the other Bartonella were relatively low (mean=87.94±0.8%, ranging from 74.0% to 93.7%).
Discussion
Bartonella prevalence
This study is the first to report presence of Bartonella in Ethiopian small mammals. We report that the overall prevalence of Bartonella infection in the small mammals was 34.0%. Bartonella infection was found in domestic and peridomestic areas in the 3 localities of different elevation and in “scrublands” in 2 of the high-elevation localities. We detected highly diverse Bartonella genotypes, some of which were novel and others closely related to a pathogenic species.
Among the small mammals, Bartonella infection was low in R. rattus, Mus spp., and C. olivieri. Such low Bartonella prevalence has also been reported in R. rattus (1/25) and C. olivieri (0/8) in DRC (Gundi et al. 2012), whereas in South Africa Bartonella was undetected in R. rattus (but the sample size was only n=2) (Pretorius et al. 2004). In contrast to these data from Africa, in Asia as high as 43% and 64% Bartonella prevalence was reported in Rattus spp. and the house shrew Suncus murinus, respectively (Gundi et al. 2010). The lower level of Bartonella infection in Rattus spp. appears to be a common pattern in Africa and may be an instance of host escape during colonization (Torchin et al. 2003).
Several of our genotypes in clade 2 were closely related to B. elizabethae, a worldwide known rodent associated zoonotic Bartonella species, infection of which has been associated with endocarditis and neuroretinitis in humans (Daly et al. 1993, O'Halloran et al. 1998). Finding such closely related Bartonella sequence raises a potential public health significance of the bacteria, emphasizing the need for large-scale ecological and epidemiological studies in Ethiopia. To strengthen our assertion, we would like to draw attention in to three important points here: (1) A substantial proportion (38.9%) of our Bartonella genotypes appear closely related to the pathogenic B. elizabethae, (2) our Bartonella genotypes associated with B. elizabethae were obtained from the 3 dominant rodent species (M. awashensis, S. albipes, and A. dembeensis) in agricultural fields (where farming activities such as weeding and harvest are still performed manually) and in rural inhabitations (where the housing conditions and activities around houses favor contact between humans and rodents), and (3) these Bartonella genotypes were detected in rodents trapped from each of the 3 study localities (at 1600-, 2600-, and 2700-meter elevations). The strong association of B. elizabethae with Rattus spp. in Asia, but with native rodents in Africa (in our result and Gundi et al. 2012), suggests that B. elizabethae is not specific to Rattus spp. in Africa, adding to the public health significance of the native rodents in Africa.
Seasonality of Bartonella infection
We have detected Bartonella infection in the small mammals in the study localities in each of the months distributed across the 3 seasons. However, we did not find significant seasonal difference in Bartonella infection in the small mammals. We suspected an increase in Bartonella infection during the early dry season in response to the dynamics of the host populations, rodent reproduction and abundances in Tigray highlands peak during early dry season (Y. Meheretu et al., submitted for publication). Similar correlated fluctuation in Bartonella prevalence and host density has been reported in woodrats (Morway et al. 2008) and in cyclic populations of field voles (Telfer et al. 2007).
Host characteristics and Bartonella infection
The GLM analysis showed significantly less chance of Bartonella infection among male individuals compared to the females. This may appear surprising given the generally accepted wisdom that males show increased susceptibility to infections due to reduced immune response compared to females (Klein 2000, Moore and Wilson 2002). However, behavioral differences between the sexes, for example, in home range and mobility, can also result in differential exposure and contact with infections. A better understanding of the sex differences would assist in modeling the potential spread of Bartonella.
Our results also indicated increased probability of Bartonella infection in reproductively active individuals. Bartonella infection has been shown to persist for several months in rodents. For instance, Bartonella infection has been reported to persist for more than 1 year in deer mice (Bai et al. 2011). This means that if the probability of infection is cumulative over time, the proportion of Bartonella-positive individuals will increase with the age of individuals (Gundi et al. 2004) and would explain why a heavier individuals or the class of reproductively active individuals show a higher prevalence. Contrary to our findings significantly lower infections in reproductively active male cotton rats than inactive males has been reported in the United States (Kosoy et al. 2004). However, they did not find a significant difference between reproductively active and inactive females. Jardine et al. (2006) also reported a decrease in the prevalence of Bartonella infection in ground squirrels (Spermophilus richardsonii) with age.
Ectoparasite infestation and Bartonella infection
Although the exact transmission mechanism of Bartonella among hosts is not fully understood (Morway et al. 2008), a growing number of studies have implicated several ectoparasites as potential vectors of Bartonella transmission in rodents (Billeter et al. 2008; Sackal et al. 2008; Reis et al. 2011). Several species of Bartonella, including the human pathogen B. elizabethae, have been detected in the Oriental rat flea Xenopsylla cheopis (Reeves et al. 2007; Tsai et al. 2010; Billeter et al. 2011), the cat flea C. felis (Billeter et al. 2008), and several species of Ixodes ticks (Kim et al. 2005). Recently, the vector competence of I. ricinus in Bartonella transmission has been confirmed experimentally (Reis et al. 2011). We did not find increased probability of Bartonella infection with increasing ectoparasite infestation in our data. In a previous study, we reported X. cheopis and Ixodes spp. as the most abundant fleas and ticks infesting rodents in Tigray highlands, respectively (Meheretu et al. 2011), thus we might have expected Bartonella infection to be associated with the load of these ectoparasites.
In a study investigating the dynamics of 4 closely related Bartonella species and their flea vectors in cyclic populations of field voles, it was shown that only 1 species of Bartonella was influenced by the presence of fleas and only in spring time (Telfer et al. 2007). It seems likely that the relevant ectoparasites are present in significant numbers such that host density rather than vector abundance plays the more important role in the dynamics of flea-transmitted Bartonella spp. (Telfer et al. 2007).
In our study, we did not investigate the correlation with respect to the different ectoparasite species. It is possible that at the species level, there might be a correlation between some Bartonella strains with specific ectoparasites. The presence of known Bartonella vectors on the small mammals in our localities calls for investigation of the bacteria in these ectoparasites. Detection of Bartonella in the ectoparasites would be a fundamental step toward establishing a link between the potential vectors and the bacteria (Reeves et al. 2007).
Detection of Bartonella in host samples
The pattern of clustering in the phylogenetic tree revealed that our Bartonella genotypes fall into 5 clades, 1 clade so far exclusively Ethiopian, 2 clades from Central and Eastern Africa, and the remaining 2 clades with genotypes from Africa and Asia. Recently, La Scola et al. (2003) suggested a cutoff point of sequence similarity <95.4% for delimitation of Bartonella species when using the rpoB gene. Although such choices are entirely arbitrary, this does allow the levels of sequence similarity observed between our genotypes and described Bartonella species to be set somewhat in context. Four of our clades would appear sufficiently diverged to satisfy this species description cutoff: Clades 1 and 5 (genotypes Q, R, S, T), which have been found only in Ethiopia, and clades 3 and 4 examples of which are restricted to Africa.
Three of our genotypes obtained from A. dembeensis were closely related to a genotype from A. neumanni from DRC in clade 4, hinting that the genotypes might be specific to Arvicanthis spp. On the other hand, it is interesting to note that on 4 occasions (in clades 1 and 5), the same Bartonella genotype was detected from 2 different rodent species (see genotypes A, B, C, and Q), suggesting low host-specificity of these genotypes. Previously low host specificity among Bartonella isolates has been reported in South Africa where rpoB-identical isolates were detected in M. natalensis and Tatera leucogaster (Pretorius et al. 2004).
The discovery of 18 different rpoB genotypes in a very restricted sampling area indicates a high level of Bartonella diversity among Ethiopian small mammals, some of which are of potential public health concern. The phylogenetic analyses, including representative Bartonella samples from other rodents, illustrate well that Muridae (e.g., rats, gerbils, mice) are likely an important reservoir of Bartonella. Given that ∼272 species of Muridae exist in Africa (37% of the world total) (Musser and Carleton 2005; IUCN 2011), it seems clear that many more Bartonella genotypes/species are waiting to be discovered.
Footnotes
Acknowledgments
This work was supported by the Flemish Interuniversity Council (VLIR), Belgium. We warmly acknowledge N. Van Houtte for her help in the genotyping of the small mammals. We are grateful to M.Y. Kosoy for helpful advice and S.J.E. Baird for helpful comments and native English proofing. We thank the Departments of Biology in Mekelle (Ethiopia) and Antwerp (Belgium) Universities for provision of laboratory facilities. Y.M. is a Ph.D. fellow with the VLIR-Institutional University Cooperation (IUC) Project. J.G.B. and M.B. are postdoctoral and Ph.D. fellows with Research Foundation Flanders (FWO).
Author Disclosure Statement
No competing financial interests exist.
Appendix 1.
Phylogenetic tree based on partial rpoB sequences of 18 Ethiopian and 114 known Bartonella using the neighbor joining method with the Kimura 2-parameter model of sequence evolution. GenBank accession numbers are indicated when relevant. A Brucella melitensis sequence was used as an outgroup. Numbers represent percentage bootstrap support (1000 replicates) for values “superior or equal” 50%. Scale bar, nucleotide substitutions per site.
References
Supplementary Material
Please find the following supplemental material available below.
For Open Access articles published under a Creative Commons License, all supplemental material carries the same license as the article it is associated with.
For non-Open Access articles published, all supplemental material carries a non-exclusive license, and permission requests for re-use of supplemental material or any part of supplemental material shall be sent directly to the copyright owner as specified in the copyright notice associated with the article.