
Abstract
Populations at the edge of their geographic distributions are referred to as peripheral populations. Very little attention has been given to this topic in the context of persistence of infectious disease in natural populations. In this study, we examined this question using zoonotic cutaneous leishmaniasis (ZCL) caused by Leishmania major in the Negev Desert of Israel as a model system. Here, we suggest that the regional persistence of Phlebotomus papatasi populations and L. major transmission in the Sede Boqer region could be explained through processes akin to sink-source and/or mainland-island metapopulation dynamics. Given its potentially enzootically superior ecological conditions, we hypothesize that the Zin Valley ecotope constitutes the “mainland” or the “source” patch for the Sede Boqer area where L. major transmission is persistent and resistant to local extinctions (die-outs) whereas the local sand fly populations on the Zin Plateau (“island patch” or “sink patch”) are more prone to local extinctions. Between 2007 and 2008, we trapped sand flies and sand rats in the two areas and compared sand fly abundance and L. major infection prevalence in both. In both 2007 and 2008, sand fly abundance was high and continuous in the Zin Wadi but low and discontinuous in the Zin Plateau. Infection prevalence of sand rats was significantly higher in the Wadi (13%) compared with the Zin Plateau (3%). Minimum infection rate in sand flies did not differ significantly between the two areas. Overall, our results are consistent with the premise that the Zin Valley population is relatively robust in terms of L. major transmission, whereas transmission is potentially more tenuous in the plateau. Understanding the biotic and abiotic processes enabling the persistence of L. major and other vector-borne diseases in peripheral disease foci is important for predicting the effect of anthropogenic land use and climate change.
Introduction
P
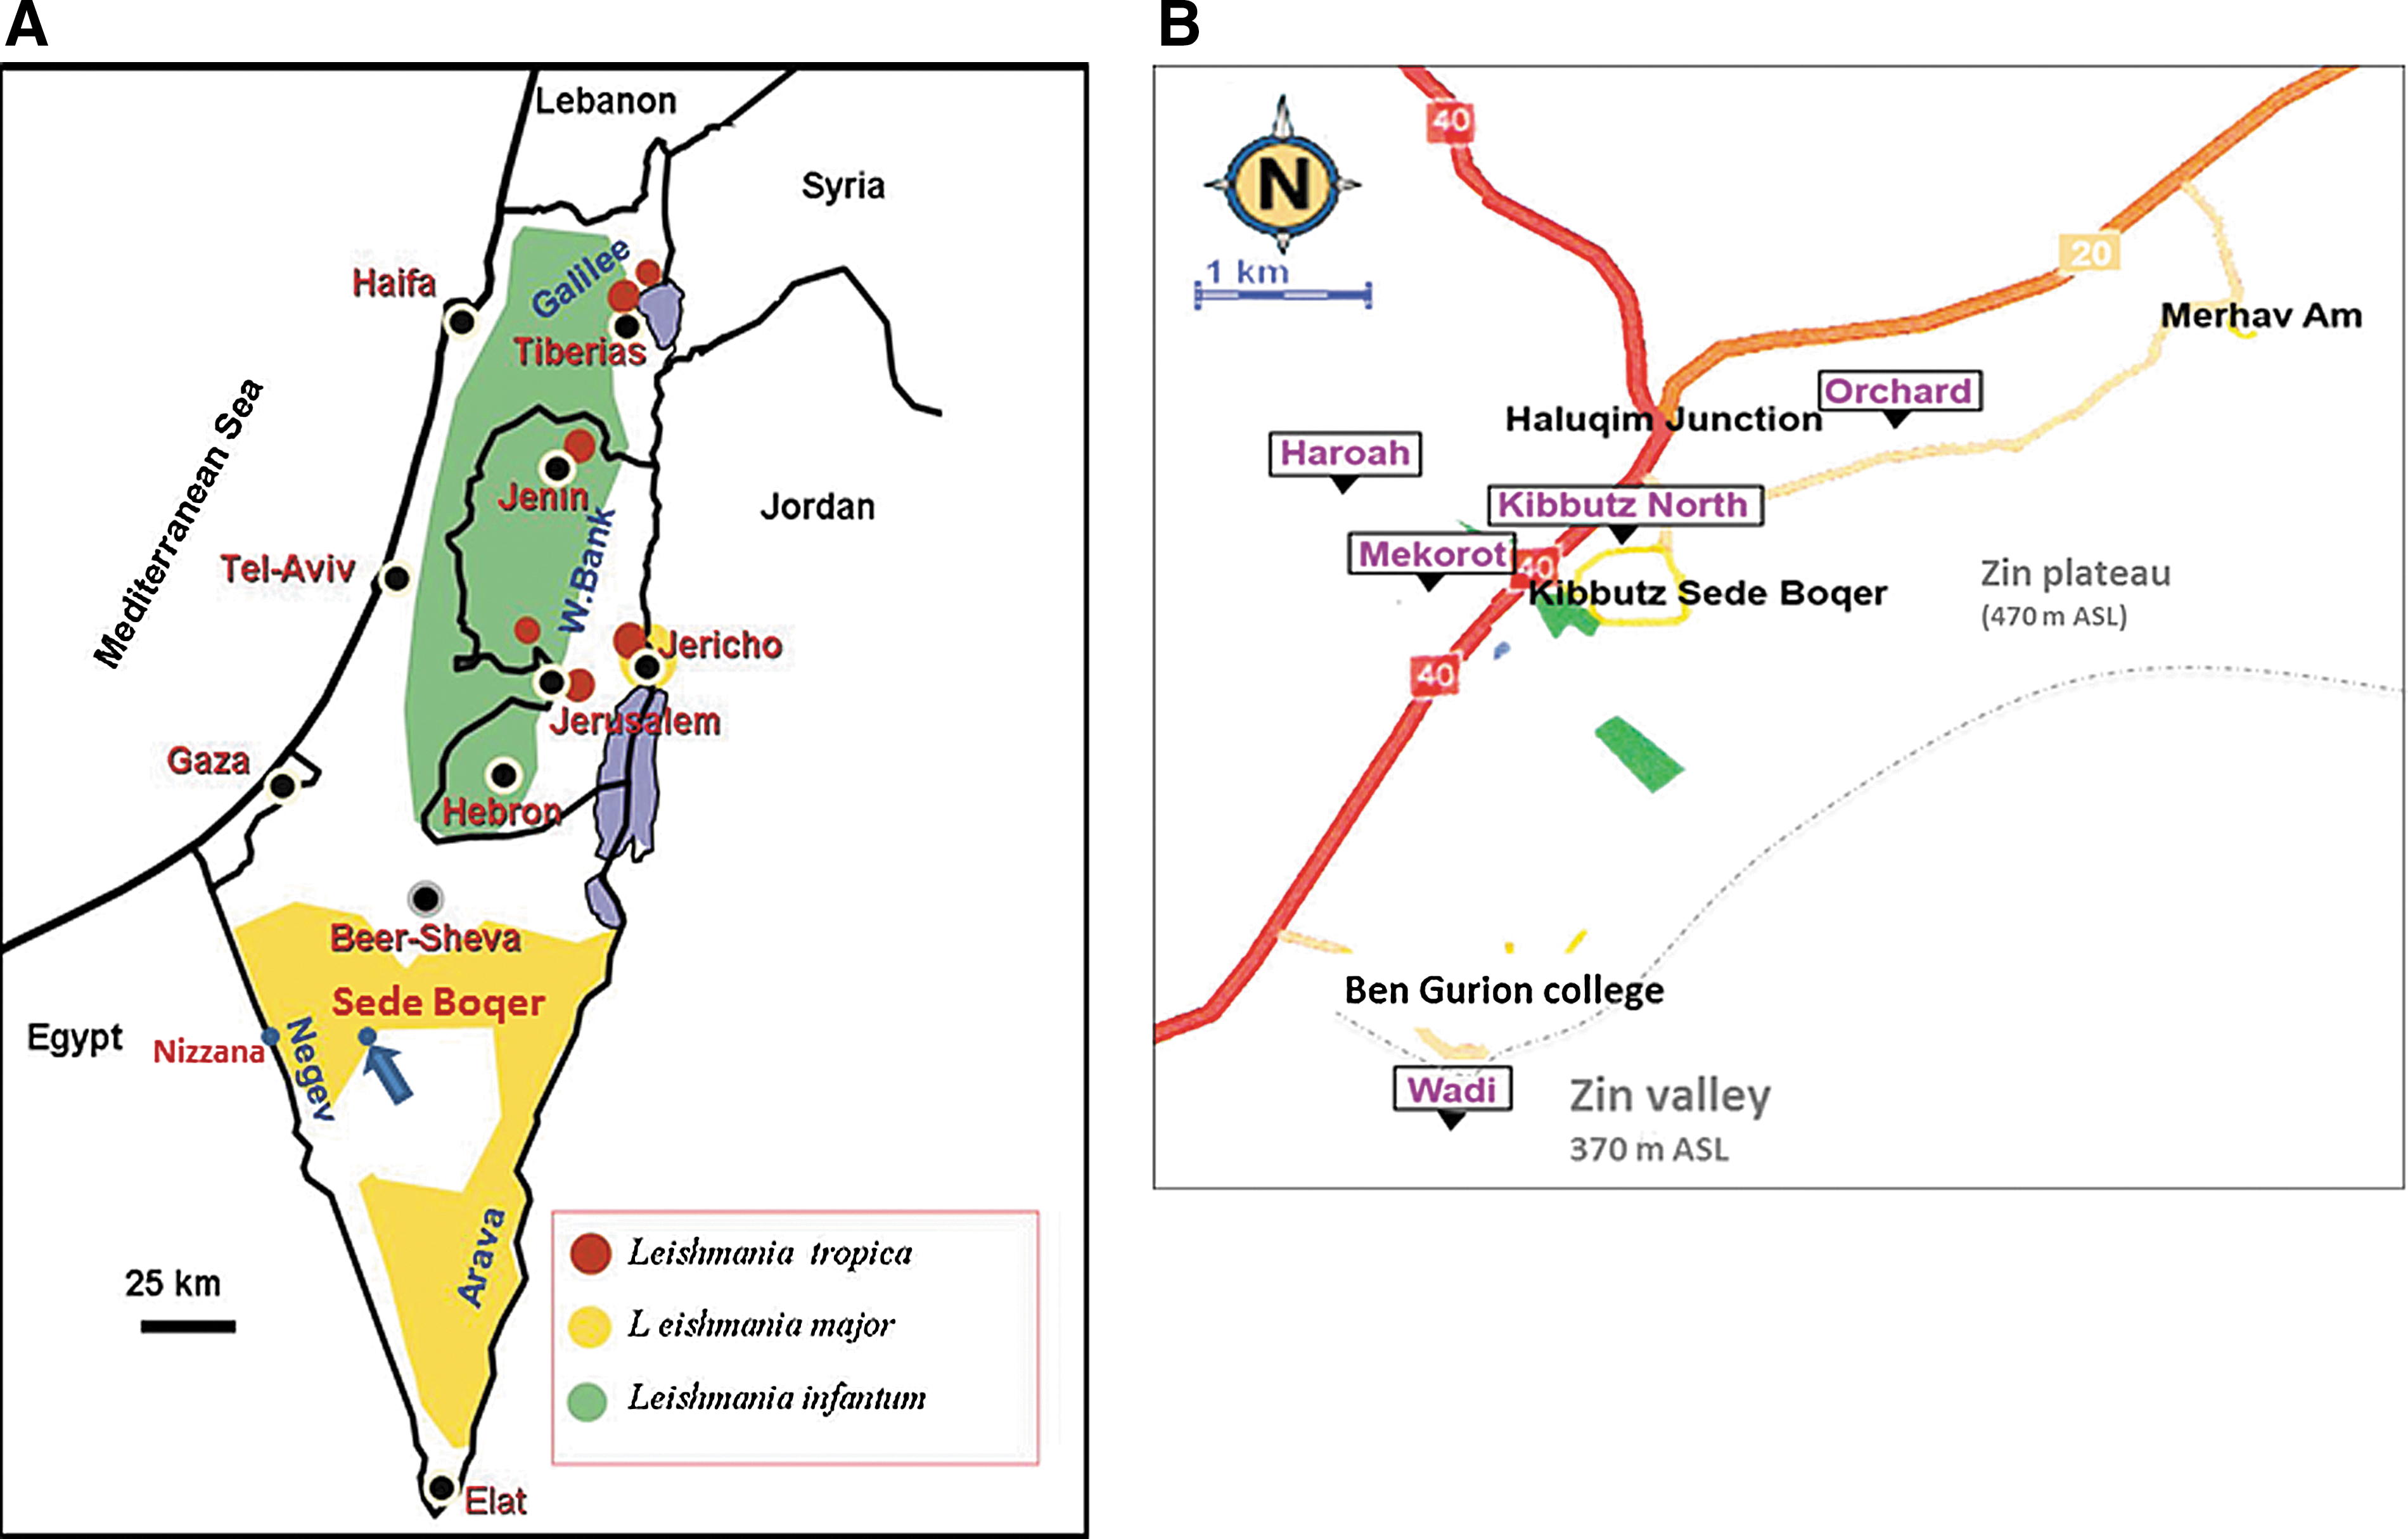
In this study, we examined this question using zoonotic cutaneous leishmaniasis (ZCL) caused by Leishmania major in the Negev Desert of Israel as a model system. The leishmaniases are vector-borne zoonotic diseases transmitted by phlebotomine sand flies. The principal reservoir host of L. major in the Middle East is the fat sand rat Psammomys obesus, and the vector is the sand fly Phlebotomus papatasi (Killick-Kendrick 1999, Ready 2013). In arid regions, the sand fly tends to live in sand rat burrows that provide ideal combinations of optimal breeding conditions, diurnal refuge for adult sand flies, and a readily available blood-meal source for the females (Ashford 1996). In Israel, the disease used to be highly endemic to the Jordan Valley, but during the last three decades the Negev has become progressively the major source of ZCL cases (Schlein et al. 1984, Jaffe et al. 2004) (Fig. 1A).
(
The site of Sede Boqer, located on the Zin Plateau and comprising the communal agricultural village (Kibbutz) of Sede Boqer and Ben-Gurion college, is situated at the margin of the distribution of endemic ZCL transmission in the Negev Desert (Jaffe et al. 2004) (Fig. 1). Despite the existence of a permanent sand rat populations (Shenbrot 2004) and the presence of sand flies (A. Warburg, personal observations) at higher elevations, endemic transmission of ZCL has not been reported from neighboring settlements and military bases located at higher elevations. The reason for this is unclear, but it could be associated with low sand fly density and/or possibly protracted extrinsic incubation period of the parasite due to lower temperature. Supporting the proposition that Sede Boqer is a peripheral area for ZCL are the observations that persistent transmission occurs only in agriculturally modified sites adjacent to the settlement (31% prevalence in sand rats), whereas sand fly numbers and infection prevalence in sand rats were very low (2%) in undisturbed habitats surrounding the settlement (Wasserberg et al. 2003). These observations suggest that the transmission process of L. major in Sede Boqer is quite tenuous and that it is facilitated through unintentional human-induced disturbance (Wasserberg et al. 2003, Berger 2009). Furthermore, it was observed that in the same area sand rats change their habitat use seasonally with Atriplex halimus–dominated habitats mainly used in the winter and spring, whereas Anabasis articulata–dominated habitats are mainly used in the spring and fall (Cervantes et al. 2003). Approximately 1 km south of Sede Boqer is an abrupt (ca. 100 meters) precipice that borders the Zin Valley (Fig. 1B). The bottom of the valley, located at 350–400 meters above sea level (ASL), enjoys warmer conditions compared with the Zin plateau above as well as continuous high soil moisture provided by local fresh water springs, with lush and dense Chenopodiaceae and other plants. Higher soil moisture and warmer temperatures have previously been shown to be conducive for L. major transmission (Schlein et al. 1984, Wasserberg et al. 2003, Abdel-Dayem et al. 2012). Furthermore, wind velocity was also estimated to be lower at the Zin Valley compared with the elevated Plateau (Forshpan et al. 2003), a fact that is also known to be conducive for heightened sand fly activity (Killick-Kendrick 1999, Ready 2013).
Here, we suggest that the regional persistence of P. papatasi populations and L. major transmission in the Sede Boqer region could be explained through processes akin to sink-source population dynamics (Pulliam 1988) and/or mainland-island metapopulation dynamics (Boorman and Levitt 1973). Sand rat distribution is highly patchy, resulting in patchy distributions of the sand fly vector and the pathogen populations (Wasserberg et al. 2003). Given its potentially enzootically superior conditions, we hypothesized that the Zin Wadi (hereafter, Wadi) ecotope constitutes a “source population” for the Sede Boqer region where sand flies enjoy a positive growth rate. This high-quality habitat could also constitute a “mainland-patch” where L. major transmission is persistent and resistant to local extinctions (die-outs). In contrast, the local sand fly populations on the less favorable Zin Plateau (hereafter, Plateau) are expected to constitute a “sink population” and be more prone to local extinctions (and therefore possible disease die-outs).
We further hypothesize that the Plateau constitutes “island” populations subject to frequent extinctions and recolonization by dispersing sand flies and/or sand rats from the Wadi or mitigated via a rescue effect. Our specific goal in this study was to evaluate some of the basic tenets of this hypothesis by comparing the relative abundance and temporal dynamics of sand flies as well as L. major infection patterns in the vector and the reservoir host between the Zin Wadi and Plateau sites. We expected to find larger sand fly population size and longer and more persistent dynamics as well as higher sand fly and sand rat infection prevalence in the Zin Wadi site. We also tested an alternative hypothesis that difference in sand rat infection prevalence is due to difference in age structure by comparing sand rat size structure distribution between the two sites.
Materials and Methods
Study site
Sede Boqer is situated in the Central Negev Desert (30°52′N, 34°46′E) (Fig. 1A), located on the Zin Plateau, and comprises the communal agricultural village (Kibbutz) of Sede Boqer and Ben-Gurion college (Fig. 1B). Rainfall typically occurs between October and April, with an annual average of 93.2 mm. Mean annual temperature is 18.2°C, ranging between 9°C in January and 25°C in August (Sede Boqer Meteorological Station). The Zin plateau is an aeolian (loess) plain (470 meters ASL) characterized, typically, by Irano-Turanian steppe vegetation (Danin 1983), such as Haloxylon scoparium and Zygophyllum dumosum shrubs. It is surrounded by rocky hills to its east, north, and northwest. To its south and southwest, it is bordered by a sheer cliff dropping approximately 100 meters into the Zin Valley (Fig. 1B). The Zin Valley is substantially more arid with mean annual temperature of 20°C and annual precipitation of 50–70 mm (Ben-Yosef 2001). Vegetation is typically Saharo-Sindian (Danin 1983). Yet, local springs in the study area provide for a rich and lush vegetation (Table 1) dominated by plants such as Atriplex halimus, Retama raetam, and Tamatix nilotica. Due to its lower elevation, wind speed in the Zin valley is estimated to be lower (4.5–5 meters/s) than in the Negev highlands surrounding it (45–5.5 meters/s) (Forshpan et al. 2003). Several gullies connect the Wadi and the Plateau through which animals typically traverse.
The first four plots represent four typical habitats in the Zin Plateau site, whereas the fifth represents the Zin Wadi site.
Originally, the orchard was active agricultural land, but irrigation stopped in 2006, and the orchard was uprooted in 2008.
Collection and identification of sand flies
Sand flies in arid regions tend to shelter and breed in their host burrow; therefore, we directed sand fly trapping toward clusters of sand rat burrows. Four clusters, in typical habitat types (Table 1), were selected on the Zin Plateau near Kibbutz Sede Boqer and one cluster in a typical Wadi habitat the Zin Valley (Fig. 1B). Sand flies in arid regions inhabit mainly active rodent burrows, so traps were located only next to active sand rat burrows (identified as active on the basis of characteristics previously defined by Wasserberg et al. 2003). Sampling sites were selected such that each site would comprise at least seven active burrows. Site characteristics include the area covered by each burrow cluster (patch), its altitude, average soil moisture, relative cover of Chenopodiaceae plants, and land use (Table 1).
Between May and November in 2007 and 2008, we sampled sand flies in the study plots monthly for 2 consecutive days in each month. We used miniature CDC light traps (model 512, John W. Hock, Gainesville, FL) operated without light, baited with CO2 from dry ice (Maxima, Israel), and powered by a 6-volt rechargeable battery (model 3FM12, Amit Industries Ltd., Ashdod, Israel). These were deployed at dusk and collected the following dawn. Trapping stations were located near active sand rat burrow openings. Traps were suspended in the downdraft position, with the trap entrance approximately 50 cm above the ground. This is the standard method for sand fly surveillance in Israel (Faiman et al. 2009, Orshan et al. 2010). Trapping took place during the waning moon phase, weather permitting. Four traps were placed in the larger patches (Mekorot, Wadi, Orchard; Fig. 1B) and three in the smaller patches (Haroa, Kibbutz North; Fig. 1B). In 2007, we trapped for 14 nights (May through November, a total of 235 trap nights). In 2008, we trapped for 14 nights (May through October, a total of 228 trap nights. The catch was brought to the laboratory, chilled, sorted, and counted. All males and samples of the females were identified to species (Perfil'ev 1968, Artemiev and Dergacheva 1978). The majority of females were pooled in groups of up to 20 for molecular detection of Leishmania DNA. Assuming only one sand fly was infected with Leishmania in a positive pool, minimal infection rate (MIR) was calculated as: Infected number of females/examined number of females * 1000.
Rodent trapping
We trapped rodents during seven field sessions (10/2004, 06/2005, 12/2005, 01/2007, 07/2007, 01/2008, 07/2008) both on the Zin Plateau and the Wadi. Rodents were trapped using open-mesh live-traps (41×13×13 cm, Tomahawk M-201) baited with fresh A. halimus leaves, with traps left open for a minimum of 4 h each day, usually from 6 AM to 10 AM. Prior to each trapping session, we marked the active burrows in each plot. Two traps were placed near each active burrow opening. Each trapping session in each plot lasted up to 9 days. We marked each captured rodent with an individually numbered metal ear tag (Salt Lake City Stamp Company), and recorded weight, sex, approximate age group (adult, juvenile), and existence of external infection marks. We also took small skin biopsies from ear pinnae and blotted the biopsies onto filter paper for later parasite detection.
Leishmania parasite detection
Parasite detection in sand flies
The presence of Leishmania DNA in pooled samples of sand fly females (5–20 specimens per sample) was detected by PCR amplification of the internal transcribed spacer (ITS1). Leishmania species identification was carried out by restriction of the amplified fragment (Schonian et al. 2003).
Parasite detection in sand rats
We obtained skin samples (n=185) from trapped sand rats by scraping the skin of the ear pinnae with a scalpel. Skin samples from sand rat ear pinnae (n=185) were blotted onto a filter paper. Leishmania kinetoplast DNA (kDNA) was detected by PCR using the primers 13A (5′-GTGGGGGAGGGGCGTTCT-3′) and 13B (5′-ATTTTCCACCAACCCCCAGTT-3′) (Schonian et al. 2003). To validate the quality of the skin samples, samples from 70.8% of the individuals (n=131) were checked for presence of sand rat DNA presence (P. obesus cytochrome b gene, complete cds; mitochondrial, locus AY93454) using the primers 5′-CCTAACATTTCATCCTGATGA-3′ (forward) and 5′- CTCAAAAAGATATCTGTCCTC-3′ (reverse) according to NCBI AY934540 (
Environmental variables characterization
Measurement of soil moisture
Six soil samples per plot were taken from a depth of approximately 30 cm using an auger. Two samples were taken near the root of a bush adjacent to a burrow (1 meter). Four more samples were taken from the margins of the plots (border plot). Soil samples were collected in late October, 2007 (the end of the dry season). Samples were weighed, dried in an oven at 105°C for 48 h, weighed again, and the percent moisture calculated.
Shrub cover index
In each sampling plot, all burrow systems were categorized as being in either high (>50% cover) or low (<50% cover) shrub cover by estimating shrub cover within a 5-meter radius around each burrow system. Shrub cover index was calculated as the proportion of burrows with high shrub cover.
Infection rates in humans
Data regarding the number of human cases were taken from the environmental unit, Ramat Negev Regional Council. Estimates of population size were taken from the Central Bureau of Statistics and the settlements' secretaries.
Data reduction and statistical analysis
We analyzed sand fly trapping data using a negative-binomial analysis of deviance (ANODev) (McCulagh and Nelder 1989). Negative binomial analysis accounts for the nature of our data (count data) and for the high degree of overdispersion (overdispersion parameter ≥17.08) (McCulagh and Nelder 1989). We conducted a three-way ANODev to test for the effect of area (Wadi versus Plateau), year (2007 versus 2008), month (May–November), and all the interactions thereof (hereafter, the saturated model). We used a model selection approach (Burnham and Anderson 1998) to identify the best-fitting model by comparing the Akaike information criterion (AIC) of the saturated model with all of its simpler nested models. We used chi-squared contingency tests for comparing the sand fly species and gender, and to compare proportion of blood-fed, proportion of infected sand fly pools, and sand rat infection prevalence between the Wadi and the Plateau. To evaluate the potential confounding effect of age structure on sand rat infection prevalence in the two habitats, we compared, using the Kolmogorov–Smirnov test, the sand rat's body mass distribution (a rough surrogate of age-class; Wasserberg et al. 2002) between the Wadi and the Plateau. All analyses were conducted using R statistical software (R Development Core Team 2012).
Results
General
In 2007, we collected 386 sand flies (45 males, 341 females; χ2=226.9, p<0.0001) in 235 trap nights (mean 1.642 per trap, range 0–55), with 48.5% of traps containing sand flies. P. papatasi comprised 53.3% (n=24) of captured males, with the rest being Paraphlebotomus spp. (47.7%, n=21) (χ2=0.004, p=0.946). In 2008, we collected a total of 1239 sand flies (414 males, 825 females; χ2=136.3, p<0.0001) during 228 trap nights (mean 5.434 per trap, range 0–107), with 57.5% of traps containing sand flies. In 2008, the proportion of P. papatasi captured males from total sand fly captured was substantially higher compared with 2007 (94.4%, n=391), with the rest being Paraphlebotomus spp. (5.6%, n=23) (χ2=327.1, p<0.0001). Soil moisture was significantly higher in the Wadi (mean±standard error [SE] 2.41±0.12%) compared with the Plateau (6.94±0.54%) (t=8.26, p=0.0002).
Sand fly abundance, dynamics, and distribution
We lumped sand fly abundance data across the four plateau sampling plots because there was no significant difference among them (one-way negative binomial ANODev; p>0.25). After comparing with other competing models, model no. 1 (the saturated model) and model no. 2 (the saturated model less the three-way interaction) (Table 2) fitted the data substantially better than all other competing models (ΔAIC ≥6.6) (Table 2). We found a highly significant effect of “area” (Table 3), with sand fly numbers being more than an order of magnitude higher in the Wadi (22.89 versus 1.83, mean sand flies per trap, respectively). We further observed a significant “year” effect (Table 3), with sand fly numbers being almost four times higher in 2008 compared with 2007 (19.35 versus 5.37 mean sand flies per trap, respectively). The effect of “month” was also statistically significant (Table 3) with, overall, sand fly numbers during the summer months of June, July, and August being significantly higher than during the spring (May) or the fall (September–November). As the significant area-by-year interaction suggests (Table 3), the difference in sand fly relative abundance between the Wadi and the Plateau differed between 2007 and 2008. Indeed, the difference between the Wadi and the Plateau was 2.3 times greater in 2008 (36.42 vs. 2.26, respectively) compared with 2007 (9.35 vs. 1.39, respectively) (Fig. 2). As the significant area-by-month interaction suggests (Table 3), sand fly seasonal abundance patterns differed between the two habitats. Generally, the sand fly seasonal abundance pattern was continuous in the Wadi and relatively discontinuous in the Plateau (Fig. 2). This is particularly apparent during 2008, when sand fly abundance in the Wadi was continuous, with highest levels between June and August with a peak in July; in the Plateau, two small abundance peaks occurred in June and October, while in the rest of sampling months sand fly abundance was minimal (Fig. 2). The significant year-by-month interaction (Table 3) indicates that the seasonal abundance pattern of sand flies in the Sede-Boqer region differed between 2007 and 2008. In 2007 sand fly abundance peaked in August, whereas in 2008 it peaked earlier during June and July (Fig. 2). Finally, the significant three-way area-by-year-by-month interaction (Table 3) simply indicates that the habitat-specific seasonal abundance patterns differed between 2007 and 2008 (Fig. 2).
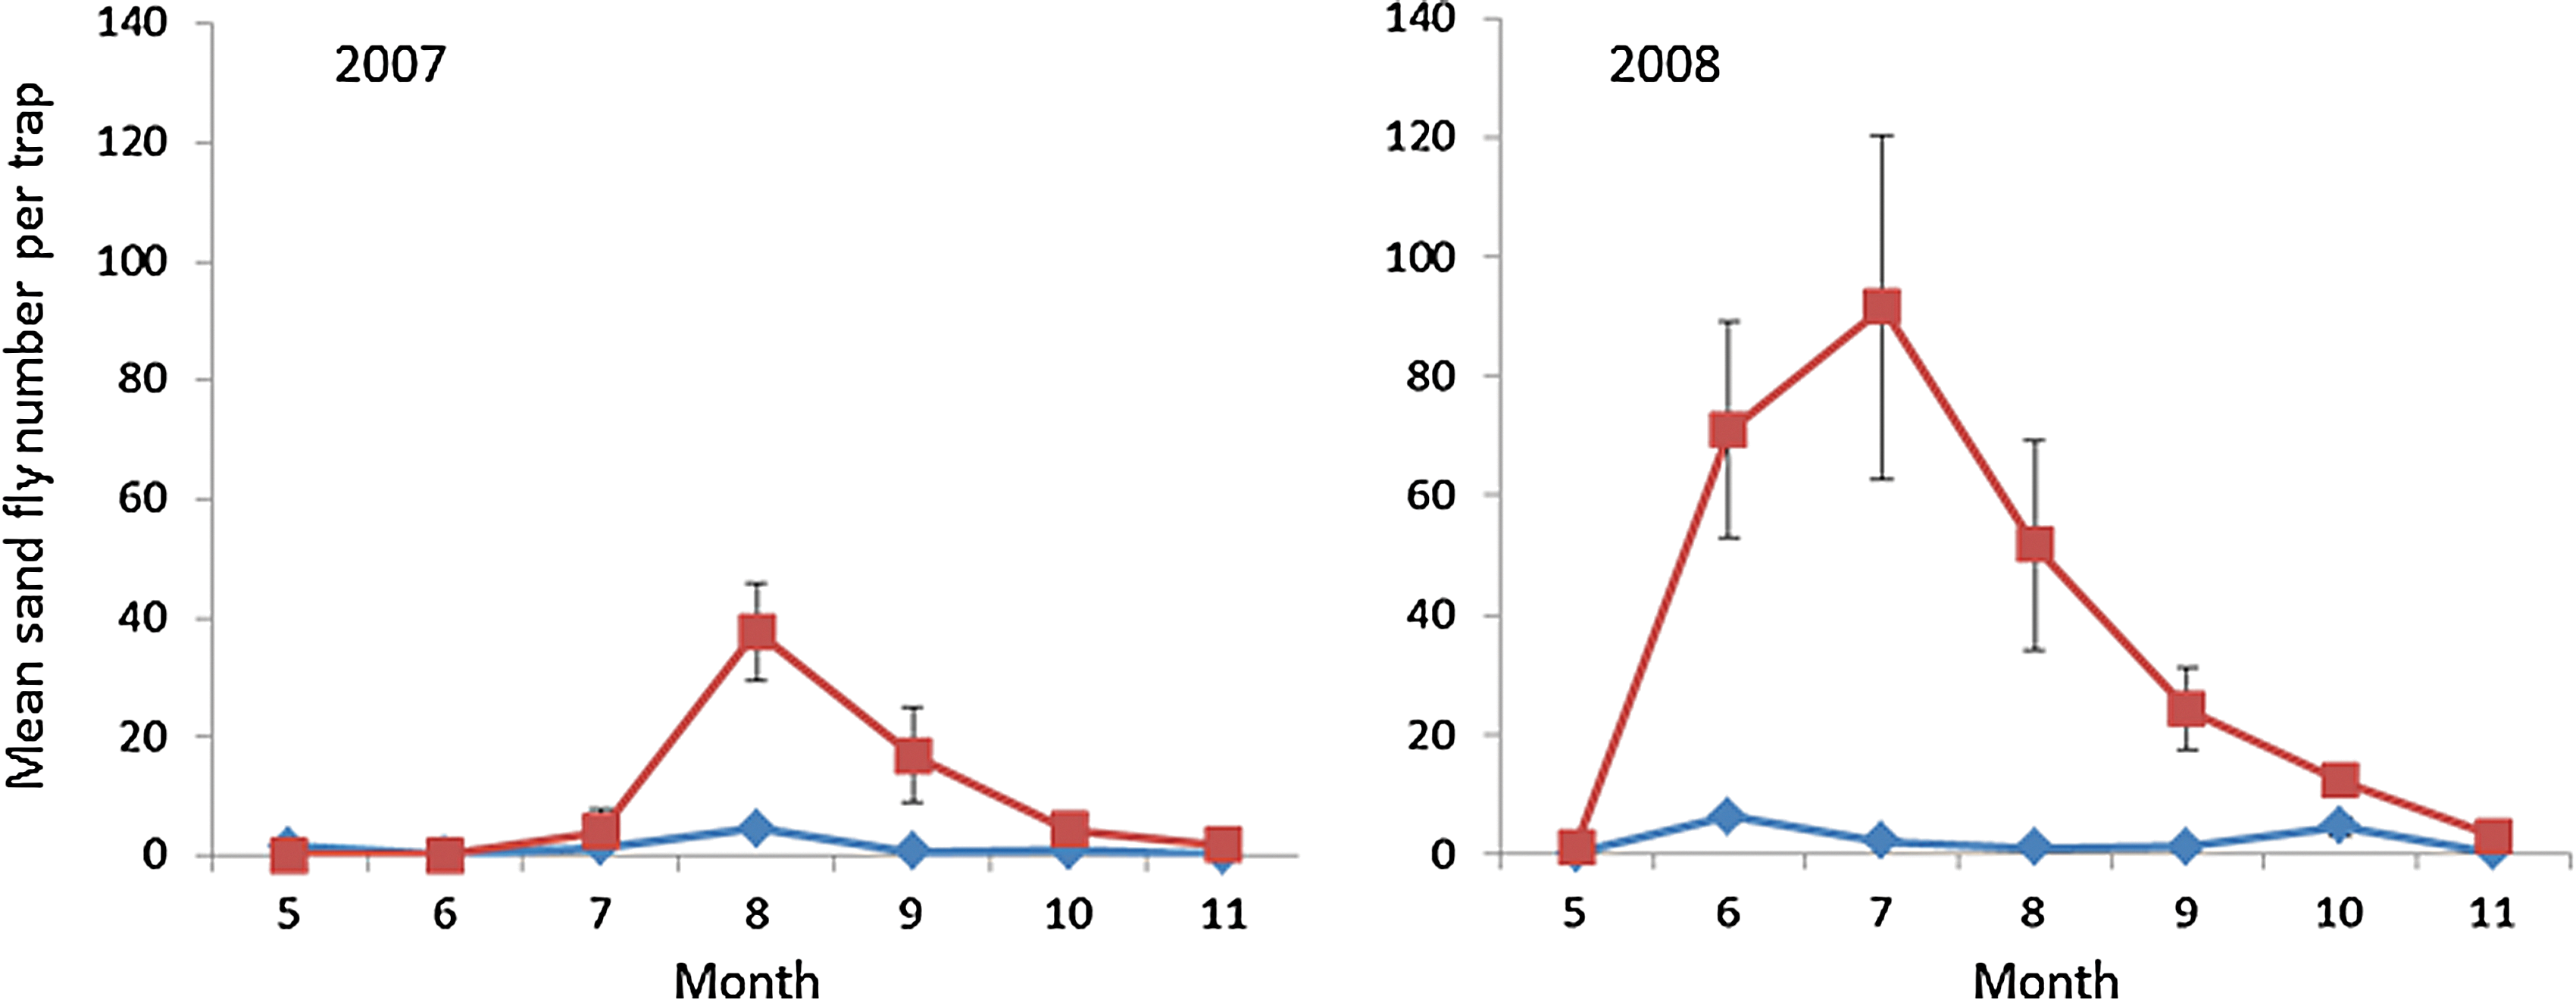
Seasonal activity patterns of sand flies between May and November for 2007 and 2008. Square and diamond markers indicate sand fly relative abundance levels in the Wadi and the Plateau, respectively (mean±standard error [SE]). Color images available online at
Models are sorted in terms of level of complexity from the saturated model (model no. 1) to the simplest (main effects only, model no. 9).
AIC, Aikake information criterion.
Dispersion parameter for negative binomial=1.34.
DF, degrees of freedom; df, residual degrees of freedom; Res. dev., residual deviance.
Blood meal distribution, sand fly infection rates, estimation of MIR, and association with human seasonal infection patterns
In 2007, no blood-engorged sand flies were trapped and only a single infected sand fly pool was found (MIR=2.93%), coming from the Wadi in August. Therefore, all subsequent analyses were based on the 2008 data, which was composed mainly of P. papatasi (94.4%). The proportion of blood-engorged females did not differ between the Wadi (4.3%, n=691) and the Plateau (5%, n=139) (contingency test, χ2=0.13, p=0.72).
With respect to the proportion of infected female pools, no significant difference between the Wadi and the plateau was found (contingency test, χ2=0.68, p=0.41), with 13 positive pools out of 34 (47%) in the Wadi and four positive out of 12 pools in the plateau (33%). Similarly, MIR did not differ between the Wadi and the Plateau (contingency test, χ2=0.000089, p=0.976). Qualitatively, the seasonal infection dynamics in sand flies in appeared similar in both sites, with MIR peaking in both areas in August and October (Table 4). Also, qualitatively, human cases appeared to follow the August and October MIR peaks (Table 4, and see Fig. 2).
MIR (given in units of MIR per 1000).
BGC, Ben-Gurion College; MIR, minimal infection rate.
Infection prevalence and population structure in sand rats
A total of 192 sand rats were caught between October, 2004, and July, 2008 (0.52:0.48 male/female ratio): 46 in the Wadi and 146 in the Plateau. Six infected sand rats were found in the Wadi and five in the Plateau. Raw infection prevalence was significantly higher in the Wadi (13%) compared with the plateau (3%) (Fisher exact test, p=0.034). Out of 131 samples tested, 65.6% tested positive for sand rat DNA. On the basis of this rate, total adjusted infection prevalence was 8.7%. Adjusted infection prevalence in the Wadi and the Plateau were 19.8% and 4.6%, respectively (Fig. 3A). Infection prevalence did not differ between gender (female, 5.5%; males, 6%; Fisher exact test, p=1.0). Infection prevalence (unadjusted) was positively correlated with body-mass class at both the Wadi (Pearson r=0.94, p=0.056) and the Plateau (Pearson r=0.97, p=0.028) (Fig. 3A), but body-mass class distribution did not differ between the two sites (Kolmogorov–Smirnov test, D=0.75, p=0.21) (Fig. 3B).
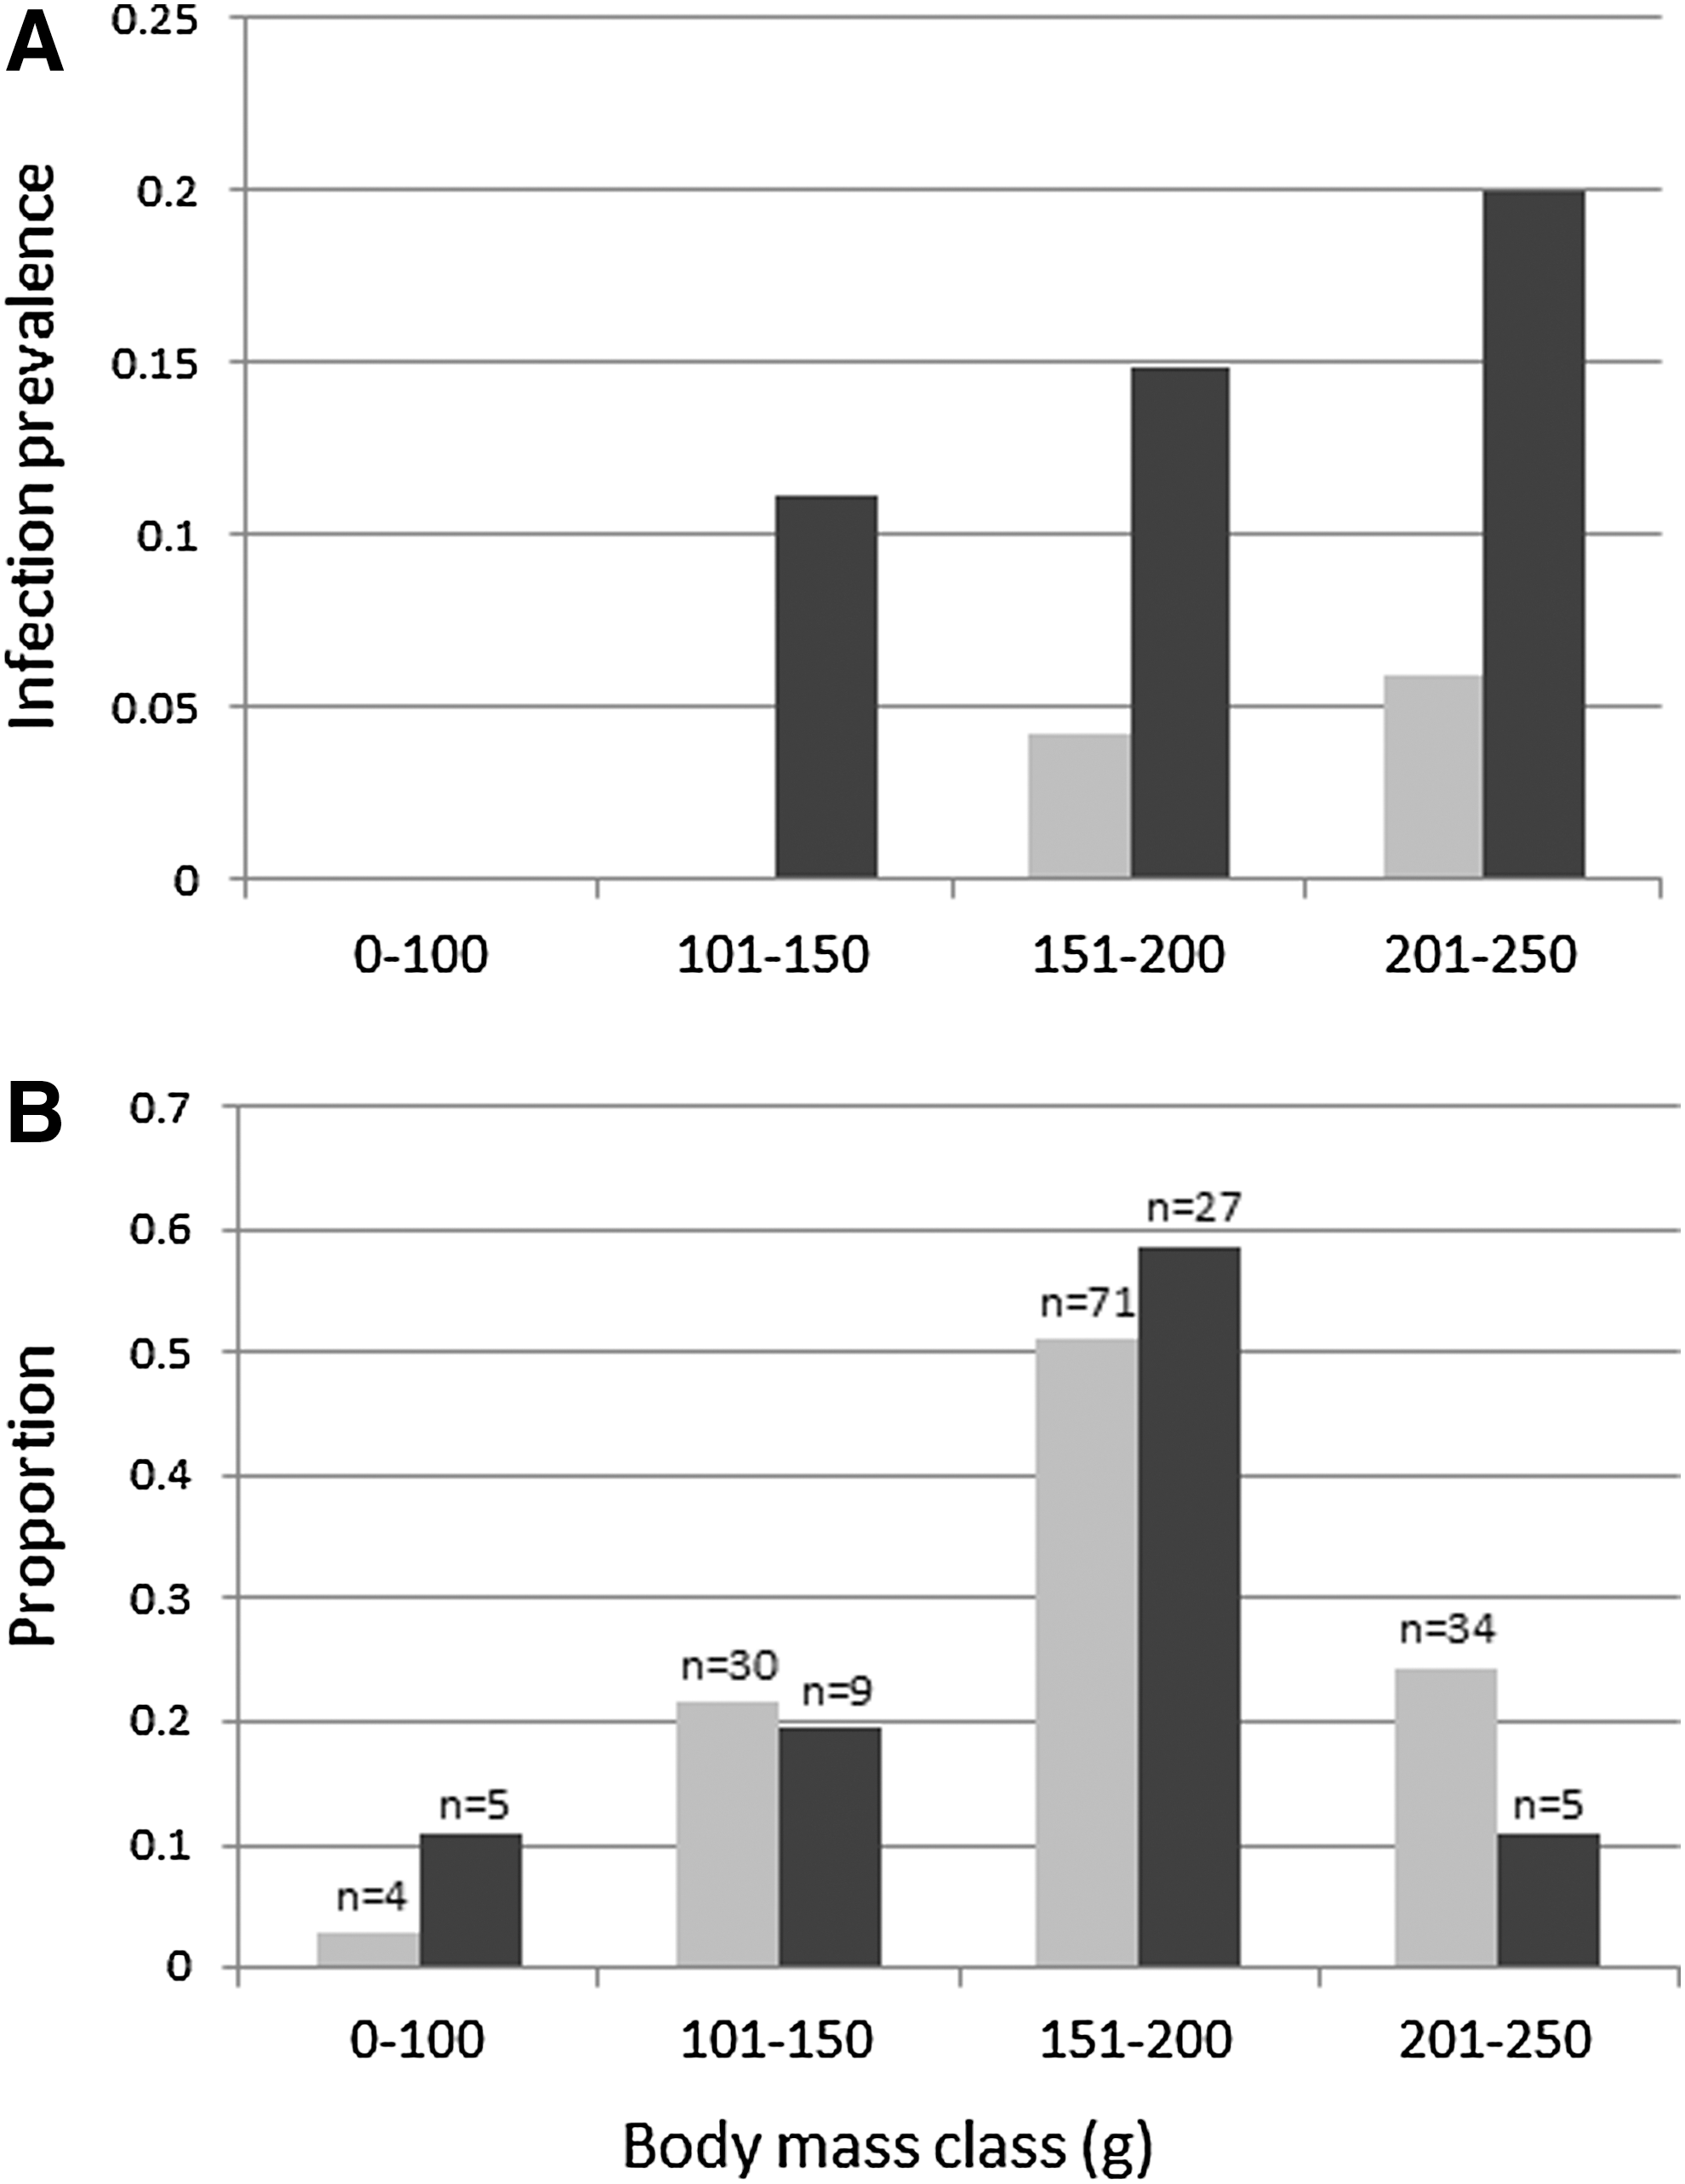
Infection patterns and population structure in the sand rats. Numbers above the bars in
Discussion
Our specific goal in this study was to compare sand fly population dynamics and abundance as well as L. major vector and reservoir host infection prevalence between the putatively persistent patch of the Zin Wadi and the more tenuous patches of the Zin Plateau. Although overall sand fly abundance was fairly low, these numbers are not atypical to this region (Schlein et al. 1984, Wasserberg et al. 2003), as might be expected for a peripheral population. As expected, in both 2007 and 2008, sand fly abundance was substantially higher in the Zin Wadi. Furthermore, in the Wadi sand fly activity was generally continuous between May to early November, whereas in the Zin Plateau, sand fly activity pattern was shorter and discontinuous. The Zin Wadi patch was characterized by higher soil moisture compared with the plateau patches (6.94% versus 2.40%, respectively). This, together with generally higher temperature and expected lower wind velocity (Forshpan et al. 2003) suggests more favorable conditions for sand fly activity and abundance facilitating pathogen transmission, as reflected by the four-fold higher infection prevalence of the sand rats in the Wadi. Similarly, although not statistically significant, the proportion of L. major–positive sand fly pools tended to be higher in the Wadi (47%) compared with the plateau (33%). In 2007, only a single infected sand fly pool was found and, therefore, all subsequent sand fly infection analyses were based on the 2008 data, which was composed mainly of P. papatasi (94.4%). Hence, even though L. major screening was done for all sand fly species combined, the predominance of P. papatasi in those samples indicates that the reported infection rates pertain primarily to P. papatasi. Proportion of blood-engorged sand fly females did not differ between the two areas, suggesting similarity with respect to blood-meal availability, which is not surprising given the abundance of sand rats in both sites. Another fact that is consistent with the hypothesis of L. major transmission being more tenuous in the Zin plateau is the observation that in 2007, the year when sand fly abundance was low overall and transmission season shorter, the only L. major positive sand fly pool was from the Wadi.
There was a substantial difference in sand fly abundance and seasonal dynamics between the 2 years, with sand fly abundance being almost four times higher and peaking earlier in the warmer and drier 2008 (18.74°, 70.4 mm, last rain event February) compared with the cooler but wetter 2007 (18.6°,175 mm, last rain event May) (Sede Boqer Meteorological Station, Ben-Gurion University). Furthermore, sand fly species composition differed with P. papatasi composing only 53.3% in 2007 compared with 94.4% in 2008. The other species were identified at the subgenus level as Paraphlebotomus spp. This 2007 finding was quite surprising given that previous (Schlein et al. 1984, Wasserberg et al. 2003) and later samplings (this study for 2008, L. Orshan, unpublished data for 2009, 2010, and 2012) found P. papatasi to comprise >90% of the sample with other paraphlebotomines being P. alexandri and P. sergenti. These differences in sand fly abundance and the increase in the proportion of P. papatasi between 2007 and 2008 were consistent with local ZCL disease incidence reported from the local human settlements and incidence rate doubling from 768 cases per 105 in 2007 (12 human cases) to 1532.5 cases per 105 (29 human cases) in 2008 (sources, the environmental unit, Ramat Negev Regional Council). This was also consistent with our (relatively sparse) MIR data that indicates an order of magnitude lower level of infection in 2007 compared with 2008 (MIR 2.91% versus 23.9%, respectively). Similarly, no infected sand rats were detected in 2007 compared with 2.12% in sand rats sampled in 2008. Seasonally, infection patterns in humans appear to be positively associated with sand fly seasonal dynamics patterns and MIR trends (Table 4, Fig. 2). MIR dynamics appear to vary similarly in the Wadi and the Plateau, with peak levels occurring in August and October. These peaks seem to correspond with peaks of human cases occurring 1–2 months later (Table 4).
As expected, infection prevalence in sand rats was about four times higher in the Wadi compared with the Plateau. However, in contrast with Wasserberg et al. (2002), who found lower infection prevalence in a sand rat population characterized by smaller (probably younger) individuals, here body mass distribution did not differ between the two sites. This strongly suggests that the major difference in sand rat infection prevalence between the two sites is due to difference in sand fly abundance.
In this study, we used an ecological approach by applying the conceptual framework of core-periphery and metapopulation theory and applied ecological field methods for better understanding the persistence of ZCL at the edge of its range. Such an ecologically based approach has proved itself useful in previous studies (Fichet-Calvet et al. 2003, Wasserberg et al. 2003). Our results indicate that sand fly abundance and L. major transmission rates are higher in the Wadi ecotope compared with the Plateau ecotope. In addition, the observed differences between years and among-sites in its abundance are consistent with the susceptibility of P. papatasi sand flies to low temperatures (Cross and Hyams 1996, Cross et al. 1996, Abdel-Dayem et al. 2012). This, together with its susceptibility to low soil moisture (Wasserberg et al. 2003), suggest that the P. papatasi local populations in the Plateau are more prone to local extinctions compared with the Wadi with its persistently higher levels of soil moisture and warmer temperatures.
Nevertheless, it is important to acknowledge that these results are only suggestive; they do not conclusively prove that persistence of L. major in this peripheral region is maintained via processes akin to mainland-island metapopulation dynamics (Boorman and Levitt 1973) or, possibly, source-sink dynamics (Pulliam 1988). Many more studies will need to be performed to validate such hypotheses. These could include, among others, long-term monitoring of sand fly population and infection dynamics in reservoir host patches in the Wadi and the Plateau ecotopes, as well as a study of the dispersal behavior of sand flies and sand rat to evaluate the degree of population exchange between the two areas. Yet, our results are consistent with the premise that the Zin Valley population is relatively robust in terms of L. major transmission, whereas in the Plateau transmission is potentially more tenuous.
In conclusion, our understanding of the persistence of vector-borne diseases in a sink-source metapopulation context is still in its infancy. Theoretical models suggest that vector-borne diseases can invade and persist in sink-source systems, with vector longevity, immigration, feeding rate, and prolonged infectious period enhancing disease spread (Rascalou et al. 2012). Yet empirical studies explicitly testing these hypotheses are gravely missing. In that sense, ZCL at Sede Boqer constitutes an ideal model system for studying the persistence of a vector-borne zoonosis at the edge of its geographic distribution within a metapopulation context. Understanding the ecological processes enabling the persistence of vector-borne diseases in peripheral disease foci is important for predicting the possible effects of anthropogenic land use and climate change on the geographic distribution of these devastating yet ecologically complex disease systems.
Footnotes
Acknowledgments
This work was supported by grant number 144-06 from the Israeli Science Foundation. A graduate fellowship to R. Berger was awarded by the Mitrani Department for Desert Ecology, The Blaustein Institutes for Desert Studies. Travel funds from Department of Biology, UNC–Greensboro were awarded to G. Wasserberg. The authors would like to thank B. Krasnov, G. Shenbrot, B. Boeken, P. Berliner, N. Lazarovitz, I. Giladi, S. Bar-David, and L. Schnur for their guidance regarding field and lab sampling and analyses. We would also like to thank the field and lab assistants and technicians Y. Morgenstern, A. Florentin, V. Hochman-Adler, D. Teller, T. Jaekel, and I. Hoffman. We also thank Sh. Mukharjee, K. Embar, C. Iribarren, V. Sundararaj, and O. Berger for useful discussions.
The authors would like to thank the two anonymous reviewers for their helpful comments. This is publication number 843 of the Mitrani Center for Desert Ecology.
Author Disclosure Statement
No competing financial interests exist.