
Abstract
Q fever is a widely distributed, yet, neglected zoonotic disease, for which domestic ruminants are considered the main reservoirs in some countries. There are still many gaps in our knowledge of its epidemiology, and the source of sporadic cases is often not determined. In this study, we show how Q fever surveillance data in combination with information routinely collected by government agencies in Minnesota during 1997 to 2015 can be used to characterize patterns of occurrence of Q fever illnesses and detect variables potentially associated with increased human illness. Cluster analysis and Bayesian spatial regression modeling revealed the presence of areas in Southern Minnesota at higher risk of Q fever. The number of sheep flocks at the county level helped to explain the observed number of human cases, while no association with the cattle or goat population was observed. Our results provide information about the heterogeneous spatial distribution of risk of Q fever in Minnesota.
Introduction
Q
Q fever became a nationally notifiable condition in the United States in 1999; since then, cases have been reported in almost every state (McQuiston and Childs 2002). Even though the reported case incidence is low (0.4 cases per million persons per year), the asymptomatic or nonspecific clinical presentation typically seen in acute cases and the difficulty with definitive laboratory confirmation suggest that Q fever incidence may be greatly underestimated (Dahlgren et al. 2015a). Between 1999 and 2008, a ninefold increase in the number of documented cases was reported to the Centers for Disease Control and Prevention (CDC 2013). The fatality rate of Q fever cases in the United States is reported as 2%, but for the same reasons previously described, the true figure may be between 5 and 14 times higher (Dahlgren et al. 2015b). Although differences in reporting make interpretation of state-level surveillance data difficult, states from the West North Central census division of the United States are believed to be among those with the highest reported incidence rates of Q fever (Dahlgren et al. 2015a), which could reflect increased exposure due to higher livestock density (particularly sheep) in this region.
Animals are considered to be the main source of infection for the human population. Infected animals can shed millions of Coxiella bacteria mainly in birth products and, to a lesser extent, in feces, urine, and milk, and the organism is easily transmitted by aerosols (Rodolakis 2009). Despite the United States being one of the first countries to describe Q fever infections, still relatively little is known about its prevalence and geographic distribution in animals (McQuiston and Childs 2002). Clinical infection is rarely diagnosed in livestock and outbreaks are often unrecognized due to the absence of active animal disease surveillance programs. Recent studies analyzing samples from dairy cattle herds across the United States identified a very high herd-level prevalence (60–96%) of Q fever; positive herds can be distributed heterogeneously in space, thus potentially leading to spatially varying exposure levels for the public (Kim et al. 2005, Pearson et al. 2014, Bauer et al. 2015). In addition, the commercialization of unpasteurized milk in many states in the United States represents an additional public health concern because Q fever has been occasionally linked with consumption of untreated milk or dairy products, and C. burnetii DNA has been found in high proportion of untreated milk samples (Fishbein and Raoult 1992, Loftis et al. 2010).
Investigation of spatiotemporal patterns of human Q fever cases may help to detect areas and time periods of higher risk for the general population, which could in turn lead to the recognition of potential risk factors associated with the disease. In this study, we analyzed data on Q fever incidence in Minnesota, a state located in the West North Central region of the United States (region with a higher reported incidence of Q fever than the rest of the country). Surveillance data on Q fever over a 19-year period were used to (1) detect spatiotemporal clusters of higher Q fever incidence, (2) characterize the spatially varying distribution of Q fever risk across the state, and (3) assess the association between Q fever risk and livestock density in the state. Results presented here can help to explain the epidemiological dynamics and, ultimately, help in the design and implementation of control and prevention measures for this emerging zoonotic disease in Minnesota and the United States.
Methods
Data collection
Cases of Q fever in humans are reportable to the Minnesota Department of Health (MDH) under Minnesota's Communicable Disease Rule. MDH conducts passive, population-based surveillance for Q fever cases in Minnesota; cases were classified as probable or confirmed according to the Council of State and Territorial Epidemiologists case definition (
The Minnesota Board of Animal Health provided data on total number of cattle, sheep, and goat herds per county per year for the period 2006–2013 and 2015. No information for 2014 was available; therefore, the estimated number of herds for the three species in this year was interpolated from the data obtained for 2013 and 2015. Additional information on the number of herds present is presented in Supplementary Table S1.
Cluster analysis
The existence of spatiotemporal clusters with higher risk of human Q fever in 1997–2015 was first assessed using scan statistics in conjunction with Poisson and permutation models (Kulldorff 1997) using the centroid of the postcode areas to define the point location of each of them. For the Poisson space–time scan statistic, the observed number of Q fever cases falling in a very large number of cylindrical windows with varying radius and height that span the study region (by varying the location and radius) and time period (by varying the height) was assumed to follow a Poisson distribution and be proportional to the person-years in each window; the observed values were compared with the number of cases that would be expected under the null hypothesis of complete spatial randomness (Kulldorff 1997). The permutation model used data aggregated by zip code to compare the observed number of cases to the number of cases expected if they were randomly distributed in space and time (Kulldorff et al. 2005). For both models, the expected number of cases within spatiotemporal windows was generated using 999 Monte Carlo simulations, in which the observed number of cases in each county per year (Poisson) or the time label (permutation) was randomly assigned to each location. A significance test was performed for each potential cluster using simulation-based p values formed from ranking likelihood ratios to determine the statistical significance against the null hypothesis of spatiotemporal randomness, with adjustments made for multiple comparisons (Kulldorff 1997, Kulldorff et al. 2005). The maximum window size allowed for including up to 50% of the population at risk or total cases observed. Month was used as the time unit. Analyses were performed using SaTScan (Kulldorff and Information Management Services 2009) via the rsatscan package (Kleinman 2015) on R 3.2.0 software (R Core Team 2014).
Spatiotemporal modeling
The association between the annual number of reported Q fever cases in each county and the available covariates from 2006 to 2015 was assessed using a Bayesian mixed-effects Poisson regression model. The Poisson model provides a valid approximation to the binomial because Q fever was a rare disease during this time period in Minnesota. The observed number of cases in county i during year j
where Si
and Ui
denote county-level spatially structured and unstructured random effects, respectively (Besag et al. 1991), x
ij
denotes the vector of covariates for county i at year j,
The regression coefficients were assigned independent Gaussian priors with mean 0 and variance 10, while the random effects Si
and Ui
were modeled as
where Ø
i
represents a weighted average of the structured random effects for neighboring counties that share a border with county i, and
Models were fit using WinBUGS 1.4 (Lunn et al. 2000) via the R2WinBugs package (Sturtz et al. 2005) from the R 3.2.0 software (R Core Team 2014) using three Monte Carlo Markov Chains with dispersed initial values to visually assess convergence and mixing. Chains were run for 15,000 iterations after discarding the first 2500 burn-in samples to compute posterior estimates for all parameters, and autocorrelation was eliminated by collecting 1 in 10 consecutive samples. Convergence was further assessed using the Gelman–Rubin statistics (Gelman and Rubin 1992, Brooks and Gelman 1998). Model selection was performed using the Deviance Information Criterion (DIC) (Spiegelhalter et al. 2002). Variability of the Si and Ui terms was compared using the standard deviations of the posterior distributions, and model fit to the data was checked by comparing replicated datasets, generated from posterior predictive distributions, with the observed data as previously described (Gelman and Hill 2007).
Results
Descriptive and clustering analysis
Thirty-three Q fever cases (12 probable and 21 confirmed) were reported to the MDH between January 1, 1997 and December 31, 2015, with a median of two cases reported each year (range = 0–6) (Fig. 1). Cases were reported from 22 (25%) of the 87 counties in Minnesota, with the number of cases per county ranging from one to four cases annually (Fig. 2). Median age of cases was 56 years (range = 11–95) and 27 of the 33 (82%) were men. Thirty (91%) of the 33 cases were diagnosed as acute and the remaining 3 as chronic. An animal exposure was identified as the most likely source of infection for 19 cases (58%), 4 cases (12%) were likely exposed by a tick bite, and 1 case (3%) was likely exposed through consumption of unpasteurized cow's milk; a likely exposure source could not be determined in 9 (27%) cases. Twelve (63%) of the 19 Q fever cases with an animal exposure had direct contact with an animal: four had contact with goats, three had contact with cattle, two had contact with sheep, and one had contact with both cattle and sheep. Four (21%) cases with animal exposure were likely exposed by windborne transmission from cattle and/or sheep. In two cases with animal contact, the species of animal was unknown.

Number of Q fever cases reported in Minnesota, 1997–2015 (bars indicate annual number of notifications and the line indicates cumulative number of cases).

Location of reported Q fever cases occurring in Minnesota, 1997–2015 (n = 33). The large transparent circle indicates a significant (p < 0.001) high-risk cluster detected using the Poisson model of the Scan Statistics from March 2006 to March 2008.
The incidence rate of Q fever in Minnesota for the period 1997 to 2015 was 0.34 cases per MPY, with yearly incidence rates ranging between 0.0 and 1.15 (maximum reached in 2007). At the county level, a larger variation in incidence rates was observed, with values ranging between 0.0 and 14.8 cases per MPY; however, only 14 counties had incidence rates above 1 case per MPY (Fig. 3).

Observed Q fever incidence rates (cases per million person-year) per county, Minnesota, 1997–2015.
Using the Poisson model, the scan statistics detected one significant (p < 0.001) spatiotemporal cluster of cases located in the southwest corner of Minnesota (Fig. 2) with a radius of 77 km, occurring between March 2006 and March 2008, in which 7 cases were observed while only 0.09 were expected (observed-to-expected ratio = 77.2). No significant spatiotemporal clusters were identified using the permutation model. No differences in the results were obtained when analyses were implemented analyzing only acute cases.
Spatiotemporal modeling
The selected model included only the standardized number of sheep flocks at the county level as a covariate, which was found to be positively associated with an increased risk of Q fever (POPRsheep = 0.98) (Table 1). When the county-level raw or standardized number of cattle herds or goat flocks were considered, no association with the annual incidence of Q fever was observed (POPRcattle = 0.69 and POPRgoat = 0.79), with 95% PPIs largely including 0 (Table 1).
Included in final model.
PPI, posterior probability interval; SD, standard deviation.
Estimated median values for the county-year relative risk for Q fever from the selected regression model ranged from 0.07 to 24.8. There were 65 counties with estimated posterior median relative risks <1 for all of 2006–2015, while 10 counties had relative risks >1 for 1–9 years during the study time period, and 12 counties had relative risks >1 for all 10 years (Fig. 4). Maximum overall median posterior relative risks of 10.3, 12.0, and 18.9 (indicating county-specific risks 10, 12, and 19 times higher than what was observed for the state throughout the study period) were found for three counties located in southeast Minnesota (Jackson, Murray, and Yellow Medicine).
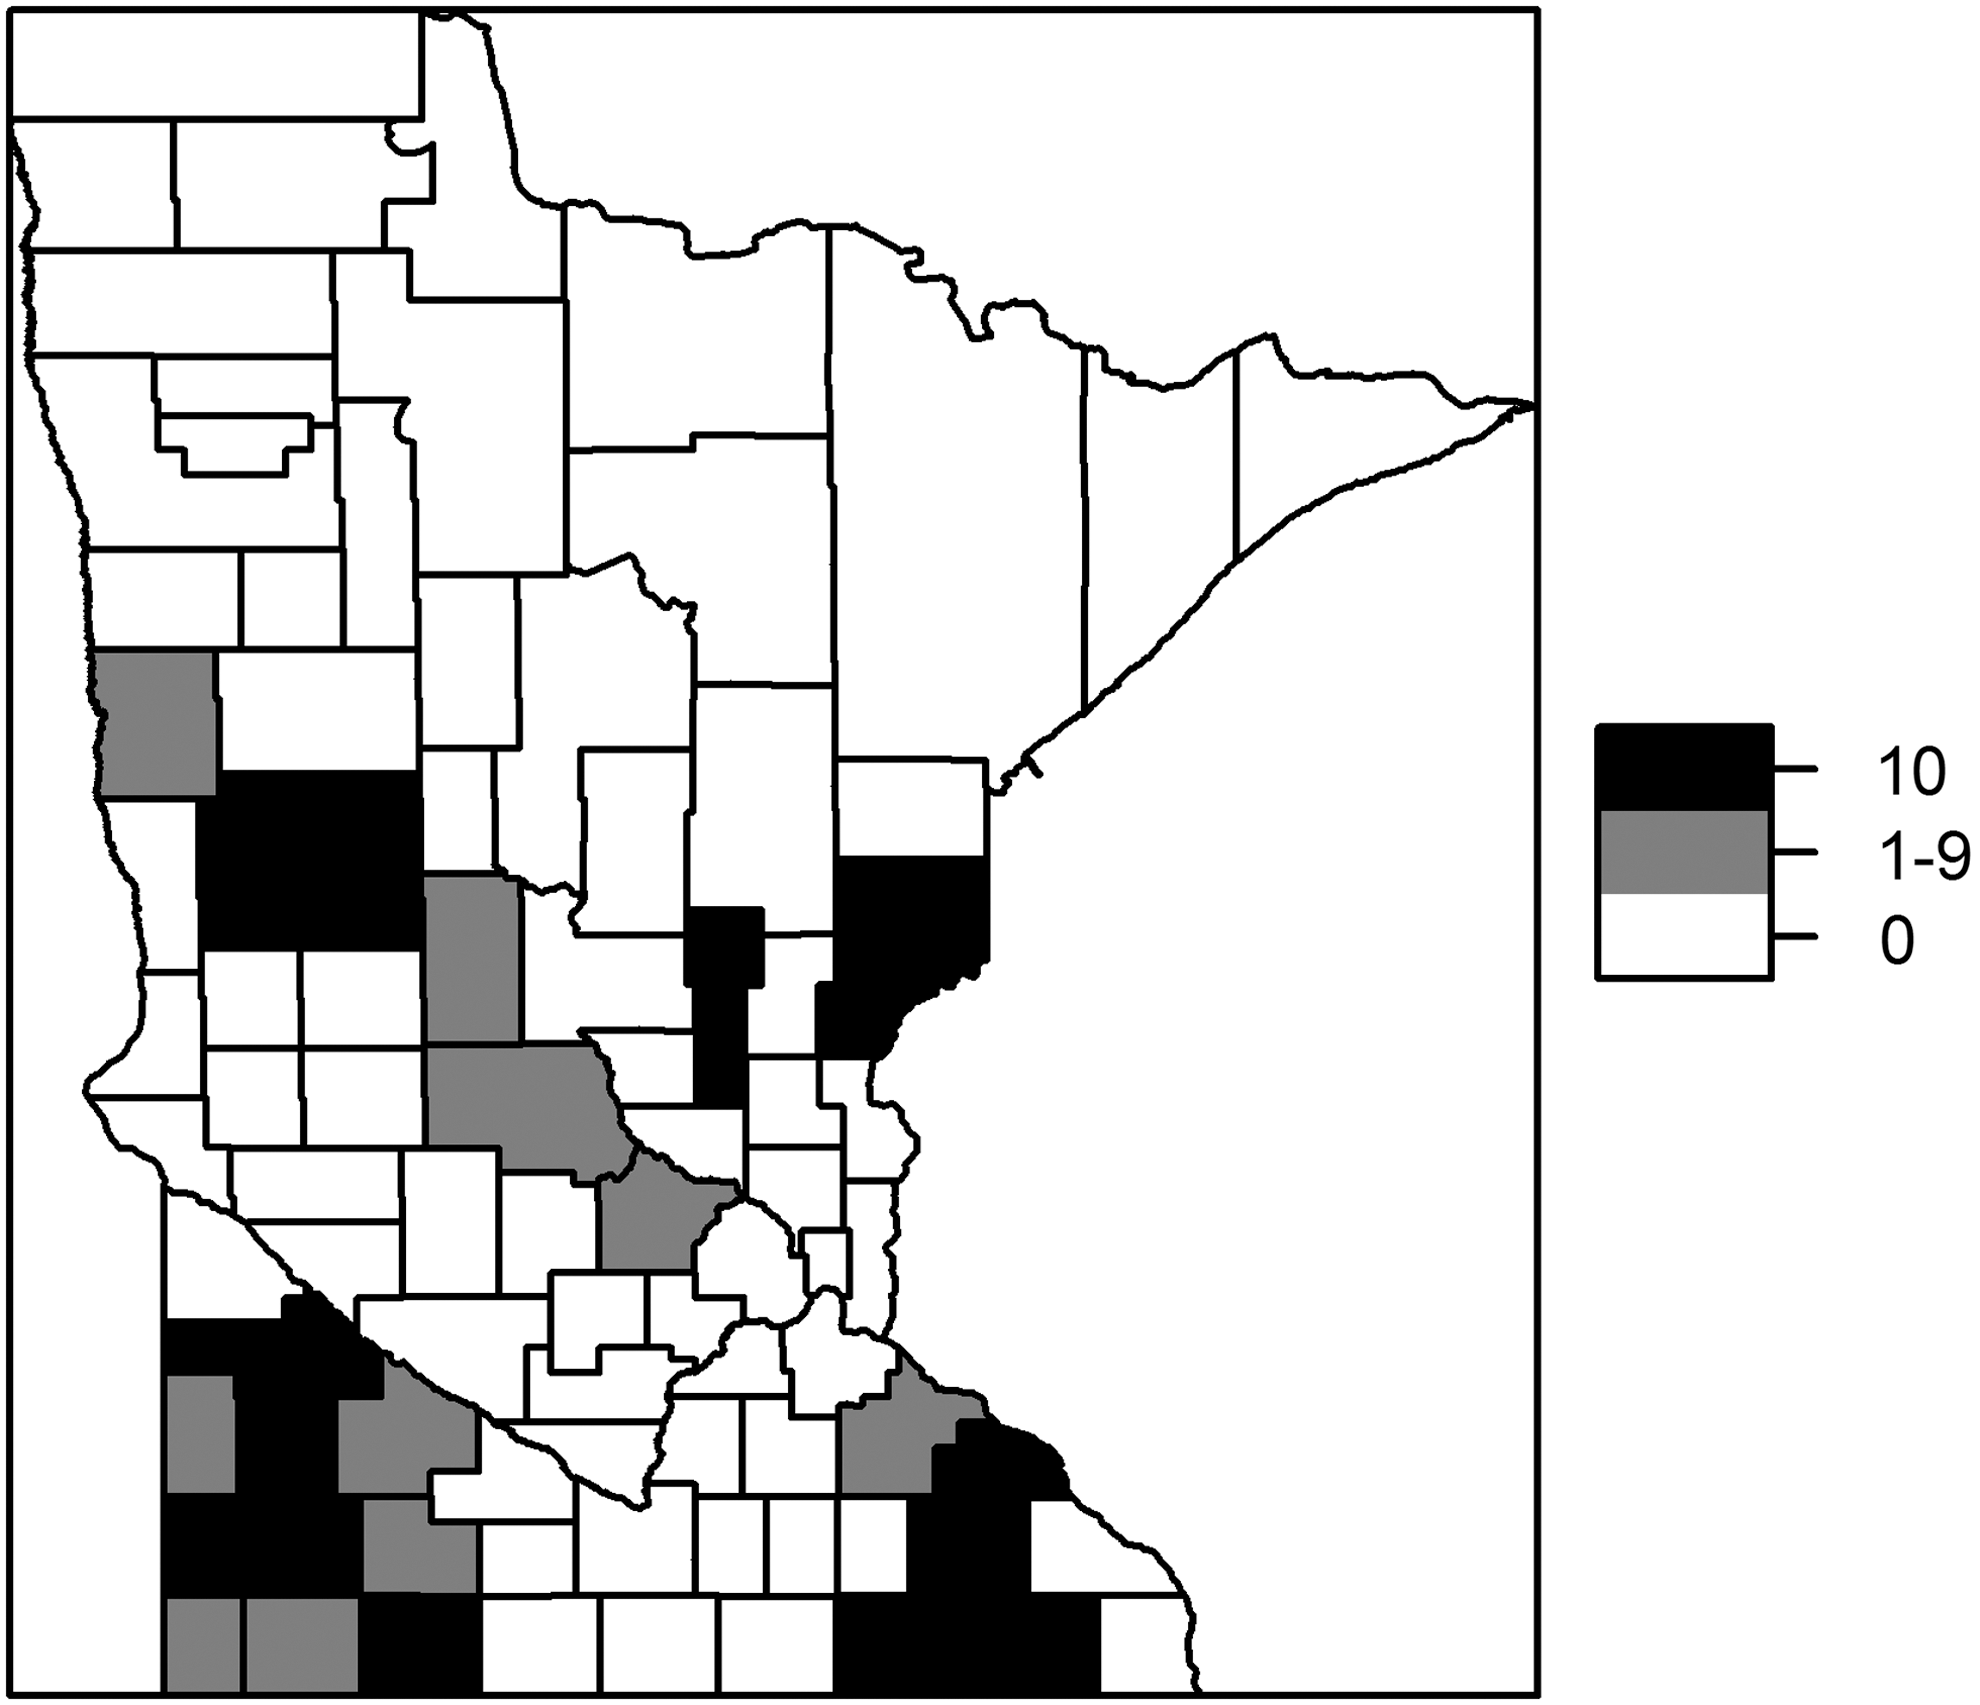
Number of years with county risk >1, 2006–2015.
Median posterior values estimated for the spatially structured random effect (the Si 's), that estimates the effect of variables not included in the model that had a spatial structure, were similar to those found for the nonspatially structured Ui term (mean = 0.03 and 0.07 and standard deviation = 0.26 and 0.47 for Si and Ui , respectively) (Table 1). The distribution of exp(Si ) revealed increased relative risks due to this spatially structured random effects on the south and south-west regions of the state, while no clear spatial pattern in the distribution of exp(Ui ) values was observed (as expected) (Fig. 5).

Structured (Si 's, top) and unstructured (Ui 's, bottom) exponentiated random effects at the county level included in the final Poisson model.
The Poisson regression model was preferred over the negative-binomial and zero-inflated Poisson models based on DIC and convergence diagnostics. The Gelman–Rubin diagnostic indicated convergence (
Discussion
This 19-year cumulative summary supports initial efforts to improve awareness, education and outreach on Q fever to healthcare providers and the public. Key findings from this study include identifying differences in the spatial distribution of Q fever cases and the significant increase in relative risk associated with sheep populations versus cattle or goat herds in Minnesota. Q fever is an underdiagnosed disease with reported seroprevalence levels of 3.1% and 13.3% among samples collected from the general population and agricultural workforce respectively (Anderson et al. 2009, Walsh 2012). Due to its nonspecific clinical presentation, Q fever is typically diagnosed in the context of human outbreaks involving (typically) several cases clustered in space and time. When these Q fever outbreaks are detected, awareness increases surveillance and reporting efforts needed to identify the likely common sources of infection (Anderson et al. 2015, Biggs et al. 2016). The few reported (0–6 cases per year) cases of Q fever in Minnesota limits our epidemiological understanding of contributing factors in the state. Of the 33 cases reported in Minnesota, more than half (19/33) indicated animal exposure as a potential source of infection, similar to the Q fever cases reported to CDC between 2000 and 2012 (Dahlgren et al. 2015a). However, direct contact with animals may not be required for infection, as evidenced by reports of windborne transmission from contaminated materials (Tissot-Dupont et al. 1999, 2004, Nusinovici et al. 2015, Pandit et al. 2016). Therefore, this study investigated the potential association between risk of Q fever infection and livestock population.
One key finding was the difference in the spatial distribution of Q fever cases in Minnesota observed after adjusting for the population at risk, with a relatively high number of cases reported in certain counties despite lower population sizes (Fig. 3). These results agree with a spatiotemporal cluster analysis that identified a cluster with higher incidence in southwest Minnesota with an observed-to-expected ratio of 77 during March 2006 to March 2008 (Fig. 2).
Sheep were the only species among those considered as being associated with an increased risk of C. burnetii infection at the county level in our study. Sheep are most often associated with human outbreaks (Roest et al. 2013), although the recent Q fever outbreak in the Netherlands was largely due to goats (van der Hoek et al. 2012). This shift in recognition of the importance of goats as a source of human Q fever outbreaks was reflected in a recent risk analysis performed by the U.S. Department of Agriculture (2012), which was focused on factors that could initiate or propagate a Q fever epidemic in the goat population. Still, sheep infections are the most cited source of exposure for sporadic cases, as has been described in several states in the United States (McQuiston and Childs 2002, Loftis et al. 2012), and sheep have been a source of Q fever outbreaks (Rauch et al. 1987).
Although a high individual and herd-level prevalence of Q fever has been detected in U.S. cattle, particularly in dairies (with reports describing ∼40–90% PCR-positive samples in cattle bulk tank, raw, and commercial pasteurized milk samples) (Kim et al. 2005, Loftis et al. 2010, Pearson et al. 2014, Bauer et al. 2015), our study found no statistical evidence of an association between the number of cattle herds and human incidence of Q fever in Minnesota between 1997 and 2015. Interestingly, the predominant sequence type found in U.S. cattle, ST20 (Pearson et al. 2014, Kersh et al. 2016), has not been associated with human disease in the country; this could be attributed to a lower infectivity of this ST20 in humans and/or reduced human exposure from cattle due to less frequent or intense shedding from infected cattle in comparison to infected small ruminants (Rodolakis 2009). Because of the low number of genotyped human strains, caution should be exercised in the interpretation of these preliminary findings (Kersh et al. 2016).
In addition, our analyses did not find an association between the number or density of goat flocks at the county level and an increased risk for human infections in Minnesota, despite other evidence globally (Schimmer et al. 2010). This lack of association could be related to a lower level of C. burnetii infection in the goat reservoir and/or reproductive management practices that could decrease the risk of spread to surrounding goat farms (Schimmer et al. 2011). It could also be due to the lower number of goat flocks compared with sheep flocks in Minnesota counties. However, an increase in the number of goat flocks present in the state (increasing from <1000 in 2006 to >3000 in 2015) suggests that if C. burnetii is circulating in small ruminants in the state, goats could play a role in future disease transmission events.
Limitations of our study include the lack of information on additional factors likely associated with infection in humans (e.g., distance to farms and climatological variables) and any unrecognized biases in the passive reporting system. Still, if we assume that any underreporting associated with this passive surveillance system was relatively homogeneous within Minnesota and throughout the study period, our findings may be representative of the overall epidemiology of Q fever in the state, even if only a fraction of the infections occurring (often the most severe) were actually reported (Dahlgren et al. 2015a). The increased spatially structured risk observed in the southeast and southwest areas of the state (Figs. 4 and 5) may indicate additional risk factors that are not directly related with livestock presence/density and that had a spatial component. Additional spatial and temporal distribution of Q fever cases in the neighboring states (South Dakota, Iowa, and Wisconsin) would help support these preliminary relationships and should be assessed.
Even though infection status on the livestock species considered was not known, our results are in agreement with a previous study that demonstrated that increased incidence of Q fever in humans was associated with sheep densities in France (Tissot-Dupont et al. 1999). To further characterize and support this hypothesis, the prevalence of C. burnetii infection in sheep in Minnesota is needed. This would confirm the potential role of sheep as a source of human infection and could be conducted through population surveys or a focus on active infections or disease (i.e., clinical signs) through veterinary diagnostic laboratories. The challenge is that active surveillance to detect infection in sheep is often impaired by the lack of correlation between the level of infection and poor reproductive outcomes, as recently described in sheep flocks in Wyoming, in which seroprevalence ranged from 7% to 12.5% without noticeable effect on reproduction performance (Loftis et al. 2012). In addition, further work is needed to characterize pathogenicity and sequence type data. Likely, Q fever is underappreciated as a disease-causing organism in both human and animal populations.
Footnotes
Acknowledgments
This study was partially supported by the Academic Health Center Faculty Research Development Grant Program (FRD no. 16.36). Authors are grateful to Dr. Stacey Schwabenlander for providing information on the livestock population in Minnesota.
Author Disclosure Statement
No competing financial interests exist.
References
Supplementary Material
Please find the following supplemental material available below.
For Open Access articles published under a Creative Commons License, all supplemental material carries the same license as the article it is associated with.
For non-Open Access articles published, all supplemental material carries a non-exclusive license, and permission requests for re-use of supplemental material or any part of supplemental material shall be sent directly to the copyright owner as specified in the copyright notice associated with the article.