
Abstract
Flea-borne diseases (FBDs) impact both human and animal health worldwide. Because adult fleas are obligately hematophagous and can harbor potential pathogens, fleas act as ectoparasites of vertebrates, as well as zoonotic disease vectors. Cat fleas (Ctenocephalides felis) are important vectors of two zoonotic bacterial genera listed as priority pathogens by the National Institute of Allergy and Infectious Diseases (NIAID-USA): Bartonella spp. and Rickettsia spp., causative agents of bartonelloses and rickettsioses, respectively. In this study, we introduce the first microbiome analysis of C. felis samples from California, determining the presence and abundance of relevant pathogenic genera by characterizing the cat flea microbiome through 16S rRNA next-generation sequencing (16S-NGS). Samples from both northern (NoCal) and southern (SoCal) California were assessed to expand current knowledge regarding FBDs in the state. We identified Rickettsia and Bartonella, as well as the endosymbiont Wolbachia, as the most abundant genera, followed by less abundant taxa. In comparison to our previous study screening Californian cat fleas for rickettsiae using PCR/digestion/sequencing of the ompB gene, the 16S-NGS approach applied herein showed a 95% level of agreement in detecting Rickettsia spp. There was no overall difference in microbiome diversity between NoCal and SoCal samples. Bacterial taxa identified by 16S-NGS in this study may help to improve epidemiological investigations, pathogen surveillance efforts, and clinical diagnostics of FBDs in California and elsewhere.
Introduction
F
The cat flea (Ctenocephalides felis) has a worldwide distribution and is ubiquitous in California. This flea is a competent vector of several zoonotic pathogens, including two bacteria listed as priority pathogens by the National Institute of Allergy and Infectious Diseases (NIAID-USA): Rickettsia spp. (NIAID categories B/C) and Bartonella henselae (NIAID Additional Emerging Infectious Diseases List) (National Institute Allergy and Infectious Diseases 2016) (Bitam et al. 2010, Brown and Macaluso 2016). Cat fleas may harbor at least four species of Bartonella (B. henselae, B. clarridgeiae, B. quintana, and B. koehlerae) that are known etiologic agents of human infections manifested as cat-scratch disease, bacillary angiomatosis, bacteremia, and endocarditis, among others (Foucault et al. 2002, Rolain et al. 2003, Bitam et al. 2010).
C. felis appears to serve as both vector and reservoir of Rickettsia felis, the suspected causative agent of flea-borne spotted fever, and R. felis-like organisms (RFLOs), although no clinical disease has been associated with RFLOs to date (Brown and Macaluso 2016). C. felis may also play a significant role in the transmission of Rickettsia typhi, the etiologic agent of flea-borne or murine typhus (Adams et al. 1970, Civen and Ngo 2008). Due to the fact that infection with most Rickettsia spp. cannot be distinguished clinically or by serological methods, the term “flea-borne rickettsioses” (FBRs) has been recommended (Billeter et al. 2016, Billeter and Metzger 2017).
Most cases of FBRs in the United States are reported from Hawaii, Texas, and California (Centers for Disease Control and Prevention 2017). Specifically, over 90% of FBR cases in California are reported from southern California (SoCal). Presence of both R. typhi and R. felis was previously confirmed in C. felis from SoCal by two independent research groups (Williams et al. 1992, Eremeeva et al. 2012).
Eremeeva et al. (2012) demonstrated that C. felis is generally infected with R. felis at a much higher prevalence than R. typhi: in 1873 cat flea pools were collected from cats, roof rats, and opossums trapped near households of human FBR cases in SoCal, and R. felis was detected in 47.1% of flea pools compared to only 1.3% infected with R. typhi. Moreover, in our recent study targeting the outer membrane protein B (ompB) gene as the rickettsial genotyping source, we detected R. felis and/or RFLO genotypes in cat flea pools collected from cats from southern and northern California (NoCal) (Billeter et al. 2016). Therefore, a comprehensive assessment of microorganisms present in cat fleas in California is required to establish whether potentially novel pathogen(s) may play a role in the unique epidemiology of FBR in this state.
Next-generation sequencing (NGS) allows for a wide-ranging unbiased evaluation of bacterial diversity by generating millions of individual DNA sequence reads from a single sample (e.g., flea) and, thus, represents an important new approach for the study of FBRs and FBDs in general. Such approach has already been independently applied on flea populations from both Africa (Jones et al. 2015) and Australia (Lawrence et al. 2015).
In this study, we determined the presence and relative abundance of pathogens in fleas from California by characterizing flea microbiomes with 16S rRNA next-generation sequencing (16S-NGS). C. felis from both FBR-endemic (SoCal) and nonendemic (NoCal) regions was assessed to help expand current understanding of factors associated with the incidence of FBD.
Recently, investigations on arthropod vector microbiomes have revealed that microbial community interactions can impact pathogen transmission due to (1) the role of certain endosymbionts inhibiting the growth and establishment of pathogens and/or (2) the multiplication of pathogens being responsible for a decrease in microbial diversity within the vectors (Moreira et al. 2009, Duguma et al. 2015, Rio et al. 2016, Abraham et al. 2017, Kelly et al. 2017). In this study we present the first report of a large-scale microbiome analysis on C. felis samples from California, where both endosymbiont and known pathogenic genera were detected.
Materials and Methods
Flea samples
Cat fleas were collected from domestic cats in three counties of California and confirmed as C. felis using a dissection microscope and the standard taxonomic key as described in our previous work (Billeter et al. 2016). Collection sites included two animal shelters in Los Angeles County (FBR-endemic region—SoCal) and two trap/neuter/release (TNR) programs in both Sacramento and Contra Costa Counties (FBR-nonendemic region—NoCal).
A subsampling of 64 cat fleas from 21 flea pools collected in our previous study (Billeter et al. 2016) was used for microbiome analysis. Each flea pool was obtained from an individual cat. Nine flea pools were from NoCal, and 12 were from SoCal. Flea pools were selected based on the result of the Rickettsia PCR assay performed in our previous study, number of fleas per pool, DNA yield, and quality. Additional samples from SoCal were included because the R. felis-like genotype 2 was only detected in that region (Billeter et al. 2016).
The number of fleas per pool ranged from 1 to 8, with a median of two fleas per pool. Two samples, one from each geographic group, did not pass the sequence quality control steps established in our computational pipeline (see “Microbiome sequence data analyses” section below), resulting in 8 NoCal and 11 SoCal samples for microbiome analysis. Table 1 illustrates the details of Rickettsia spp. genotypes found in our previous study (Billeter et al. 2016), as well as the geographic location for the 19 cat flea samples assessed herein.
Their geographical locations, as well as harbored pathogens, are depicted in the table.
NGS, next-generation sequencing; NoCal, northern California; SoCaL, southern California.
Genomic DNA extraction, amplification of bacterial 16S rRNA gene, and DNA sequencing
The extraction of the genomic DNA (gDNA) from each flea pool was as previously described (Billeter et al. 2016). A locus comprising the variable regions V4–V5 from the 16S rRNA gene was chosen to be targeted as our PCR amplicon, using primers 519F (5′-CAGCMGCCGCGGTAATWC-3′) and 926R (5′-CCGTCAATTCCTTTRAGGTT-3′). A nested PCR was performed for each one of the 19 flea samples, plus water as negative control (NTC), to double tag the amplicons with both Illumina Nextera adapter sequences and barcodes (A-H forward and 1–12 reverse, see the manufacturer protocol for more details) (Faircloth and Glenn 2012). Following PCR, amplicons were normalized with the Invitrogen SequalPrep Kit, and the library containing the double-tagged amplicons of each sample was submitted for paired-end 300-bp sequencing on the Illumina MiSeq platform.
Microbiome sequence data analyses
The sequence data were initially checked for barcodes with QIIME v1.9 extract_barcodes.py script (Caporaso et al. 2010), then analyzed with the new QIIME2 package of tools (
First, demultiplexing and denoising were done with “qiime demux emp-paired” and “qiime dada2 denoise-paired” commands, respectively. DADA2 is a new open-source tool for modeling and correcting Illumina-sequenced amplicon errors, including detection and removal of chimeras, as well as generating operational taxonomic unit (OTU) tables at a 100% identity level (Callahan et al. 2016).
Second, demultiplexed samples were merged in a single OTU table (biom format) with “qiime feature-table merge.”
Third, phylogenetic analysis was performed for grouping representative sequences (with both “qiime alignment” and “qiime phylogeny” commands) to further load them into diversity metrics.
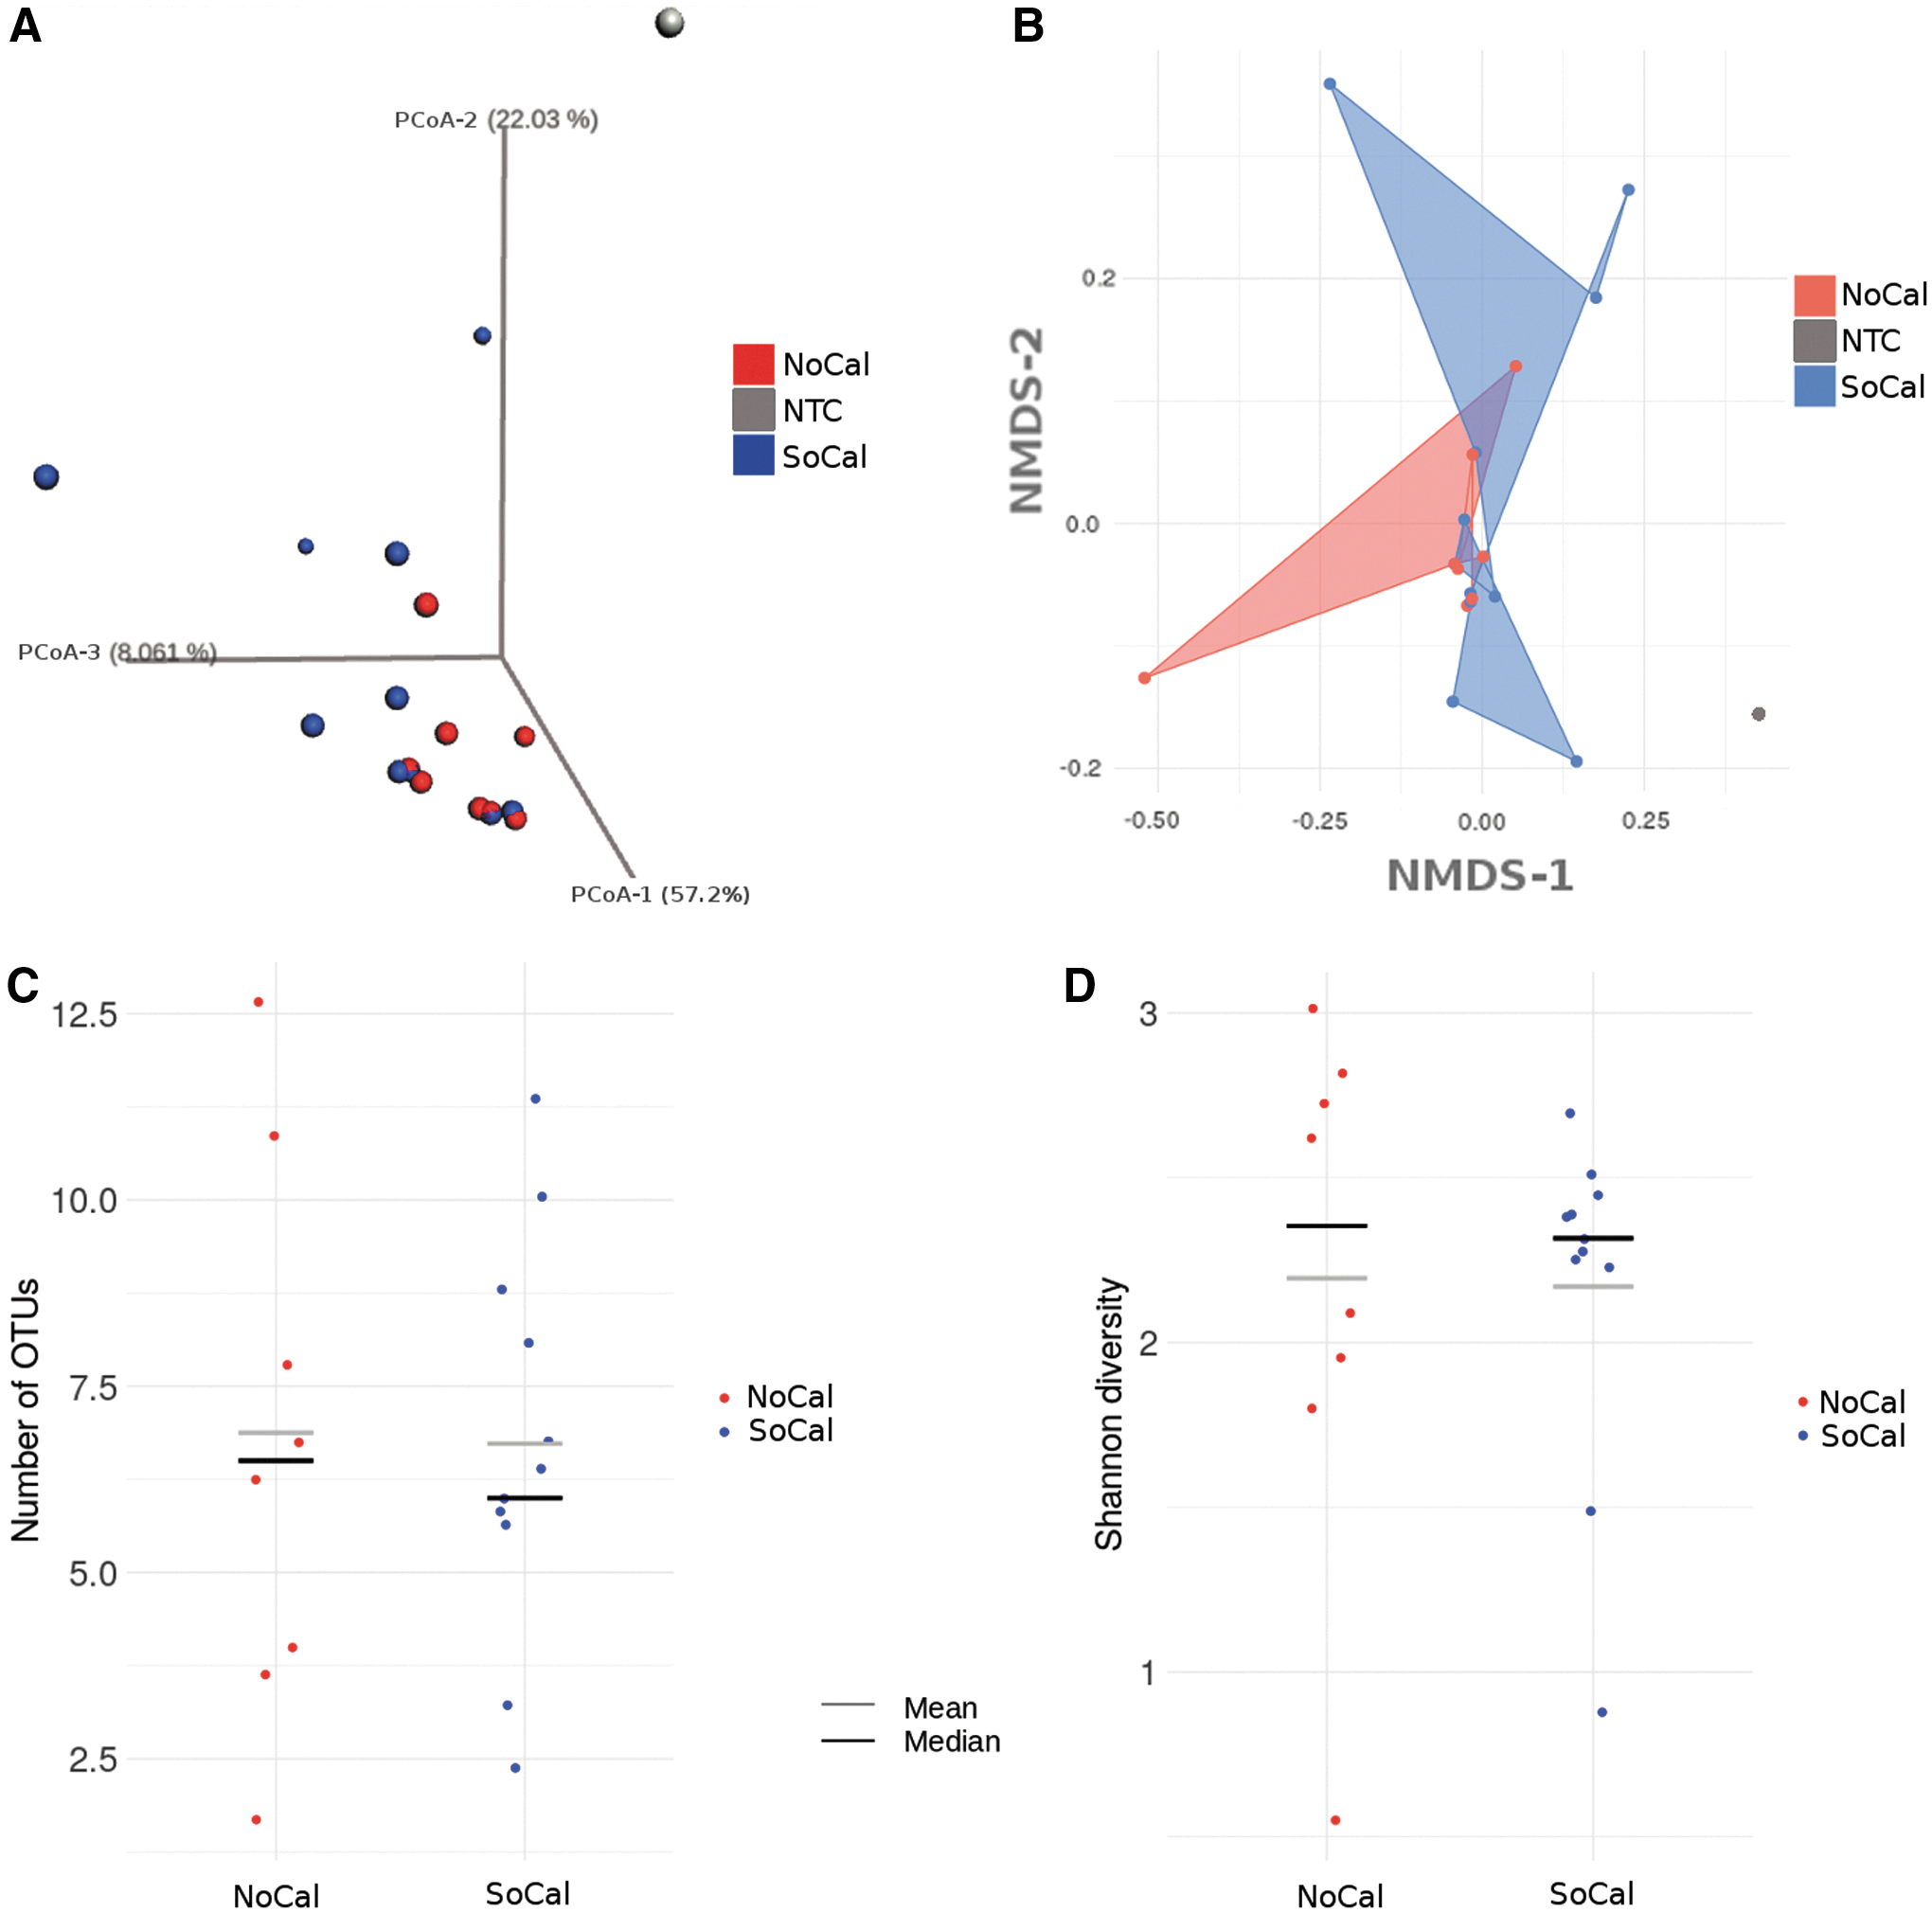
Fourth, diversity analyses were performed with “qiime diversity core-metrics,” “qiime diversity alpha-group-significance,” “qiime diversity beta-group-significance,” and “qiime emperor plot–i-pcoa,” to run several alpha- (e.g., shannon, faith_pd, and chao1) and beta-diversity (e.g., bray_curtis, jaccard, and unweighted and weighted_unifrac) metrics, as well as statistical analyses using the beta-diversity distance matrices (pairwise phylogenetic distances between samples) as inputs for assessing group significance and plotting principal coordinate analysis (PCoA) charts.
UniFrac was used to measure the total amount of evolution unique to each condition/group/environment (Lozupone and Knight 2005). Weighted UniFrac (wUniFrac), which takes into account the OTUs' abundance in each sample, was the main beta-diversity metric used. Finally, taxonomic classification was done using GreenGenes as the reference database (Caporaso 2017) with the “qiime feature-classifier classify-sklearn” command. The whole qiime2 pipeline used herein, as well as in-house PERL scripts that were developed for this study, is available at
Ad-hoc R codes were written for the purposes of (1) plotting charts, such as bar plots, strip chart, and box plots using the ggplot2 library (Wickham 2009), and (2) running statistical analyses like Adonis, from the vegan R package (Oksanen et al. 2017), and Fisher exact test (e.g., in Figs. 1A, B and 3, respectively). The nonmetric multidimensional scaling analysis (or nonparametric PCoA plot, displayed in Fig. 1B) was performed through the phyloseq R package (McMurdie and Holmes 2013). All these analyses were run within the R v3.4.1 environment.
NoCal and SoCal cat fleas showed a highly similar microbiome content as assessed by both alpha- and beta-diversity metrics.
The sequence logos for the nonperfectly conserved positions of both Bartonella sp. and Rickettsia sp. OTUs (depicted in Fig. 4) were generated by the WebLogo tool (
Considering that the computational pipeline was not able to assign species-level taxonomy for the majority of taxa, we ran BlastN (Altschul et al. 1997) using Rickettsia and Bartonella OTU representative sequences as queries against the Integrated Microbial Genomes (IMG,
There are 7 Bartonella OTUs (2 from NoCal and 5 from SoCal) and 18 Rickettsia OTUs (6 from NoCal and 12 from SoCal).
BlastN search performed against nt-NCBI database (also 100% identity and 100% query coverage).
GenBank (Nucleotide) acc. no.
IMG, Integrated Microbial Genomes; OTUs, operational taxonomic units.
Data accessibility
All nucleotide sequence data used herein were deposited at the Sequence Read Archive database (SRA-NCBI) and are publicly available under the following BioProject accession number: PRJNA470550.
Results
Our QIIME2-based ad-hoc computational pipeline identified 131 OTUs for the 20 samples (8 NoCal and 11 SoCal flea samples, plus the NTC) from a total of 202,627 sequenced paired reads (per sample mean = 10,131 and per sample median = 9907). Of these, only one was a singleton (an OTU with just a single sequence), 126 were composed of 5 or more reads, and 113 OTUs contained 10 or more reads (Supplementary Tables S1 and S2; Supplementary Data are available online at
None of the OTUs detected from the negative control matched the OTUs retrieved from cat fleas (Supplementary Table S1), ruling out microbial contamination of flea samples by reagents. In fact, three genera (Flavobacterium, Methylobacterium, and Paenibacillus) plus two families (Chitinophagaceae and Planctomycetaceae) detected in our NTC sample corroborated a previous study where the authors listed the most common contaminants in DNA Isolation Kits (Salter et al. 2014).
Through both parametric and nonparametric PCoA (Ramette 2007, Lozupone and Knight 2008, McMurdie and Holmes 2013) on the wUniFrac distance matrix, we did not find any significant difference between the overall microbiome content of NoCal and SoCal cat fleas (adonis p value >0.1) (Fig. 1A, B). Similar results were also seen with alpha-diversity metrics, such as richness and Shannon diversity (both t-test and Wilcoxon p values >0.1) (Fig. 1C, D). These results suggest that the prokaryotic microbiomes from the C. felis population analyzed in this study contain similar microbial communities.
When sequences were classified taxonomically, we detected a similar overall relative distribution of taxa among samples (Fig. 2). Analysis of composition of microbiomes (Mandal et al. 2015), recently added in the qiime2 package, did not identify any differentially abundant taxa comparing NoCal and SoCal samples at either phylum or genus levels. The proteobacteria phylum was by far the most common encountered (Fig. 2A).
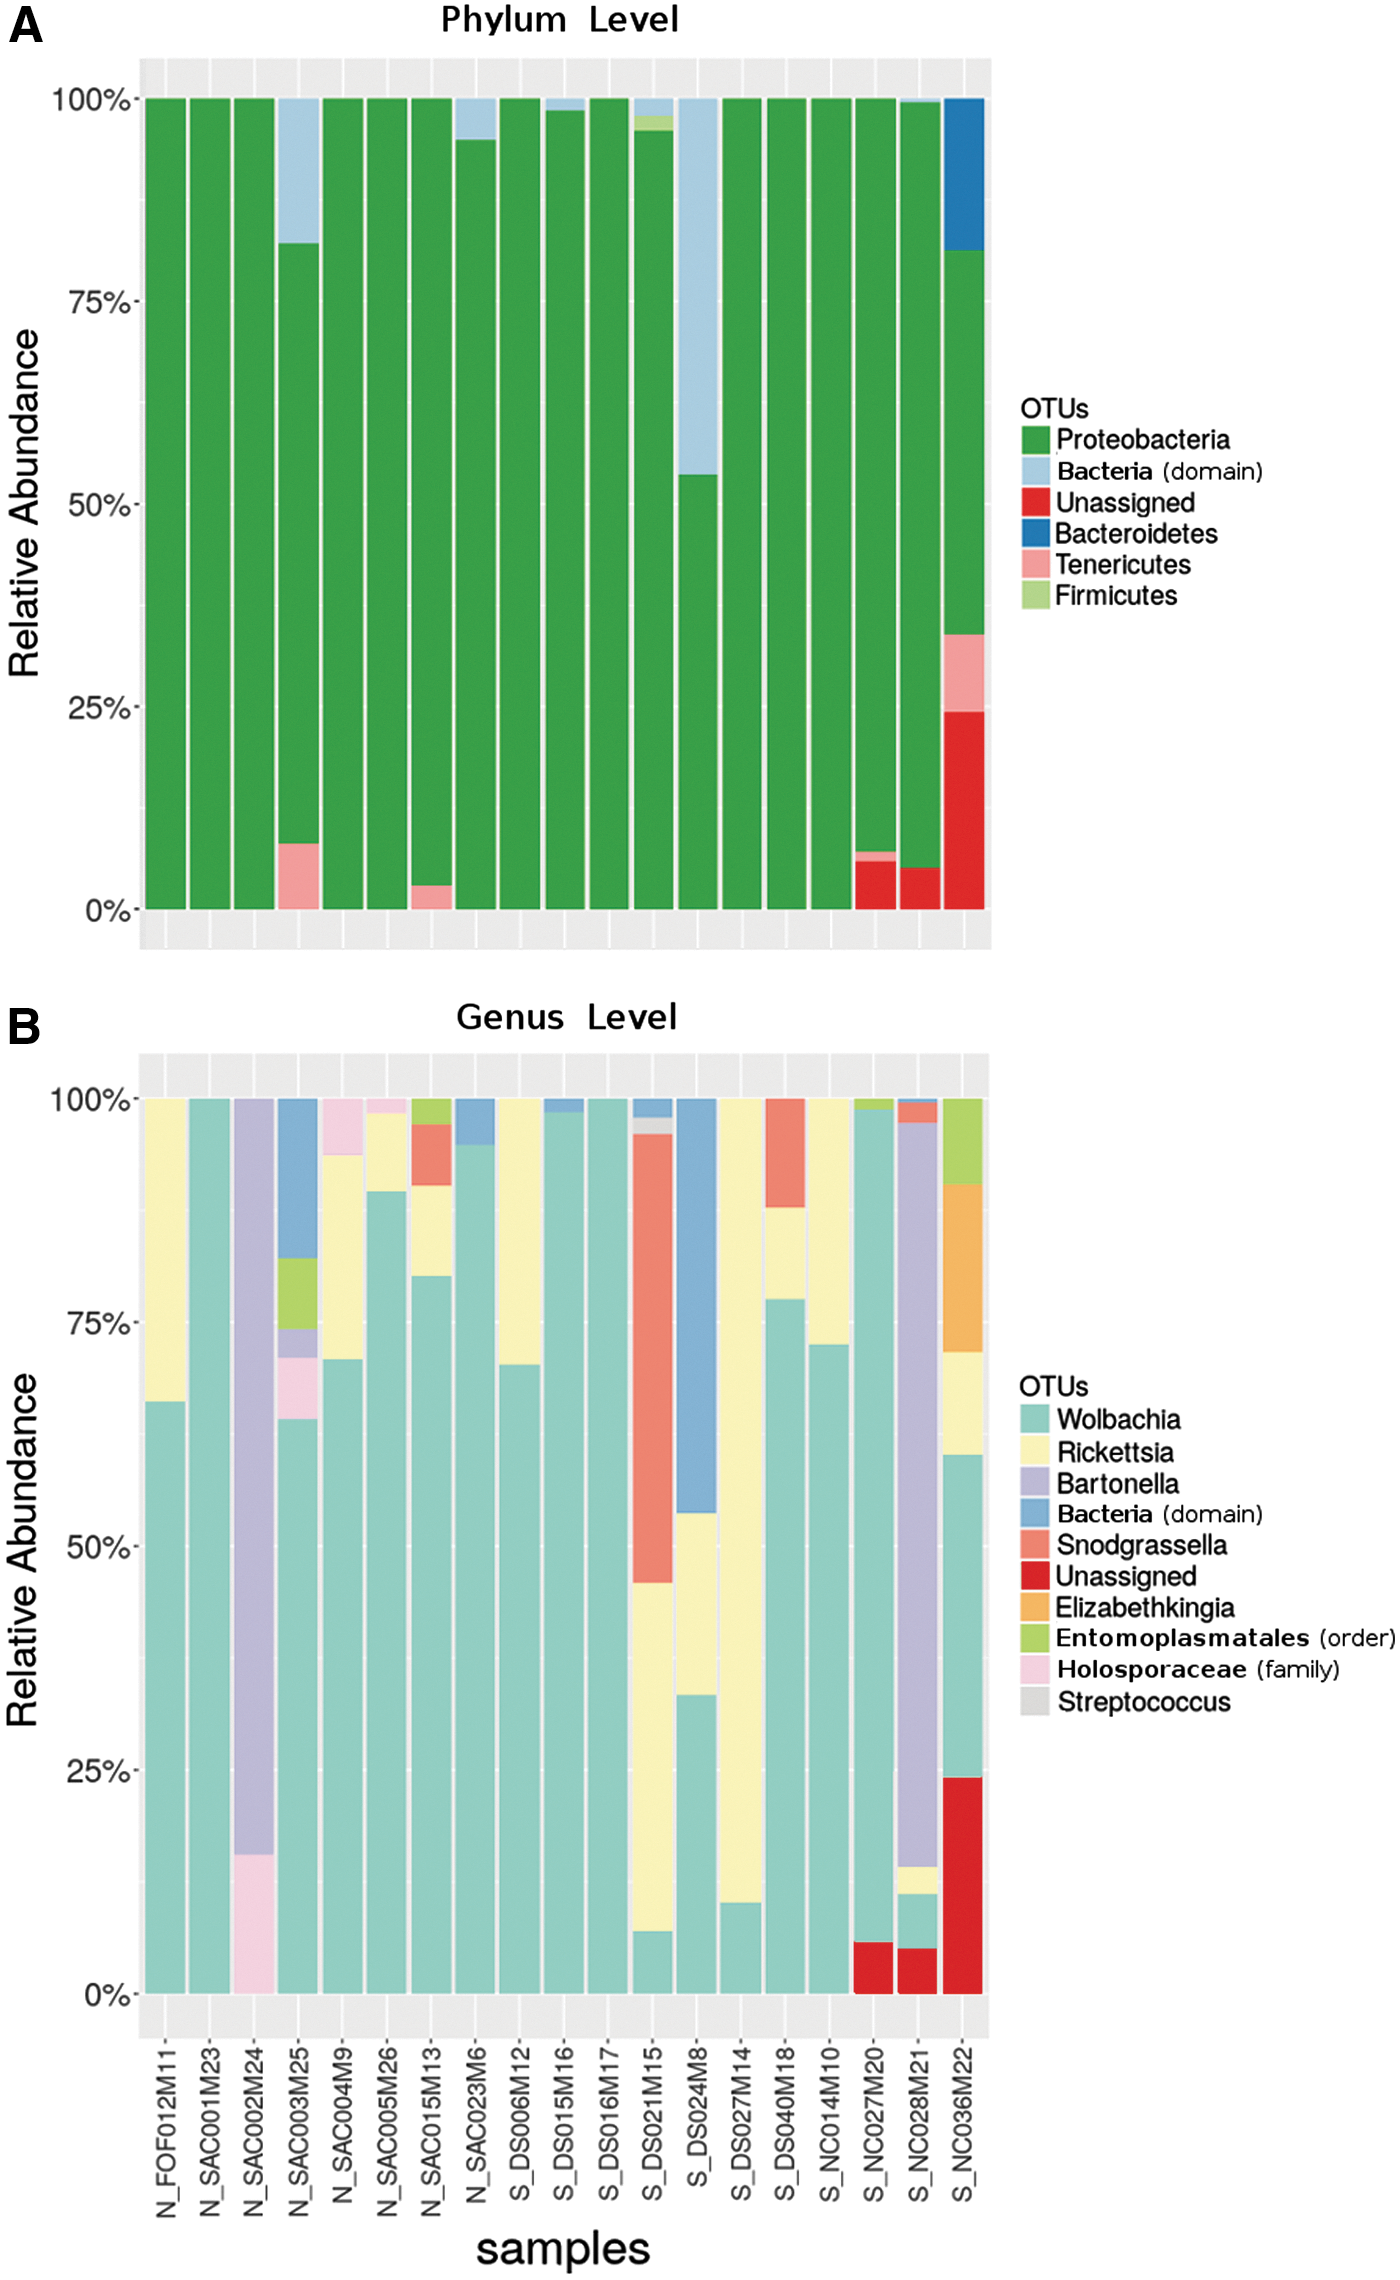
Most abundant bacterial taxa in Californian cat fleas comprised one endosymbiont (Wolbachia) and two flea-borne pathogen genera (Rickettsia and Bartonella). Relative abundance of taxa at both phylum-
For all samples, the three most common genera were Wolbachia (43/131 OTUs), Rickettsia (18/131 OTUs), and Bartonella (7/131 OTUs) (Fig. 2B and Supplementary Table S1 for details on total read counts in each OTU). The second most abundant genus was Rickettsia, found in 12/19 samples and the main focus of our previous study (Billeter et al. 2016). Table 1 depicts the concordance between (1) a single-tube PCR of the ompB gene followed by digestion with specific restriction enzymes for genotyping (Billeter et al. 2016) and (2) a high-throughput 16S-NGS followed by in silico microbiome analysis. Compared to the single-tube PCR, 16S-NGS achieved a 95% (18/19) level of agreement with that gold standard technique for the detection of Rickettsia spp. (Table 1).
Bartonella spp., although present in only 3/19 samples, was the genus with the third most abundant OTU count (Fig. 2B and Table 1). Snodgrassella alvi., from the Neisseriaceae family also found in Australian cat fleas (Lawrence et al. 2015), was the fourth most abundant taxon. This species was first described and taxonomically cataloged in 2013 as a honey bee gut symbiont (Kwong and Moran 2013).
Elizabethkingia meningoseptica (the fifth most abundant taxon) is an opportunistic pathogen very recently reported in the midgut of the Asian malaria vector Anopheles stephensi (Ngwa et al. 2013) and in Culicoides from Australia (Ngwa et al. 2013). Finally, the least abundant taxa from Fig. 2B are Entomoplasmatales (order), Holosporaceae (family), and Streptococcus spp., which were also reported as an uncommon symbiont in Australian cat fleas and/or echidna stickfast fleas (Lawrence et al. 2015). Noteworthy that Streptococcus spp. might also be derived from the flea bloodmeal, once this microbe genus, together with Enterococcus spp., has been reported as the most common genera detected in human blood (Bhattacharyya et al. 2017). However, dog's and cat's blood microbiomes are yet to be scrutinized.
To further assess significant differences in the abundance of specific taxa of interest (TOI) between NoCal and SoCal, we adopted the principles of the metaStats algorithm (White et al. 2009). By building a 2 × 2 contingency table for each taxon from Fig. 2B (row1 = counts for TOI; row2 = counts for all taxa but TOI; column1 = NoCal; column2 = SoCal), we performed a Fisher exact test to check whether the raw abundance (read counts) of a specific TOI would be significantly different between our two groups.
Because the samples analyzed in this study were preselected on the basis of Rickettsia presence (see Materials and Methods section), Rickettsia genus reads were excluded from this analysis. Figure 3 shows that, with the exception of Streptococcus, all taxa analyzed presented a significant p value (<1e-5). Wolbachia, Bartonella, S. alvi, and E. meningoseptica were more abundant in SoCal cat fleas, whereas the order Entomoplasmatales and the family Holosporaceae appeared to have higher abundance in NoCal samples (Fig. 3).
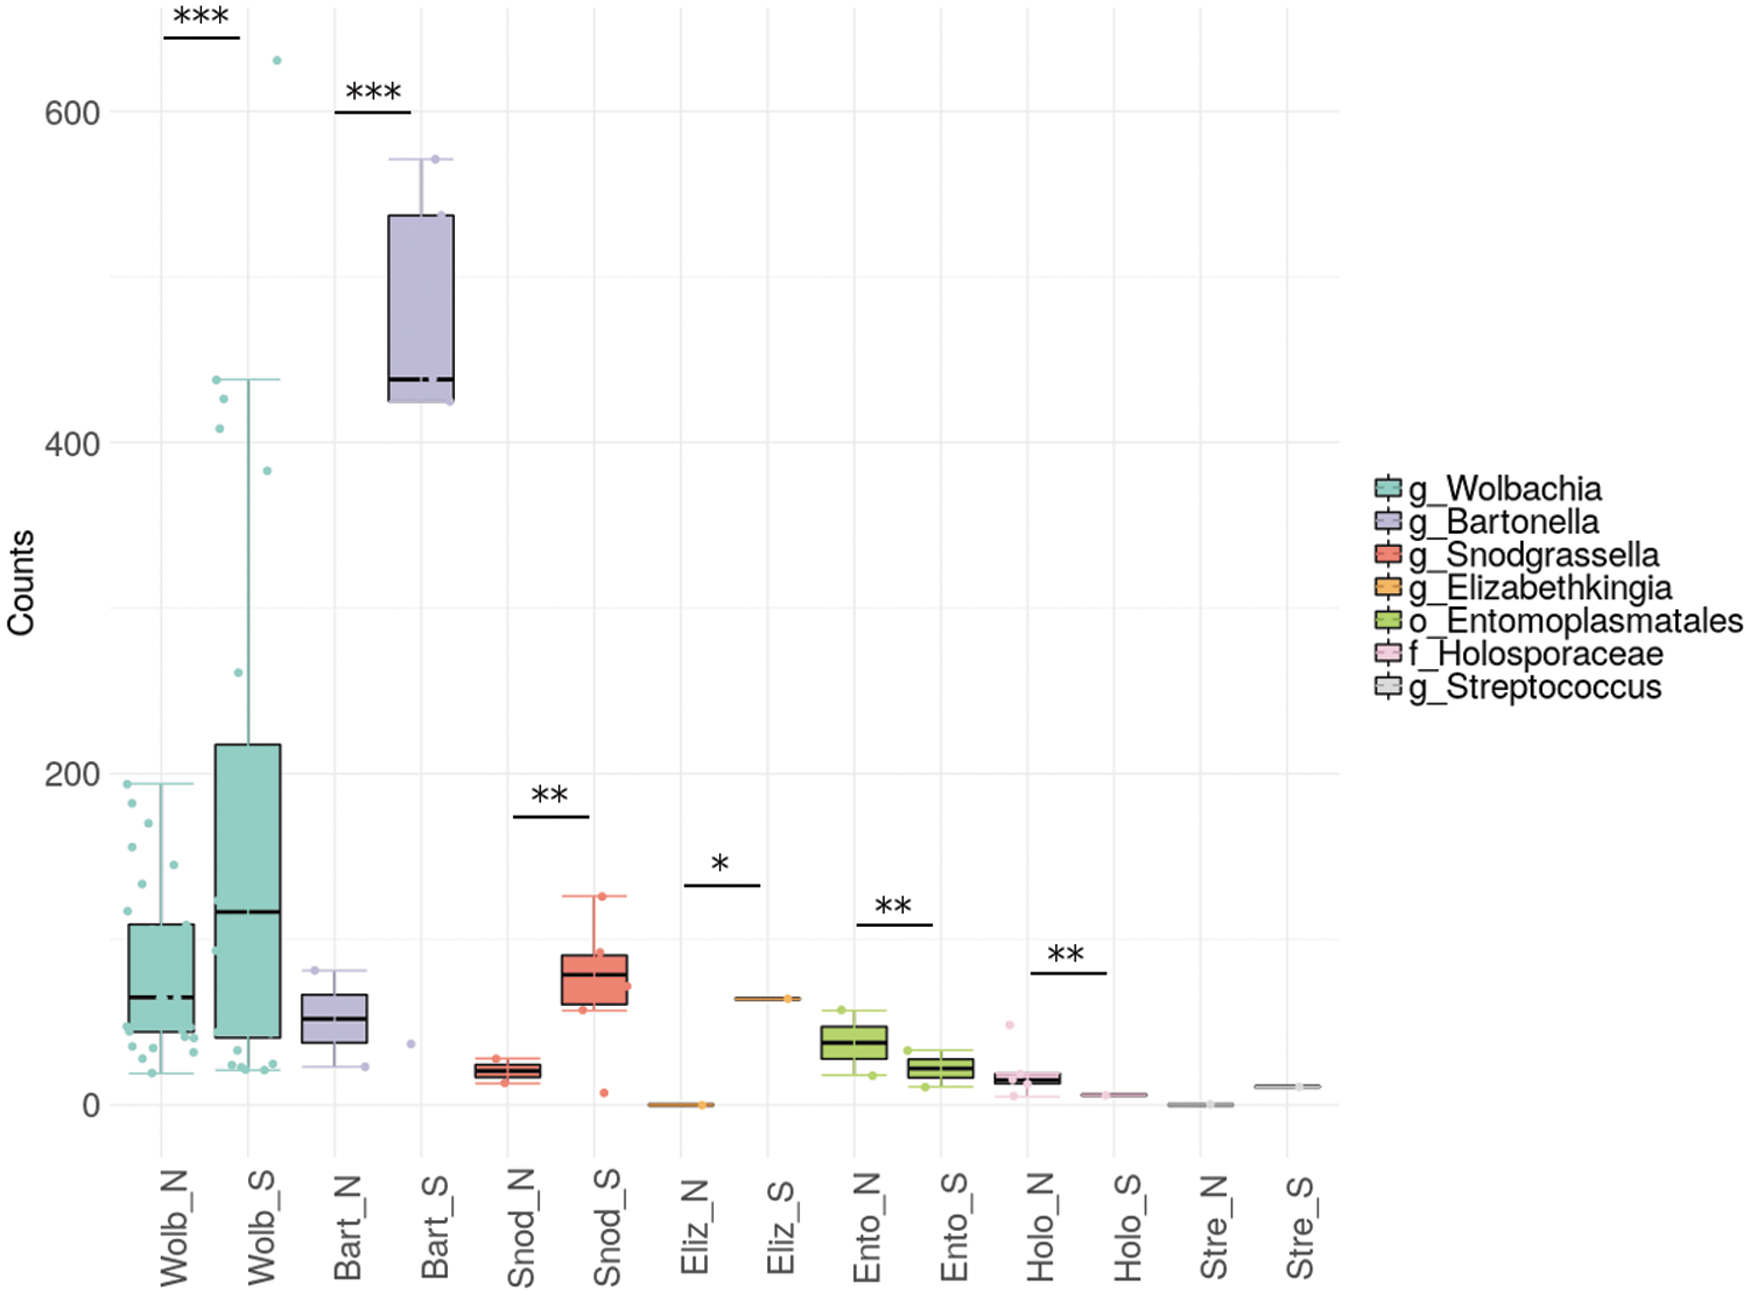
NoCal and SoCal raw read counts from the most abundant taxa depicted on Fig. 2. A boxplot merged to a strip chart, where the dots correspond to individual OTUs, is displayed here. Rickettsia OTUs were not included on this plot because this genus was used as inclusion criteria in sample selection for 16S-NGS. NoCal and SoCal samples are flagged by “_N” and “_S,” respectively, as the last characters of each box description, preceded by the four initial letters of each taxon. Fisher exact test p values less than 1e-100 (***), 1e-10 (**), or 1e-5 (*). Order (o_), family (f_), and genus (g_). NGS, next-generation sequencing.
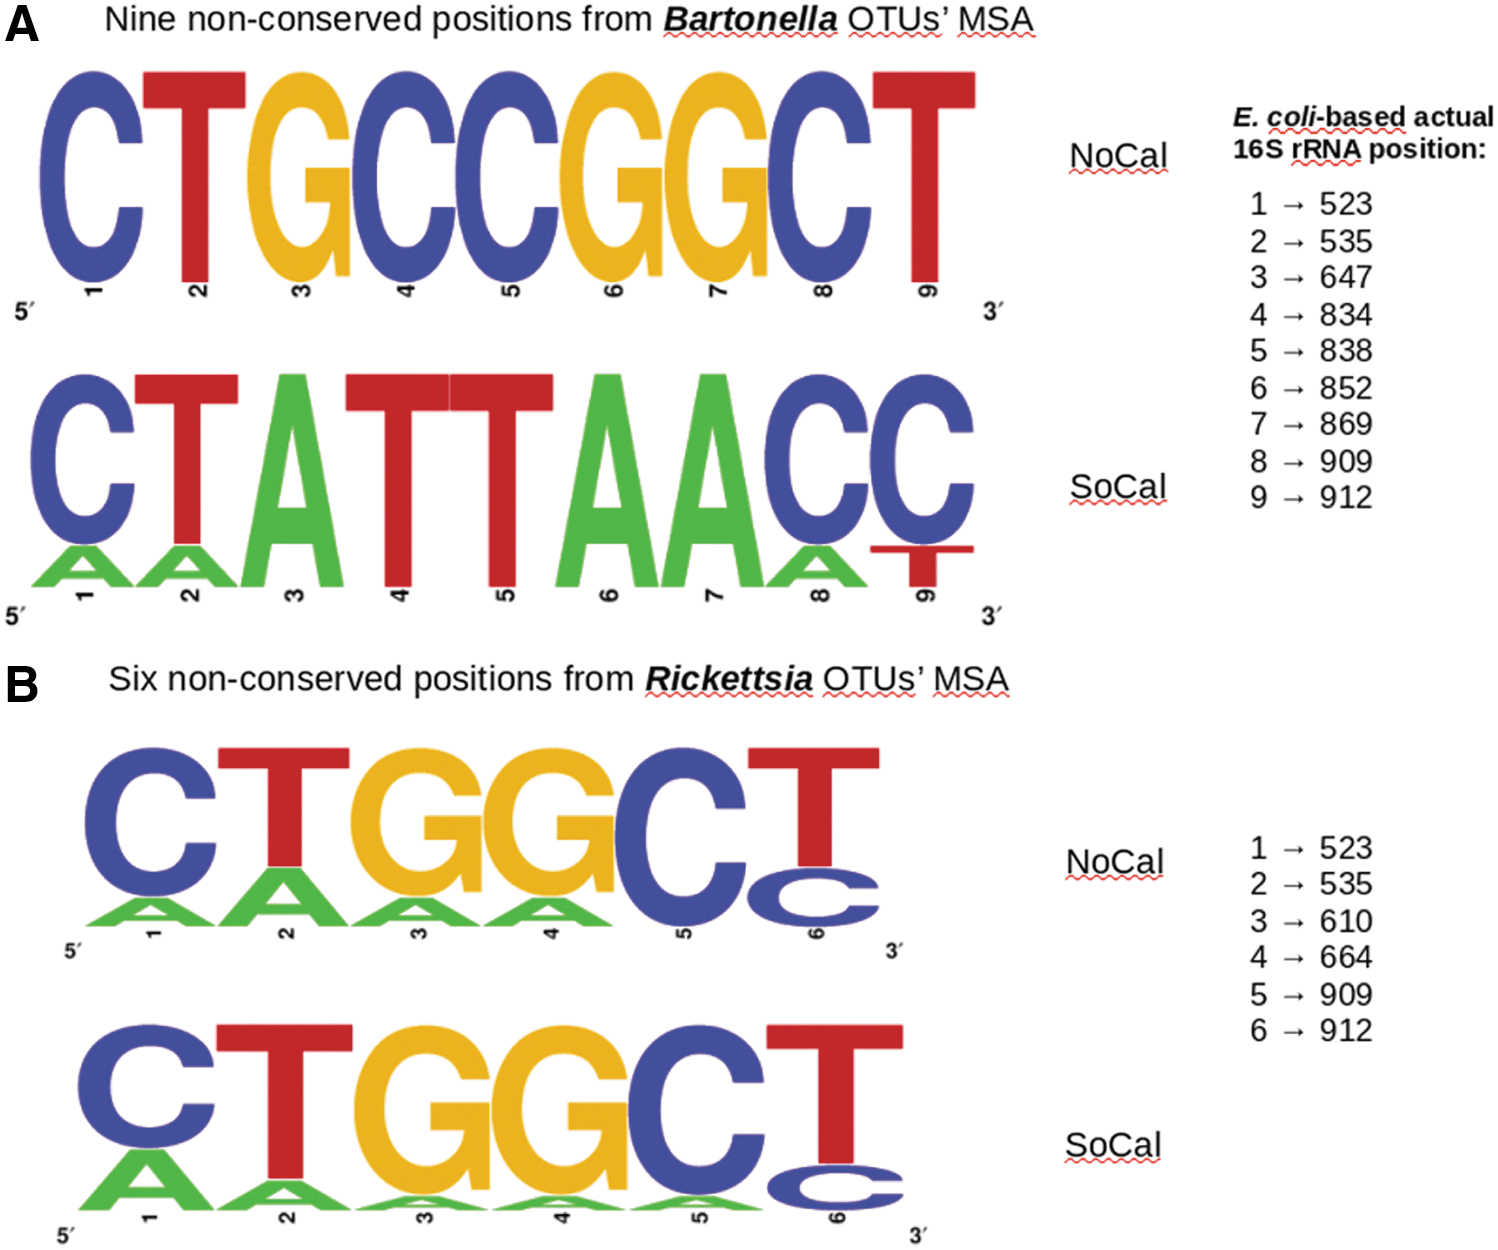
When we used BlastN (Altschul et al. 1997) to find perfect alignments (100% identity and 100% query coverage) for Rickettsia and Bartonella OTU representative sequences, there were several perfect Blast hits for Rickettsia OTUs from both NoCal and SoCal, including R. felis and Rickettsia senegalensis (Table 2). No perfect match to any R. typhi type strain was detected in any sample, corroborating our previous study (Billeter et al. 2016). Regarding Bartonella, differences were observed between NoCal and SoCal OTU sequences sufficient to perfectly align them with different species according to region: B. henselae and B. koehlerae (NoCal) and B. clarridgeiae (SoCal) (Table 2 and Fig. 4A).
MSAs of Bartonella
Unlike Bartonella OTUs, Rickettsia OTUs from both NoCal and SoCal showed equal pattern of nucleotide substitutions within the sequenced amplicons, preventing the assignment of different species according to the region (Fig. 4B).
Discussion
This study reflects our continuing efforts to understand the epidemiology of FBD in California. Our results indicate that the microbiome of cat fleas in California is predominantly composed of the endosymbiont Wolbachia spp., and the two genera Rickettsia and Bartonella, which include potential zoonotic pathogens. Cat fleas were frequently found coinfected with Wolbachia spp. and Rickettsia spp. Bartonella spp. were present in few flea pools, at high bacterial loads. Our results also suggest that there is no difference in the overall microbiome diversity and taxonomic composition of cat fleas between SoCal and NoCal.
The results of this study were consistent with our previous work using ompB gene PCR/digestion assays that confirmed R. felis as the most abundant Rickettsia species in the 130 cat flea pools tested (Billeter et al. 2016). Ninety-five percent of these samples were correctly identified as either Rickettsia-infected or noninfected fleas by our 16S-NGS method (Table 1). Furthermore, through a BlastN analysis, we also identified R. felis as a perfect hit for 16/18 Rickettsia OTUs (Table 2), indicating a potential corroboration of both assays.
Other Rickettsia species detected by NGS showed similar alignment profiles due to the lack of resolution of the V4–V5 amplicon targeted by NGS, consistent with previous observations using16S-NGS for the V4 region on 19 cat fleas and 8 Echidnophaga ambulans fleas from Australia (Lawrence et al. 2015). Two of the 18 Rickettsia OTUs (one for each group), interestingly corresponding to the two samples that were assigned to Genotype 1 (Rickettsia asemboensis) in our previous study (Billeter et al. 2016), showed a perfect alignment to a single sequence classified as “Rickettsia endosymbiont of Ctenocephalides felis isolate CF26B/US” (KU597065.1; Table 2), which was first identified by another research group in California (unpublished—sequence deposited on GenBank at
R. asemboensis (JN315973.1) was the second best hit for those two OTUs (99% identity). RFLOs have been previously reported as endosymbionts in the desert flea Xenopsylla ramesis (Rzotkiewicz et al. 2015).
Both Bartonella prevalence rate (15.8%, 3/19 cat flea samples, Table 1) and their potential species detected herein (B. henselae and B. clarridgeiae, Table 2) corroborate other studies that assessed Bartonella spp. in cat fleas from various locations in the Americas (Yore et al. 2014, Rizzo et al. 2015). Rizzo et al. (2015) detected Bartonella spp. in 7.3% (3 of 41) of C. felis collected from cats in Cajamarca, Peru (one positive identified as B. henselae and two as B. clarridgeiae). Another molecular surveillance study screening dogs and fleas from Florida (USA) revealed a Bartonella prevalence rate of 17.5% in dog's blood (14/80) and 11.3% in pooled fleas (9/80) (Yore et al. 2014). C. felis was present in only two of the nine flea pools that tested positive for Bartonella (confirmed as B. clarridgeiae), with Pulex spp. being more commonly infected (Yore et al. 2014).
The most abundant genus detected in Californian cat fleas was the arthropod endosymbiont Wolbachia (Fig. 2B). Several studies have focused on the role of Wolbachia on arthropod maintenance (Rio et al. 2016), destabilization of mosquito populations (Telschow et al. 2017), antipathogenic effects (Moreira et al. 2009, Monteiro et al. 2016), or even controversies about the latter (Zug and Hammerstein 2014). The effect of Wolbachia in cat fleas needs to be better elucidated however.
Three medically important Elizabethkingia species (E. meningoseptica, E. anopheles, and E. miricola) have been recently reported and are considered opportunistic pathogens that can live either in the environment (water sources and soils) or in mosquitoes (Anopheles, Aedes, and Culicoides spp.) (Mee et al. 2017). Elizabethkingia is responsible for infections that occur globally (Africa, Asia, Australia, and USA) and can cause septicemia with mortality rates reaching as high as 23.5% (Ngwa et al. 2013, Mee et al. 2017). To our knowledge, Elizabethkingia spp. has not been previously detected in nonmosquito arthropod vectors and our findings may therefore have public health relevance. The role of Elizabethkingia in C. felis and its potential to spread to other vectors and vertebrate hosts needs to be more broadly investigated.
NGS has great potential for comprehensive characterizations of microbial communities from both vertebrate reservoirs and hosts. We believe that synergy among the fields of ecology, public health, and clinical medicine (both veterinary and human) is the key for a holistic view and better understanding of FBD and/or other vector-borne diseases (VBDs) epidemiology. Microbiome analysis using 16S-NGS and/or metagenomics is a powerful tool that may support such efforts.
Conclusion
As a proof of principle, we believe our group has now established a robust tool for characterizing cat flea microbiomes. Two important zoonotic pathogens (Rickettsia and Bartonella), as well as an endosymbiont (Wolbachia), were the most abundant genera, followed by less abundant taxa that were mostly consistent with previous reports. There was no overall difference between NoCal and SoCal flea microbiomes, but several specific taxa did have significantly different relative abundance between the two regions. These results will help direct future efforts on surveillance and treatment of FBDs in California.
A more comprehensive analysis encompassing hundreds of samples from additional biogeographic provinces, as well as exploring other 16S variable regions or using pathogen-specific genes as NGS target, is necessary to better understand flea-borne pathogen prevalence and guide efforts for FBD preventive control programs.
Footnotes
Acknowledgments
The authors are thankful to Merial®, the CVM Associate Dean for Research, Dr. Dominique Griffon, and the WesternU Vice-President for Research and Biotechnology, Dr. Steven Henriksen, for the financial support of students and postdoctoral fellow involved in this study. The authors also thank Andrea Wournell and Linda Genzlinger for excellent technical assistance.
Author Disclosure Statement
No conflicting financial interests exist.
References
Supplementary Material
Please find the following supplemental material available below.
For Open Access articles published under a Creative Commons License, all supplemental material carries the same license as the article it is associated with.
For non-Open Access articles published, all supplemental material carries a non-exclusive license, and permission requests for re-use of supplemental material or any part of supplemental material shall be sent directly to the copyright owner as specified in the copyright notice associated with the article.