
Abstract
Background:
There has recently been a substantial increase in the number of tick species and tick-borne infectious agents in Tanzania. Owing to their impact on human, livestock, and wild animal health, increased knowledge of ticks is needed. So far, no published data on the genetic relationship between hard tick (Ixodidae) sequences collected from cattle are available in Tanzania.
Methods:
Ticks from cattle in the wards, which lie at the border of Mikumi National Park, were collected in the dry season, November to December 2019. Morphological identification of ticks was initially performed at the genus level. To identify ticks at the species level, molecular analysis based on the 16S rRNA gene was performed. Evolutionary relationships and genetic distances between ticks were determined using MaximumLikelihood and Kimura 2-parameter methods, respectively.
Results:
Based on morphology, two genera (Rhipicephalus and Hyalomma) were identified in the 630 adult ticks collected from a total of 252 cattle. Six species (Rhipicephalus microplus, Rhipicephalus evertsi, Hyalomma marginatum, Hyalomma rufipes, Hyalomma truncatum, and Hyalomma turanicum) were confirmed by BLASTn and phylogenetic analyses. Considerable mean and pairwise genetic distances were observed for Rhipicephalus and Hyalomma genera.
Conclusion:
The presence of different phylogenetic clusters and considerable mean and pairwise genetic distances observed reflect possible biological diversity of hard ticks present in the study area. Considering the value of the cattle in the livelihoods and economies of people and the country, the outcomes of this study will be useful in planning integrated control strategies for ticks and tick-borne diseases in Tanzania.
Graphical Abstract

Background
Ticks are obligate blood-sucking ectoparasites of mammals, birds, and reptiles (Walker et al. 2003) that are responsible for severe economic losses in livestock production (Jongejan and Uilenberg 2004). Through blood sucking, ticks can cause reduction in livestock weight, limit livestock production, and induce anemia (Jongejan and Uilenberg 2004). Tick bites may cause irritation that leads to secondary bacterial infections, such as Staphylococcus aureus and Group A Streptococcus (Jongejan and Uilenberg 2004). Retained tick material and host scratching may increase the likelihood of this complication, resulting in reduced hide quality (Jongejan and Uilenberg 2004). Certain tick species inject toxins into animals that cause paralysis (Walker et al. 2003). In addition, ticks are vectors of several pathogens (viruses, bacteria, protozoa, and filarial nematodes) that can cause diseases in humans, livestock, and wild animals (Estrada-Peña et al. 2013). There are about 800 well-established species of ticks found worldwide, and most belong to two main families, Ixodidae (hard ticks) and Argasidae (soft ticks) (Walker et al. 2003). Ixodidae is the largest family and are of great economic importance due to their negative socioeconomic impact on agriculture (Baffi et al. 2007, Chivillon et al. 2007, Li et al. 2007). It has, therefore, become increasingly important to clarify the level of genetic variation within hard tick populations to improve development of tick control strategies (Hernandez et al. 2002, Cutulle et al. 2009).
Cattle are highly valuable in Africa, playing diverse roles in the livelihoods and economies of its people and countries. Mikumi National Park is located in the Morogoro region of Tanzania and lies between latitudes 7° and 10° South of the equator and between longitudes 36° and 37° East of Greenwich (Fig. 1). This ecosystem is inhabited by a wide variety of wild animals and arthropods. Hence, the area is considered to be one of the epidemic foci of tick species and possibly tick-borne diseases (Kambarage 1995). In areas that lie at the border of Mikumi National Park, people practice nomadic pastoralism, keeping large numbers of indigenous cattle. Several cases of high tick infestation and tick-borne infections have been reported in livestock in these areas in recent years (Ogden et al. 2005, Laisser et al. 2014). Moreover, cattle trade in the country is largely unregulated, creating risks of tick and tick-borne disease dissemination that require detailed investigation. Until now, studies on ticks have mainly been conducted on three tick genera reported to be endemic: Hyalomma, Rhipicephalus, and Amblyomma (Lynen et al. 2007, Kwak et al. 2014, Kerario et al. 2017).
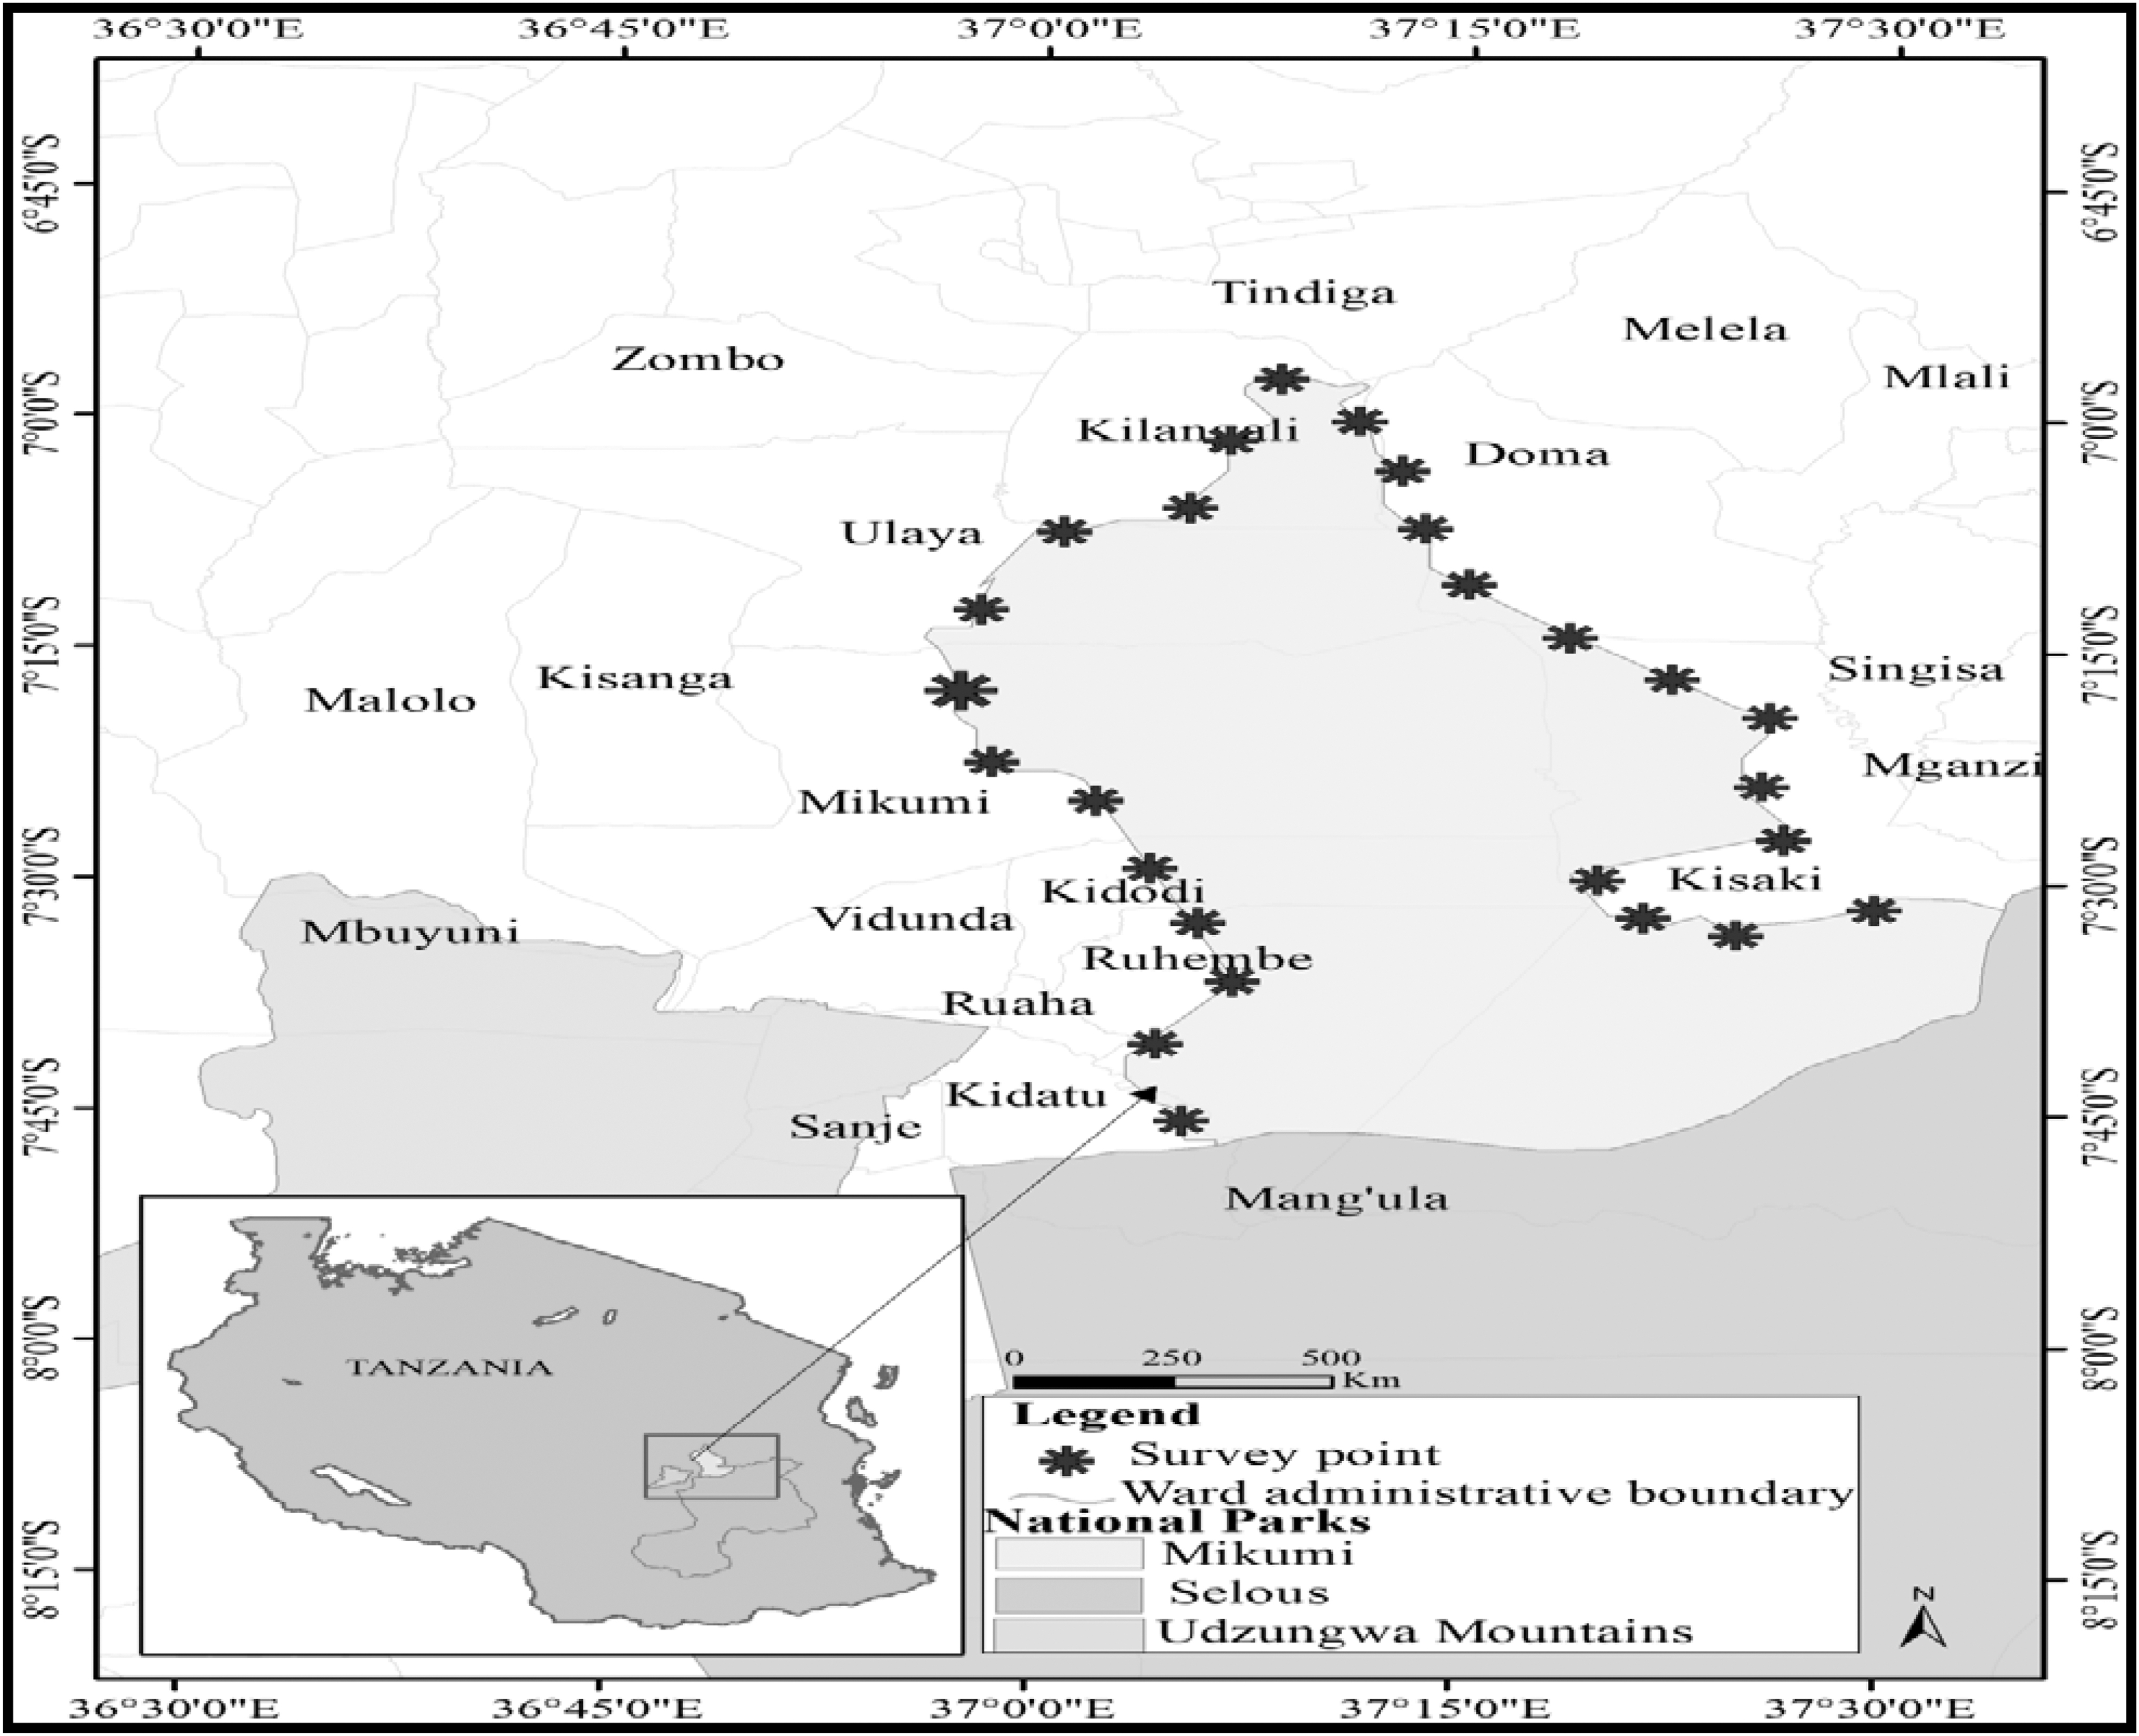
Map showing wildlife–livestock interface ecosystem of Mikumi National Park. Data source: National Bureau of Statistics GIS Database (
However, no published genetic relationship data (phylogenetic or genetic distance) exist for hard ticks infesting cattle in Mikumi National Park. Phylogeny utilizes the evidence of evolutionary relationship of species, whereas genetic distance utilizes evidence of evolutionary divergence of species. Both determine the genetic relationships of populations within a species. The phylogenetic and genetic relationship data of Ixodidae ticks will provide valuable information to farmers and other stakeholders about the differences and similarities of Ixodidae hard tick populations in the area. Herein, a genetic analysis of the phylogeny and genetic distance of Ixodidae collected on cattle at several wards in the border lying areas of Mikumi National Park was conducted. The economic outcome can be important as tick infestation can cause severe impact in livestock. Cattle are highly valuable in Tanzania and Africa in general, playing diverse roles in the livelihoods and economies of peoples and countries.
Methods
Tick collection
Ticks from cattle located at the border lying wards of Mikumi National Park, Morogoro region, Tanzania (geographical coordinates, S 7°00′ to 8°00′ and E 037°00′ to 037°40′), were collected during the 2019 dry season (November–December) (Fig. 1). During tick collection, cattle were restricted, kept standing, and all body parts were examined. Only adult ticks were collected by plucking using blunt forceps. Collected ticks were preserved in 70% ethanol and stored at −20°C in the laboratory at the Department of Veterinary Parasitology and Entomology, Faculty of Veterinary Medicine, Sokoine University of Agriculture, Morogoro, Tanzania.
Identification of tick genus based on morphology
The morphological identification of tick genera was performed according to published taxonomic keys (Walker et al. 2003) using stereomicroscopes with magnification up to 100 × . Identification was conducted at the Entomology Unit, Department of Parasitology and Entomology, Sokoine University of Agriculture. Morphologically identified ticks from all surveyed wards were pooled together into their respective genus.
Identification of tick species based on molecular techniques
For each genus of ticks, nine representative individuals were randomly selected for molecular analysis of the species and existing genetic diversity of the human–wildlife–livestock interface ecosystem of the wards that lie at the border of Mikumi National Park. The rationale behind this approach is based on the interconnectivity of the wards bordering the park, with livestock, human, and wildlife movement across ward borders.
DNA extraction
A total of 18 adult ticks, representatives of the two genera identified morphologically, were washed twice in distilled water and air dried for 15 min. Each individual tick was transferred into a 2-mL microtube containing glass plating beads (ZymoResearch, CA, USA). The tubes were frozen in liquid nitrogen for 10 min, then the ticks were ground into a powder using a Geno-grinder (SPEX Sample Prep, United Kingdom), followed by enzymatic digestion using Proteinase K (Hill and Gutierrez 2003). Genomic DNA extraction was carried out using phenol-chloroform extraction (Wallace 1987). The DNA was then precipitated with absolute ethanol and resuspended in 200 μL of 1 × TE buffer (10 mMTris, 1 mM EDTA, pH 8) (Hill and Gutierrez 2003).
DNA amplification
A pair of specific primers targeting the mitochondrial 16S rRNA gene of ticks were used; 16S+1 (5′-CTGCTCAATGATTTTTTAAATTGCTGTGG-3′) and 16S-1 (5′-CCGGTCTGAACTCAGATCAAGT-3′). The PCR reactions were conducted in a final volume of 20 μL containing 10 μL of PCRNEB One Taq 2 × Master Mix with Standard Buffer, 6 μL of nuclease-free water, 1 μL of 10 μmol/L of each primer, and 2 μL of DNA template (Black and Piesman 1994). PCR amplification was carried out using a Thermo Scientific Arktik Thermal Cycler (TC A0096). The protocol for 16S rRNA gene amplification using 16S+1/16S−1 primers was as follows: initial denaturation at 95°C for 5 min; 10 cycles at 92°C for 1 min, 48°C for 1 min, and 72°C for 45 s; 32 cycles at 92°C for 1 min, 54°C for 35 s, and 72°C for 45 s; followed by a final extension at 72°C for 7 min (460 bp) (Black and Piesman 1994). For each PCR reaction, a negative control containing deionized water was included.
Agarose gel analysis and purification of amplicons
PCR products were visualized in 1.4% agarose gel (CSL-AG500; Cleaver Scientific Ltd.) stained with EZ-vision®Bluelight DNA DyeinTris-acetate-EDTA buffer under ultraviolet light after staining with Gel Red Nucleic Acid Stain (
Sequencing of 16S rRNA amplicons
16S amplicons were sequenced at Inqaba South Africa using the same forward and reverse primers as used to generate the aforementioned PCR products. The labeled products were then cleaned with the ZR-96 DNA Sequencing Clean-up Kit (
Sequence editing and identity confirmation
Sequences were edited using BioEdit in MEGAX software (Tamura et al. 2011). To confirm the identity of each tick species, the sequences were compared with those available in the GenBank database using BLASTn (
Sequence alignment
Representative mitochondrion 16S rRNA gene sequences of Rhipicephalus microplus, Rhipicephalus evertsi, Hyalomma rufipes, Hyalomma marginatum, Hyalomma truncatum, and Hyalomma turanicum were downloaded from GenBank. Downloaded sequences and sequences generated in this study were aligned by multiple sequence alignment using MUSCLE in MEGAX (Tamura et al. 2011, Kumar et al. 2018). The sequences acquired in this study have been deposited in the GenBank database with accession numbers MT0798663–MT079880.
Phylogenetic analysis
To determine the genetic relationship between different tick species and to infer their evolutionary history, a phylogenetic tree was constructed. To build the tree, reference sequences of the mitochondrion 16S rRNA gene downloaded from GenBank were aligned along with the sequences generated in this study. The evolutionary history was inferred by using the MaximumLikelihood method with 100 replications in the bootstrap test and Tamura 3-parameter mode (Tamura et al. 2011). The initial tree for the heuristic search was obtained automatically by applying Neighbor-Joining and BioNJ algorithms to a matrix of pairwise distances estimated using the Maximum Composite Likelihood approach and then selecting the topology with superior log likelihood value (Tamura et al. 2011). The tree was drawn to scale, with branch lengths measured in the number of substitutions per site. This analysis involved 24 nucleotide sequences, 18 generated from this study and the rest from GenBank. Evolutionary analyses were conducted in MEGAX (Kumar et al. 2018).
Evolutionary divergence (genetic distance) of ticks
To further determine the evolutionary divergence of the ticks collected in this wildlife–livestock interface ecosystem, mean and pairwise genetic distance analysis were conducted using Kimura's 2-parameter (K2P) model (Kimura 1980). The analysis involved sequences generated in this study only. Standard error estimates were obtained by a bootstrap procedure (100 replicates). All ambiguous positions were removed for each sequence pair (pairwise sequence deletion option) (Bursali et al. 2012). Mean and pairwise genetic distance analyses were conducted in MEGAX (Kumar et al. 2018).
Results
Tick collection and identification
A total of 630 adult ticks were collected from 252 cattle in nine wards that lie at the border of Mikumi National Park (Table 1). All ticks were classified into two genera based on morphology: Rhipicephalus (371) and Hyalomma (259) (Table 1). Specimens of Rhipicephalus collected from all wards were pooled together; likewise, specimens of Hyalomma collected from all wards were pooled together. Then, nine representative individuals from each group were randomly selected for further analysis. To confirm results of morphological identification, the partial mitochondrion 16S rRNA gene was used as a molecular marker in species identification. A total of 18 specimens were sequenced, edited, and aligned before BLASTn analysis was performed. The lengths of the aligned sequences varied from 399 to 453 bp, and the nucleotide components indicate that the 16S rRNA gene of these ticks was highly A-T rich, with average nucleotide frequencies of 36.77% thymine, 9.51% cytosine, 39.71% adenine, and 13.99% guanine. A bias toward adenine and thymine (76.48%) was consistent with the base composition of arthropod mitochondrial DNA. The results from molecular identification are summarized in Table 2. BLASTn matched morphological results with identity varying between 97% and 100% (Table 2). Molecular results revealed that, among the Rhipicephalus specimens, five were R. microplus and one was R. evertsi. Of the Hyalomma specimens, five were H. marginatum, three were H. truncatum, two were H. rufipes, and two were H. turanicam. R. microplus and H. marginatum outnumbered all other tick species, and together they represent 56% of the total ticks sequenced in this study (Table 2).
Number of Ticks Collected from Cattle
Sampled Tick Species and Percentage Identity Values with Reference Sequences
Phylogenetic analysis of the mitochondrial16S rRNA gene
Eighteen sequences representing the two identified tick genera and six reference sequences downloaded from GenBank were used to infer phylogenetic relationship of tick species. To determine the evolutionary relationship of species, sequences from each species found were aligned along with representative sequences downloaded from GenBank. The MaximumLikelihood tree from mitochondrion 16S rRNA gene sequences derived from Rhipicephallinae and Hyalomminae subfamilies generated five (clusters) phylogroups (A–E) (Fig. 2). Group A constitutes the Rhipicephalus genus with two monophyletic groups, R. microplus and R. evertsi. Group B members included H. truncatum, group C contain H. rufipes, group D comprised H. turanicum, and group E included H. marginatum (Fig. 2). There was strong bootstrap support among R. microplus, R. evertsi, H. truncatum, and H. turancum (Fig. 2). The results provided weak support in bootstrap analysis for the clusters containing H. rufipes and H. marginatum (Fig. 2).The high bootstrap value (100%) supported the close relationship between R. microplus and R. evertsi (Fig. 2).

Evolutionary relationships (phylogeny) for tick species, including sequences obtained in this study and representative sequences of the known species from GenBank (indicated with a species name).
Evolutionary divergence (genetic distance) of ticks
Using the K2P model, sample divergences at various taxonomic levels are shown in Tables 3 and 4. To determine the evolutionary divergence (distance) within the species, sequences from each species generated in this study were aligned, and the K2P distance model was then used to determine the mean and pairwise distances. H. marginatum recorded the highest mean intraspecies distance value, whereas R. microplus recorded the lowest (Tables 3 and 4). The highest pairwise intraspecies value was recorded in H. marginatum, and the lowest were observed in R. microplus and H. Truncatum (Tables 3 and 4). Likewise, 16S rRNA gene sequences from each genus observed in this study were aligned to determine the evolutionary distance of ticks within the genus. The K2P distance model was thereafter applied to infer the mean and pairwise distances. The highest pairwise intragenus value was recorded in Hyalomma, with the lowest in Rhipicephalus (Table 4). Notably, mean evolutionary divergences were considerably high in both genera (Table 4). Finally, to determine the overall genetic distance of the overall tick community, all 16SrRNAsequences generated in this study were aligned and the K2P model used to estimate genetic distance. The overall high mean distance of 0.11 ± 0.0 (Table 4) and the high pairwise maximum distance value of 0.23 were recorded (Table 3).
Estimates of Pairwise Evolutionary Divergence between Sequences
The Mean, Maximum and Minimum Evolutionary Divergence
Discussion
In this study, the phylogenetic relationship and genetic distance of hard ticks (Ixodidae) infesting cattle in the wildlife–livestock interface ecosystem at the border of Mikumi National Park during the 2019 dry season were analyzed. During dry seasons, there is more movement of people and livestock to areas very close and sometimes entering the National Park boundary, where water and pasture are abundant long after the rains have gone. Likewise, there is migration of wild animals outside of the National Park boundaries. These migration patterns facilitate the potential transfer of ticks across great distances, presenting the opportunity for exchange of diverse tick species between domestic animal, wild animal, and even human populations, facilitating risk of exposure to tick-borne disease. Phylogenetic and genetic relationship data will provide valuable information in the planning of integrated control strategies for ticks and tick-borne diseases in Tanzania.
The MaximumLikelihood tree generated in this study recorded several clusters of mitochondrial16S rRNA gene sequences, indicating divergence of gene sequences of hard ticks (Barker and Murrell 2002, Bursali et al. 2012, Low et al. 2015) present in this wildlife–livestock interface ecosystem. In that way, clusters of similar sequences represent species/subspecies clearly separated from other clusters (species/subspecies) (Black and Piesman 1994, Tabarlet et al. 1997, Rees et al. 2003). This reflects the biological diversity of ticks within Ixodidae (Burger et al. 2014, Lv et al. 2014, Kaur et al. 2016) present in this wildlife–livestock interface ecosystem.
The current intraspecies genetic distance results revealed that H. marginatum, H. rufipes, and H. turanicum had considerably high mean and pairwise intraspecies genetic distances. This suggests that different groups of these species might represent distinct species or subspecies or that they are species complexes with high genetic diversity (Waugh 2007). In contrast, the low mean and pairwise intraspecies genetic distances of R. microplus and H. truncatum might indicate misidentification among the species (Sheth and Thaker 1997, Lu et al. 2013).
The present intragenus genetic distance data indicate that Hyalomma spp. had considerably high mean and pairwise genetic distance, suggesting high biological diversity in this genus of hard ticks (Lu et al. 2013, Lv et al. 2014). Therefore, either new species or subspecies closely related to those recorded herein might exist or these ticks form species complexes with divergent lineages in this wildlife–livestock interface ecosystem (Lu et al. 2013). The interbreeding between H. rufipes, H. marginatum, and H. turanicum populations has already been demonstrated (Apanaskevich and Horak 2008, Estrada-Peña et al. 2012), and these hybrid forms can be transported to different regions by migratory birds (Hoogstraal et al. 1961, Kaiser et al. 1974, Hasle et al. 2009, Estrada-Peña et al. 2012, Mancini et al. 2013). Therefore, it is possible to find hybrid forms resultant from the interbreeding of two or three species in regions where these species are found (Hoogstraal et al. 1961, Mancini et al. 2013). This could explain the wide sequence variability (divergences) for Hyalomma spp., particularly for H. marginatum, H. turanicum, and H. rufipes (Hoogstraal et al. 1961, Estrada-Peña et al. 2012) observed in this study.
The mean and pairwise genetic distances in the overall tick community found in this study were highly similar to other studies (Apanaskevich and Horak 2008, Lu et al. 2013). Such considerable genetic distance values reflect the biological diversity within the hard tick community present in this wildlife–livestock interface ecosystem (Lu et al. 2013). As expected, the mean genetic distances recorded in this study increased with higher taxonomic ranking: 0.01 ± 0.00, 0.06 ± 0.01, and 0.11 ± 0.01 for intraspecies, intragenus, and overall tick community, respectively. This indicates the mitochondrial 16S rRNA gene is a good marker for supraspecific differentiation and taxa grouping purposes (Lv et al. 2014, Kaur et al. 2016, Hekimoglu et al. 2017). According to Ros and Breeuwer (2007), DNA barcoding assumes that the genetic distances between species are greater than within species.
Conclusion
The presence of different phylogroups (clusters) and considerable genetic distances observed in this study reflect the possible biological diversity of hard ticks present in the study area. Therefore, further study is required to delineate species boundaries and to develop a more complete understanding of hard tick diversity over a larger scale.
Footnotes
Acknowledgments
The authors thank the Swedish Government and Swedish International Development Cooperation Agency (SIDA) for contributions and financial support. Special thanks is also extended to the University of Dar es Salaam, Tanzania, and Swedish University of Agricultural Sciences, Uppsala, Sweden, for supporting this study, as well as colleagues and researchers at the Swedish University of Agricultural Sciences Global Bioinformatics Centre (SGBC) who provided valuable knowledge and skills concerning bioinformatics. We thank the livestock keepers, village and ward leaders from each location for their help with tick collection, as well as entomologists from Sokoine University of Agriculture who assisted in tick morphological identification.
Authors' Contributions
D.D. designed the investigation, performed the experiments, conducted the investigation, and drafted the article. M.D. designed the investigation, conceived the study, and revised the article. J.J.W. and M.B. conceived the study, designed the investigation, and revised the article. All authors read and approved the final article.
Availability of Data and Materials
The data supporting the conclusions of this article are included within the article. The sequences generated in this study were submitted to GenBank under the accession numbers MT079863–MT079880.
Ethics Approval and Consent to Participate
No specific permits were required for this study. The study did not involve endangered or protected species. Therefore, the local ethics committee deemed that approval was unnecessary.
Author Disclosure Statement
No competing financial interests exist.
Funding Information
No funding was received for this article.