
Abstract
Introduction:
Lyme disease is the most common vector-borne disease in the United States and Canada. The primary vector for the causative agent of Lyme disease, Borrelia burgdorferi, in the Pacific Northwest is the western blacklegged tick, Ixodes pacificus.
Materials and Methods:
Using active tick surveillance data from British Columbia, Canada, and Washington State, USA, habitat suitability models using MaxEnt (maximum entropy) were developed for I. pacificus to predict its current and mid-century geographic distributions. Passive surveillance data both from BC and WA were also visualized.
Results:
According to the constructed models, the number of frost-free days during the winter is the most relevant predictor of its habitat suitability, followed by summer climate moisture, ecoregion, and mean minimum fall temperature. The ensemble geographic distribution map predicts that the coastal regions and inland valleys of British Columbia and the Puget Lowlands of Washington State provide the most suitable habitats for I. pacificus. The density map of ticks submitted from passive surveillance data was overlaid on the current distribution map and demonstrates the correlation between numbers of submissions and habitat suitability. Mid-century projections, based on current climate change predictions, indicate a range expansion, especially of low and moderate suitability, from current distribution. Regarding Lyme disease risk, I. pacificus identified from both active and passive surveillance and tested positive for B. burgdorferi were found to be in areas of moderate to very high suitability for I. pacificus.
Conclusion:
According to developed models, the total suitable habitat area for I. pacificus will expand in the interior regions of British Columbia and Washington State. However, the risk remains small given relatively low infection rates among I. pacificus. Further studies are required to better understand how this might change in the future.
Introduction
Lyme disease is the most common tick-borne disease in North America (Lindsay, 2016). Reported cases in Canada have increased significantly in the past decade especially in Ontario, Quebec, and Nova Scotia (Gasmi et al., 2017). In western provinces such as British Columbia and Alberta, reported cases have also increased, albeit only slightly, compared with eastern provinces (Gasmi et al., 2017). Lyme disease in humans is caused by the bite of competent tick vectors infected with bacteria from the Borrelia burgdorferi (B. burgdorferi) sensu lato complex. In midsouthern and eastern Canada, Ixodes scapularis say is the primary vector of B. burgdorferi sensu stricto (s.s.), whereas in southwestern Canada, it is I. pacificus Cooley and Kohls (Eisen et al., 2016; Ogden et al., 2009; Dizon et al., 2023). Each life stage of I. pacificus prefers a different set of vertebrate hosts. Subadult (larvae and nymphs) ticks prefer reptiles such as the western fence lizard (Sceloporus occidentalis) (Lane & Loye, 1989) or alligator lizard (Elgaria sp.) (Wright et al., 1998). Subadult ticks have also been shown to prefer certain birds and rodents, such as the deer mouse (Peromyscus maniculatus), redwood chipmunk (Neotamias ochrogenys), hermit thrush (Catharus guttatus), and the spotted towhee (Pipilo maculatus) (Dizon et al., 2023; Morshed et al., 2005; Nieto et al., 2010). Adult ticks prefer larger hosts such as black-tailed deer (Odocoileus hemionus columbianus) (Richardson) (Lane & Burgdorfer, 1986). Tick life cycles are also influenced by host population dynamics (Salkeld & Lane, 2010) as well as environmental factors, including land use and climate change (Eisen et al., 2018; Dizon et al., 2023). For example, previous studies have shown that moderately warm and moist climates can increase the chances of survival of subadult I. pacificus and shorten the development time for all three stages of I. pacificus, at least in California (Eisen et al., 2004a; MacDonald and Briggs, 2016; MacDonald et al., 2017; Nieto et al., 2010). Habitats with rich canopy cover and vegetation can also protect I. pacificus from desiccation due to high temperatures (Hacker et al., 2021; Lane & Loye, 1989; Newman et al., 2015). Thus, both temperature and moisture have been identified as key factors affecting I. pacificus activity and geographic range.
Active tick surveillance, via dragging and rodent trapping, conducted by public health agencies from Washington State (Dykstra et al., 2020) in the United States and the province of British Columbia (Wilson et al., 2022; Guillot et al., 2020; Morshed et al., 2015) in Canada indicates that I. pacificus is the most important Ixodes species for the transmission of B. burgdorferi in western North America. The geographic range of I. pacificus includes most of California, western Oregon, Washington State (Arthur & Snow, 1968; Easton et al., 1977; Doggett et al., 2008; Dykstra et al., 2020; Xu et al., 2019; Anon, 2022), and the south coastal areas of British Columbia (Arthur & Snow, 1968; Arnason, 1992; Mak et al., 2010). Passive tick surveillance indicates that most I. pacificus submissions originate from western California, Oregon, Washington State, and the south coastal regions of British Columbia (Mak et al., 2010; Anon, 2023; British Columbia Center for Disease Control, 2023). Most passive surveillance programs in western North America utilize public submissions that indicate whether ticks were found on animals, the environment, or humans themselves (Guillot et al., 2020; Xu et al., 2019). The majority of I. pacificus submitted through passive surveillance were found attached to humans although there were also many submissions of ticks found attached to dogs and other domesticated animals (Wilson et al., 2022; Washington State Department of Health Tracking Network, Tick Data).
To inform risk assessment work for Lyme disease, and to develop targeted active surveillance efforts for tick vectors, several modeling studies have identified areas of habitat suitability for I. pacificus in western North America. Results from these studies have been used to generate distribution maps for I. pacificus in British Columbia where the most suitable habitats were located along the south, central, and north coast and in valley systems in the interior of the province (Mak et al, 2010). These are consistent with areas of known Lyme disease risk in the province (British Columbia Center for Disease Control, 2023). In this study we build on previous work done by Mak et al. (2010) using more recent active tick surveillance data from the province of British Columbia (2004–2005 and 2013–2014) and additional data from Washington State (2011–2019). To date, there have been no known published studies analyzing the future geographic distribution of I. pacificus in this region. We present new habitat suitability maps analyzing both the current and future geographic distribution of I. pacificus under different climate change scenarios.
Materials and Methods
Data
Surveillance data were obtained from British Columbia Center of Disease Control (BC CDC) (Morshed et al., 2015) and the Washington State Department of Health (WA) (Dykstra et al, 2020). I. pacificus was collected from trapped rodents at 20 locations in BC and from dragging in the environment in WA at 61 locations (Table 1). Testing of I. pacificus for B. burgdorferi followed laboratory protocols from both government agencies (Dykstra et al., 2020; Morshed et al., 2015).
Summary of the Field Data: Life Stage and Borrelia burgdorferi Test Results for British Columbia (BC), Canada and Washington State (WA), USA
Passive data associated with public submissions (2001–2019) from British Columbia (Morshed et al., 2021) at the postal code level and (2010–2022) from Washington State (Washington State Department of Health, n.d.) at the county level were also acquired. Some of the ticks from the passive data from British Columbia were tested for B. burgdorferi following the same protocols as outlined in Morshed et al, 2021.
Climatic normals data comprised 60 seasonal bioclimatic variables, described in (Wang et al., 2016), at an approximately 800-meter resolution were downloaded from ClimateNA (AdaptWest Project, 2023) for the current (1991–2020) period and for the projected midcentury (2041–2070) period. Seasonal data (i.e., Winter, Spring, Summer, and Fall seasons lasting from December to February, March to May, June to August, and September to November, respectively), chosen as preliminary testing, showed seasonal variations in modeling as well as seasonal I. pacificus counts. Midcentury data (Mahony et al., 2022) were derived from an ensemble mean of eight Coupled Model Intercomparison Project Phase 6 (CMIP6) models under two shared socioeconomic pathway (SSP) scenarios (Riahi et al., 2017): (1) the “middle of the road scenario” (SSP245) assumes that climate protection measures are being taken (i.e., CO2 emissions remain stable before starting to fall midcentury, and temperatures would rise 2.7°C by 2100); and (2) the “upper middle scenario” (SSP370) assumes that CO2 emissions would roughly double from current levels and average temperatures would rise 3.6°C by 2100.
The Level III Ecosections (Ecoregion3) shapefile was downloaded from the North American Environmental Atlas (CEC, 2021) and rasterized at the same resolution and projection (WGS84) as the climate data.
Additional environmental data layers that were downloaded included the Harmonized World Soil data (Fischer et al., 2008) at 30 arc-second and 2015 Forest and Shrub Cover Fraction at 1 km spatial resolution (Copernicus Global Land Service, 2022). Both data layers were geoprocessed to match the same spatial resolution and map projection as the climate data.
Modeling methods
Data cleaning
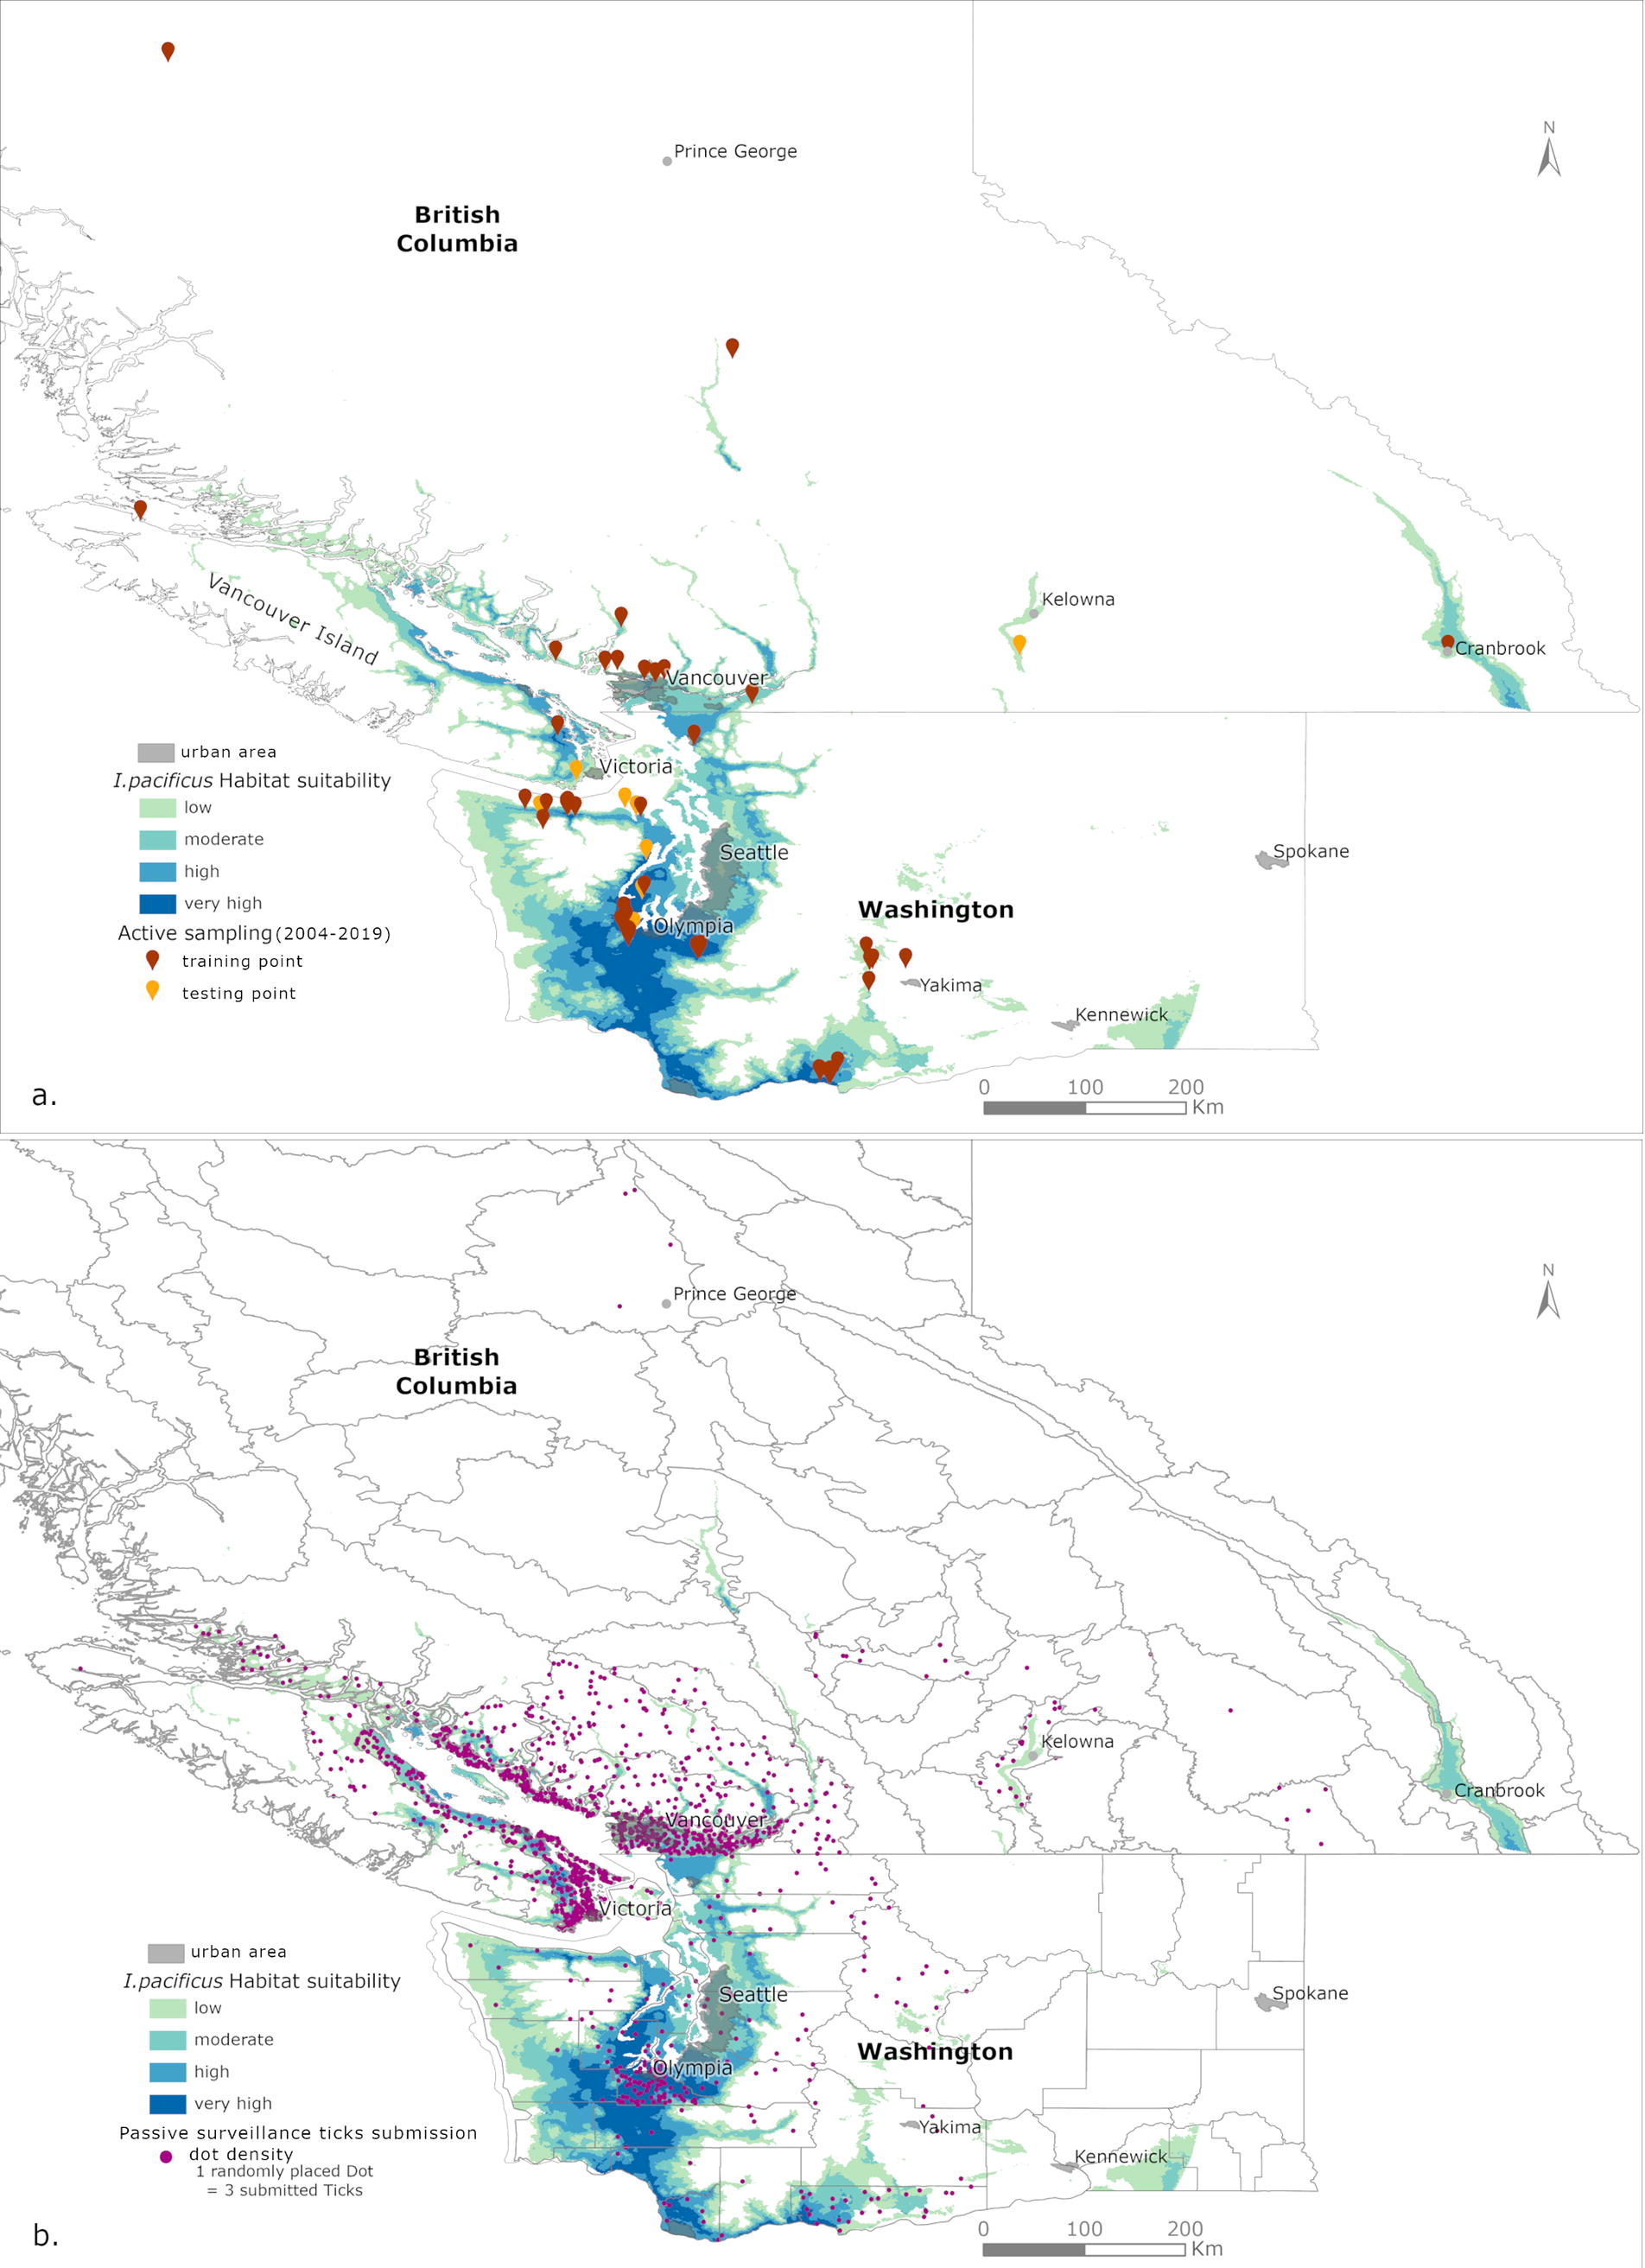
For active sampling data, locations with tick collections that contained less than two life stages or those with no collected ticks two years in a row were discarded to follow pre-existing guidelines defining established tick populations (Ogden et al., 2014). Redundant locations within the same raster cell were also discarded. Seventy-five unique locations were used to model I. pacificus habitat suitability (Fig. 1a).
Choosing variables of interest
As only tick presence points, i.e., points where ticks were collected in the field, were available, background points (1000) were computed using an envelope model. Correlations between variables (Supplementary Fig. S2) and frequency of observation plots (FOP) (Supplementary Fig. S1) were analyzed using the R (R Core Team, 2014) package “MIAmaxent” (Vollering et al., 2019). Variables with a correlation lower than 0.7 and noticeable differences in the FOP between the presence and background data were selected for the model as they can help better identify regions of suitability. This dataset was then inputted into a step-forward MaxEnt (Phillips et al., 2006)-type model algorithm with 80%−20% training−testing sets to find the most appropriate environmental predictor variables and MaxEnt parameters for the habitat suitability of I. pacificus in BC and WA. MaxEnt was used as the primary algorithm in the present study as it is one of the best modeling tools when only-presence data exist and it performed the best compared with other algorithms during preliminary testing. Different combinations of these variables were then used to create MaxEnt-type models and compared using corrected Akaike information criterion (AICc, Burnham and Anderson, 2004) and ANOVA testing (Supplementary Table S2 and Supplementary Table S3).
MaxEnt modeling
The most promising combination of variables with the lowest AICc values and with no significant differences according to ANOVA were then inputted into a MaxEnt algorithm of the “dismo” (Hijmans et al., 2017) R package, using automatic features, fivefold crossvalidation and Jacknife assessment, to create an ensemble of habitat suitability map for the current climate using the median values. Those models were also projected onto the midcentury climate and fixed ecoregion data to create two possible midcentury habitat suitability maps for SSP245 and SSP370.
MaxEnt models were assessed and validated using different metrics: area under the curve (AUC) and correlation both for training and testing data as well as the Cohen’s kappa for testing data.
Then the MaxEnt ensemble probability maps were classified (Zuliani et al., 2015) into unsuitable (p ≤ 0.2), low (0.2 < p ≤ 0.4), moderate (0.4 < p ≤ 0.6), high (0.6 < p ≤ 0.8), and very high (0.8 < p ≤ 1.0) suitability to create I. pacificus habitat suitability maps under current and midcentury climate using ArcGIS Pro v3.1 (Esri n.d., Redlands, CA).
Visualizing B. burgdorferi positivity rate
For both active sampling and passive surveillance tick submissions, the ticks that tested positive for B. burgdorferi were summed at point levels (GPS coordinates for active data and postal code for passive data). The B. burgdorferi positivity rate was calculated by dividing the number of ticks that tested positive for B. burgdorferi by the total number of ticks tested, then multiplied by 10,000 to obtain a rate per 10,000 tests. The B. burgdorferi positivity rate was then overlaid onto the current I. pacificus habitat suitability map.
Visualizing passive data
A dot density map layer (Fig. 1b) derived from passive surveillance data was created mainly to visualize public tick submissions from 2010 to 2019 using the dot density symbiology feature in ArcGIS Pro v3.1 (Esri Inc., Redlands, CA). Due to the large number of submissions, passive surveillance data were aggregated with each dot representing three submitted ticks. Dots within British Columbia were randomly placed within ecoregion polygons while those within Washington were randomly placed within county polygons. This allows visualizing correlation with the habitat suitability map developed from active sampling data.
Results
After the correlation and FOP analyses (Supplementary Figs. S1 and Figs. S2), the remaining 30 variables were entered into the step-forward MaxEnt-type model (Supplementary Table S1). Following this analysis, the variables of interest were: number of frost-free days for winter (NFFD_wt), climate moisture deficit for summer (CMD_sm), climate moisture index for summer (CMI_sm), average temperature for spring (Tave_sp), and minimum temperature for fall (Tmin_at) (Wang et al., 2016) as well as EcoRegion3. Table 2 presents the five “best” MaxEnt models with slightly different combination of variables that had no statistical differences (Supplementary Table S2 and Supplementary Table S3). In all these models, NFFD_wt (ranging from 15% to 69%) and EcoRegion3 (5% to 17%) were key variables of importance. NFFD_wt was the most useful stand-alone variable for all models except for model 3, for which it was Tave_sp. Depending on the models, CMD_sm or CMI_sm were also found to be important (25% to 31%). NFFD_wt had the most information not found in other variables under most models. However, introducing Tmin_at in addition to NFFD_wt resulted in the summer moisture variable increasing in permutation importance (Phillips et al, 2006). Permutation importance, calculated via randomly shifting values of the variables of interest in the final Maxent model, serves as a measure of how much a model relies on a certain variable.
Summary Information of the Five “Best” MaxEnt Models, with No Statistical Difference, Used to Create the Ensemble Habitat Suitability Maps for Ixodes pacificus in British Columbia and Washington State
AUC, area under the curve; CMD_sm, climate moisture deficit for summer; CMI_sm, climate moisture index for summer; NFFD_wt, number of frost-free days for winter; Tave_sp, average temperature for spring; Tmin_at, minimum temperature for fall.
All models were very likely to assign larger probabilities to I. pacificus habitat suitability than random negatives, as AUC scores were greater than 0.9, and represented fair to good agreement beyond chance as Kappa’s test ranged from 0.66 to 0.81. Furthermore, all models performed well as correlation ranged from 0.70 to 0.74 for training and 0.61 to 0.67 for testing dataset.
Current projections indicate areas of high to very high suitability for I. pacificus along the coastal regions of BC and Washington State (Fig. 1a). Certain inland valleys within BC and Washington State have also been identified as areas of low to moderate suitability for I. pacificus (Fig. 1a). An overlay of passive surveillance data indicates that most submitted ticks were also found within areas considered to be of high to very high suitability for I. pacificus, such as the coastal regions of BC and Washington State (Fig. 1b).
Future predictions indicate that the total area of highly suitable habitat for I. pacificus will increase under both the SSP245 and SSP370 scenarios (Fig. 2). Under the SSP245 scenario, highly suitable habitat expands along western WA, and the south coastal and inland regions of BC. Furthermore, areas considered to be of low suitability for I. pacificus have also increased along the southern inland regions of BC. Under SSP370, a similar, albeit slightly greater, expansion is predicted along the areas considered to be of high suitability for I. pacificus under SSP245 (Fig. 2). The overlay of B. burgdorferi positivity rate for I. pacificus found in active sampling (Fig. 3a) and in passive surveillance (Fig. 3b) data onto their current habitat suitability indicates that passive surveillance B. burgdorferi-positive ticks were found in areas predicted to be of high or very high suitability (p ≥ 0.6).
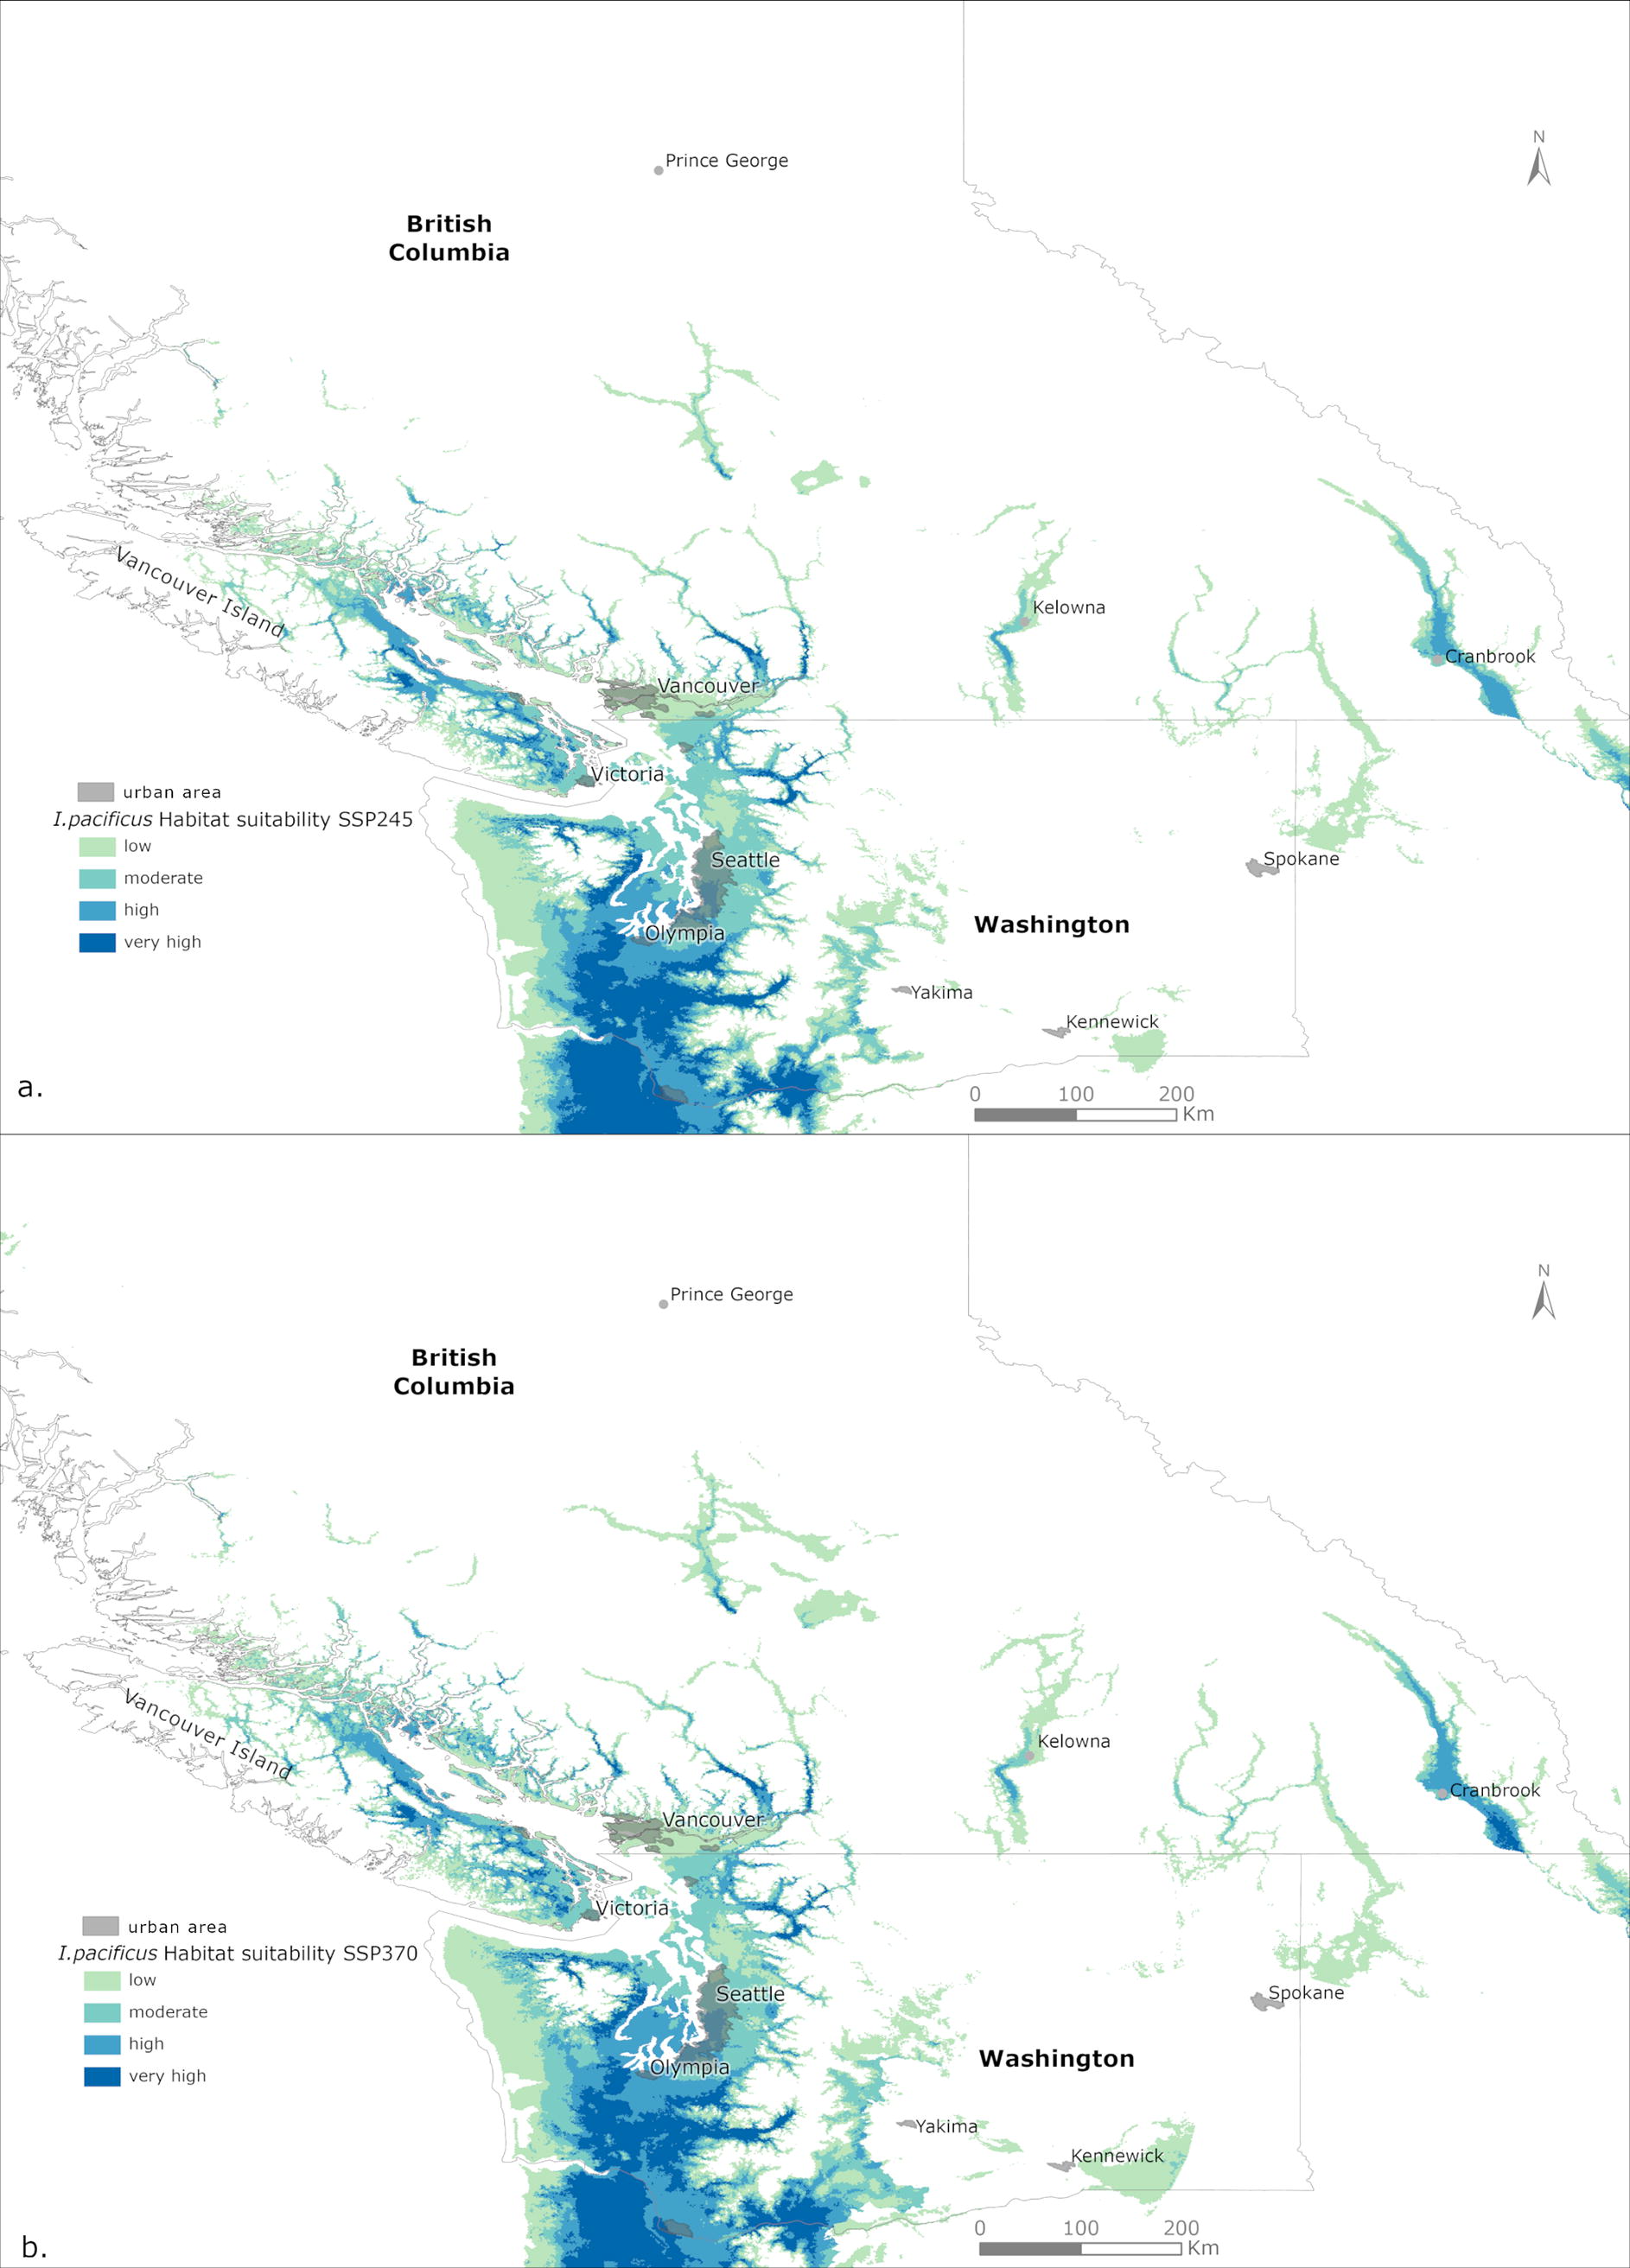
Ixodes pacificus habitat suitability predicted under future climate (2041–2070) for “middle of the road” SSP245
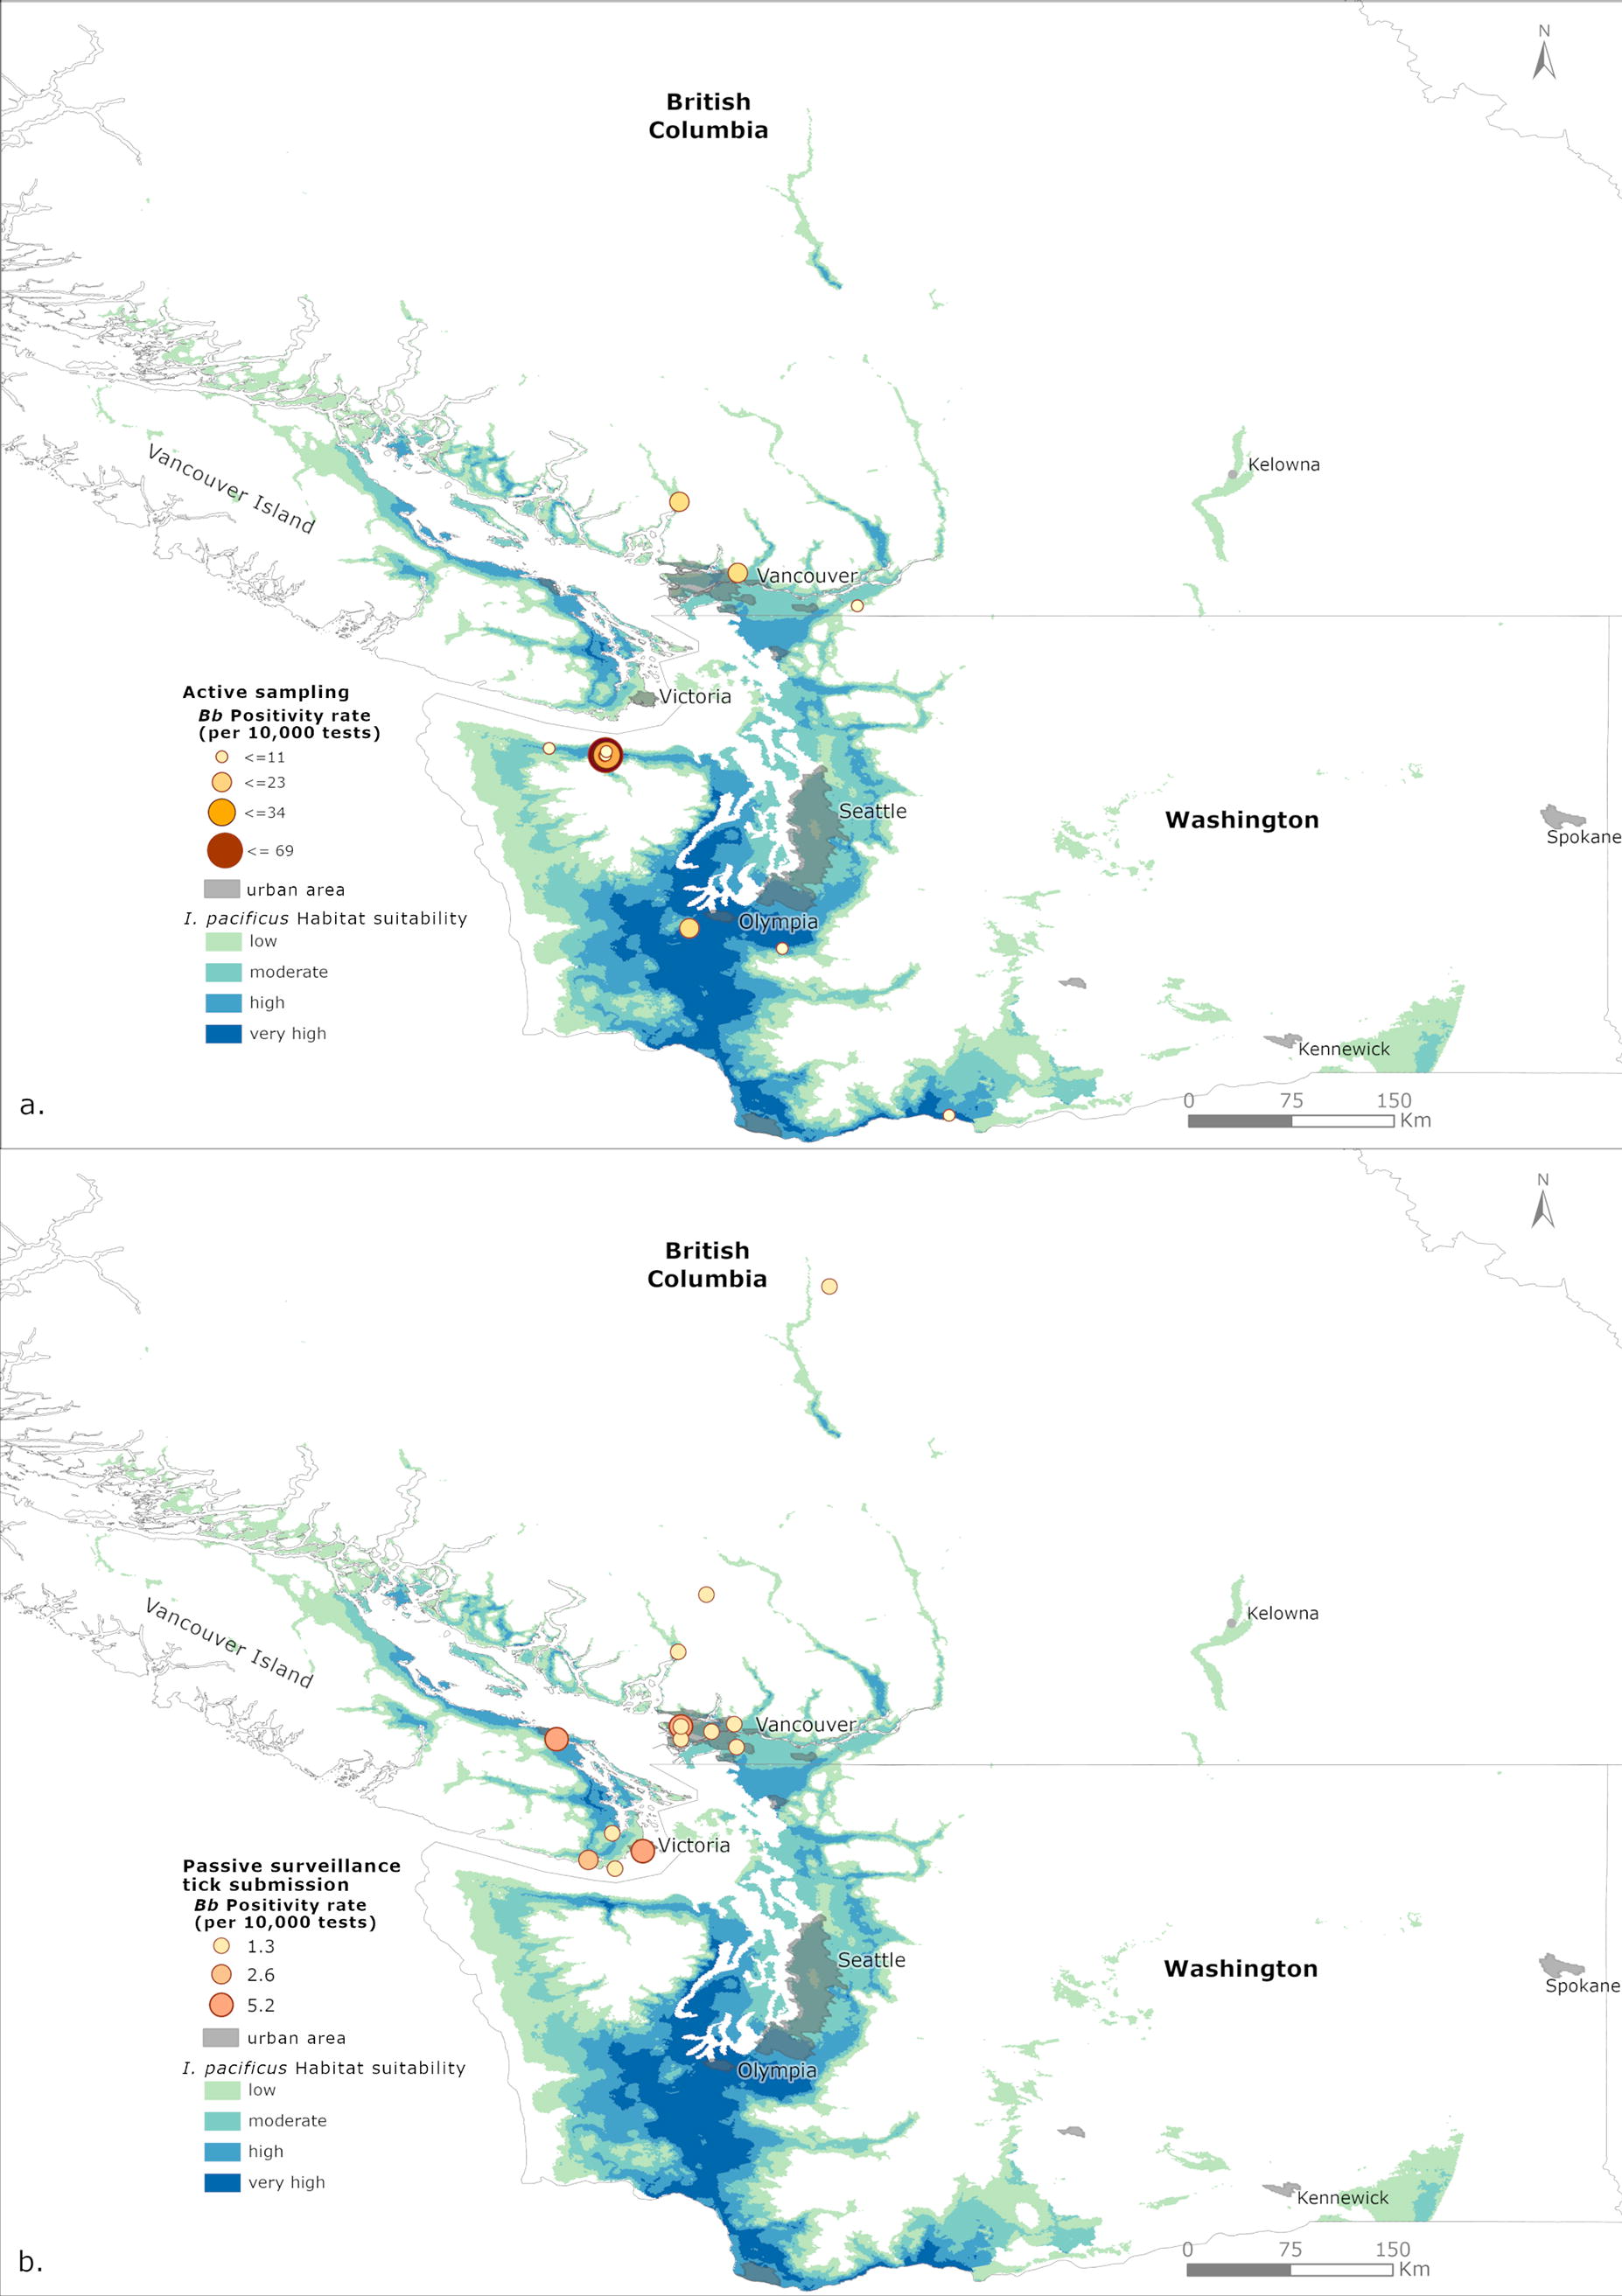
Maps of the Borrelia burgdorferi (Bb) positivity rate calculated per 10,000 tests for the
Discussion
Current MaxEnt models indicate low to very high habitat suitability for I. pacificus along Vancouver Island, coastal regions, and inland valleys within British Columbia. These results are consistent with Mak et al. (2010) and surveillance data from British Columbia Center for Disease Control (BCCDC, Vancouver, BC). However, our study primarily predicted the coastal areas of Vancouver Island to be potentially suitable habitat for I. pacificus, whereas Mak et al. (2010) predicted a greater extent of the island and identified a larger network of inland valleys as suitable habitats for I. pacificus. Mak et al. (2010) used tick presence points from passive surveillance data, which may have contributed to greater predictions within the inland valleys. A limitation of using passive tick information for modeling is inadvertent inclusion of false occurrence points (e.g., a submitted tick from a human or animal with travel from a distant region), which may result in a more expansive geographic range for I. pacificus. For this reason, our current study used only active sampling data, and we included field sample data from WA State to increase the number of location points for the modeling. Furthermore, the different modeling methods and the difference in predictors and climatic normals (1970–2000 vs. 1981–2010) may account for the observed differences in predicted suitable habitat. The different environmental conditions described in these studies may have resulted in the identification of two different sets of predictors for I. pacificus.
In Washington State, MaxEnt models were also consistent with previous studies. Hahn et al. (2016) and Porter et al. (2021) identify climatic variables during the coldest seasons as important predictors of habitat suitability for I. pacificus. It is worth noting that our study and Porter et al. (2021) used presence points consisting mostly of I. pacificus adults. Our models identified environmental and climatic predictors from across different seasons, differing slightly from the results of Porter et al. (2021) using available surveillance data. The use of a dataset that incorporated tick submissions from BC and WA and the differing sources of bioclimatic variables between our study and that of Porter et al. (2021) may account for these discrepancies. Regardless, these differences also indicate a need for further studies that clarify the apparent variation in host-seeking activities for I. pacificus.
In terms of future projections, our results follow a similar trend indicating an expansion in the total suitable habitat of I. pacificus along western North America (Hahn et al., 2016; Porter et al., 2021). Previous studies indicated that increases in temperature and humidity due to climate change may expand the northern geographic limits of I. scapularis (Ogden et al., 2006; Ogden et al., 2008) while expanding the geographic range of I. pacificus (Hahn et al., 2016; Porter et al., 2021). As temperature and moisture will change, I. pacificus will find new areas suitable for its survival, especially along the coasts, on Vancouver Island and within inland valleys. It is tempting to say that I. pacificus will experience a similar northern expansion as I. scapularis and move from western United States to British Columbia, but further studies are needed to delineate the effects of climatic factors on the life cycle of I. pacificus and associated host–vector interactions in the Pacific Northwest. Most studies focusing on the effects of climate on the I. pacificus life cycle have been done in California, where vastly different climates between the northern and southern regions of the state have already resulted in substantially different life cycles for I. pacificus located in these regions (MacDonald and Briggs, 2016). There is a dearth of similar studies conducted in the Pacific Northwest, which has a climatic environment that is markedly different from California. Additionally, previous studies have indicated the potential of migratory birds in facilitating the northern expansion of both I. pacificus and I. scapularis (Morshed et al., 2005; Ogden et al., 2015) as well as the effects of climate on host-seeking tick activity (Eisen et al., 2002; Padgett and Lane, 2001), yet the role of climate in host availability has not been well studied in our region.
MaxEnt models with the highest performance statistics indicated that NFFD_wt, CMI_sm, or CMD_sm, Tave_sp, Tmin_at, and EcoRegion3 are the most relevant environmental variables in predicting the geographic range of I. pacificus. Humidity and temperature are major factors affecting tick abundance, with greater I. pacificus densities documented in relatively cooler and wetter environments (Eisen et al., 2002; Eisen et al., 2004a; Nieto et al., 2010; MacDonald and Briggs, 2016; Hacker et al., 2021). Additionally, tree cover and leaf litter present in highly forested areas protect I. pacificus from desiccation and harsh sunlight (Kramer and Beesley, 1993; Li et al., 2000; Eisen et al., 2004a and Eisen et al., 2004b; Padgett and Bonilla, 2011; Dingler et al., 2014; Billeter et al., 2017). The ecoregions containing the most suitable habitats for I. pacificus are mostly characterized by either highly forested areas or proximity to the coast. Tick abundance is generally higher in such forested areas as they provide more surface ground cover and canopy cover than chaparral habitats (Lane and Loye, 1989; Newman et al., 2015; Hacker et al., 2021). Such environments provide moderate temperatures favorable to local tick communities (MacDonald et al., 2017). Coastal habitats have also observed greater tick burdens among small mammal hosts than in areas with hotter and drier climates (MacDonald et al., 2020). The higher humidity and more stable temperatures present in coastal environments can be favorable for questing I. pacificus (MacDonald et al., 2020). However, it should also be noted that while ecoregions may serve as a suitable proxy for flora and fauna given the sheer size of the study area, they may not be able to illustrate suitable habitats for I. pacificus at a finer, more local scale given their resolution limits. While the ensemble models predicted the geographic range of I. pacificus with relatively high accuracy, it should be noted that ticks from BC were collected through rodent trapping, whereas those from WA were collected by dragging. Dragging methods usually collect questing ticks whereas rodent trapping collects feeding ticks. In the context of mapping geographic distributions, rodent trapping may be more desirable than dragging if hosts can efficiently collect ticks (Ginsberg and Ewing, 1989). This distinction is especially evident in the case of the white-footed mouse (Peromyscus leucopus), the primary host of I. scapularis subadults known to contain heavy tick burdens (Piesman and Spielman, 1979; Carey et al., 1980). I. pacificus subadults in California exhibit a strong preference for western fence lizards (Lane and Loye 1989; Tälleklint-Eisen and Eisen, 1999). However, such strong host–vector associations have not been established yet in the present study area.
The uncertainty in certain predictors used in the study may have also affected the accuracy of our models. Particularly, NFFD_wt, CMI_sm, and CMD_sm are all calculated predictors rather than directly measured such as Tave_sp and Tmin_at (Wang et al., 2016). Directly measured predictors are generally more desirable than derived predictors. Future environmental variables are also based on projections, hence future predictions build on the uncertainty already present in our models.
The MaxEnt models built in this study are useful for predicting the geographic range of I. pacificus; however, the models may not be particularly helpful in quantifying Lyme disease risk. The B. burgdorferi positivity rate among I. pacificus in BC and WA ranges from less than 1% to 7% (Dykstra et al., 2020; Morshed et al., 2021), whereas the B. burgdorferi positivity rates among I. scapularis ticks in highly endemic areas of northeastern Canada and United States of America exceed 30% (Feldman et al., 2015; Burrows et al., 2021). Thus, encountering I. pacificus may not necessarily imply a heightened risk in contracting Lyme disease.
Additional factors such as local hosts and proximity to human populations can also contribute to Lyme disease risk. For instance, one active sampling site was in an area that has established chipmunk populations and relatively low lizard numbers in relation to other sampling sites (Dykstra et al, 2020). Previous studies have shown that chipmunks (Tamias sp.) may serve as competent hosts for both I. pacificus and B. burgdorferi (Slajchert et al., 1997; Foley and Nieto, 2011; Marsot et al., 2013), which may explain the high positivity rate observed in this sampling site (Fig. 3a). However, the sampling site is inaccessible to the public, hence the risk of being exposed to B. burgdorferi is extremely low.
Further studies elucidating the sylvatic maintenance of B. burgdorferi in this region of North America are needed to provide a more comprehensive picture of Lyme disease risk in the Pacific Northwest.
Conclusion
Ensemble models derived from active surveillance data predict the southern coastal regions and inland valleys of BC and the Puget Lowlands of WA to be the most suitable habitats for I. pacificus. Midcentury projections indicate an expansion, especially of low and moderate suitability, from current projections. According to these projections, the total suitable habitat area for I. pacificus would expand further in the interior regions of British Columbia and Washington State.
Regarding Lyme disease risk, I. pacificus from both active and passive surveillance that have tested positive for B. burgdorferi were in areas of moderate to very high suitability for I. pacificus. However, the risk remains small given relatively low infection rates among I. pacificus.
Future work incorporating specific host species and favored vegetation of both hosts and ticks can improve the quality of habitat suitability maps for I. pacificus. Additional sampling and testing of I. pacificus for B. burgdorferi would also aid in the development of more accurate Lyme disease risk maps.
Footnotes
Acknowledgments
We acknowledge the Zoonotic Diseases, Emerging Pathogens, and Parasitology Lab at the British Columbia Centre for Disease Control (BCCDC) and Washington State Department of Health, Olympia, Washington, USA, for conducting field sampling, identification, and testing of ticks in BC and WA, respectively. We would like to thank our climate experts T. Murdock and C. Mahony, and the members of the Tick and Climate Change - 3 West project for their insights.
Authors’ Contributions
I.C.: Conceptualization; data curation; formal analysis; investigation; methodology; software; visualization; writing (original draft); writing (review and editing). C.D.: Conceptualization; data curation; formal analysis; investigation; methodology; software; writing (original draft); writing (review and editing). S.M.: Conceptualization; data curation; investigation; resources; writing (review and editing). E.D.: Data curation; investigation; resources; writing (review and editing). E.F.: Funding acquisition; project administration; resources; writing (review and editing). M.M.: Data curation; investigation; writing (review and editing). S.I.: Project administration; writing (review and editing). S.C.: Writing (review and editing). S.C.: Conceptualization; funding acquisition; project administration; resources; supervision; writing (original draft); writing (review & editing).
Author Disclosure Statement
No conflicting financial interests exist.
Funding Information
This study was funded by the
Supplementary Material
Supplementary Figure S1
Supplementary Figure S2
Supplementary Table S1
Supplementary Table S2
Supplementary Table S3
References
Supplementary Material
Please find the following supplemental material available below.
For Open Access articles published under a Creative Commons License, all supplemental material carries the same license as the article it is associated with.
For non-Open Access articles published, all supplemental material carries a non-exclusive license, and permission requests for re-use of supplemental material or any part of supplemental material shall be sent directly to the copyright owner as specified in the copyright notice associated with the article.