




Abstract
After initiation of highly-active antiretroviral therapy (HAART), long-term HIV-infected hemophilia patients have been shown to lose autoantibodies against CD4+ peripheral blood leukocytes (PBL), suggesting that HAART induces autoimmunity-blocking mechanisms. We compared cytokine levels and subpopulations of lymphocytes and dendritic cells (DC) in the blood of 40 long-term HIV+ patients with those of 13 long-term HIV– hemophilia patients; 23 HIV+ patients had a detectable retroviral load. Cell subsets were determined using flow cytometry and cytokine levels were measured using ELISA. HIV+ patients showed higher proportions of DC subpopulations with immunostimulatory phenotypes (p < 0.01), CD8+ PBL (p < 0.001), and IL-2 (p < 0.001) and sIL-2R plasma levels (p = 0.002) than HIV– patients. They also exhibited increased proportions of T PBL with immunosuppressive phenotypes such as CD3+CD4+CD25+Foxp3+ (p = 0.001), and CD3+CD8+CD28–Foxp3+ PBL (p < 0.001), and a decreased IL-7R expression on CD3+CD8+ PBL (p = 0.001) compared to HIV– patients. Frequencies of CD3+CD4+CD25+ PBL producing IL-2, IL-4, IL-10, IL-12, and/or IFN-γ, and of CD3+CD4+CD28– PBL secreting IL-2 and/or IL-4 were lower in HIV+ than in HIV– patients (p ≤ 0.02). Proportions of CD4+ PBL coated with IgG, IgM, and C3d were similar in HIV+ and HIV– patients (p = n.s.). However, the proportion of CD4+gp120+ PBL was higher in HIV+ patients (p = 0.002), and associated with low CD3+CD4+CD25+Foxp3+ PBL (p = 0.012). We conclude that long-term HIV-infected hemophilia patients on HAART show an adaptive immune response, presumably against HIV, in the presence of upregulated immunosuppressive T PBL, downregulated cytokine-producing CD4+ PBL, and downregulated IL-7R expression on CD8+ PBL. Increased immunoregulatory T PBL might decrease autoimmunity, thereby contributing to immunological reconstitution and stabilization of long-term HIV-infected hemophilia patients on HAART.
Introduction
Simultaneously, autoimmunity against CD4+ PBL decreased in the patients after initiation of HAART (17). In the pre-HAART era, our HIV+ hemophilia patients showed formation of autoantibodies against CD4+ lymphocytes associated with strong CD4+ PBL depletion and lymphocyte dysfunction (11,17,55). More than 10 y after initiation of HAART, only 3 of 40 HIV+ hemophilia patients exhibit autoimmunity against CD4+ lymphocytes, as demonstrated by the detection of IgG and gp120-containing immune complexes on more than 30% of circulating CD4+ PBL.
HIV+ patients whose immune systems recover during HAART can develop immune restoration disease (IRD) (25). Suppression of HIV replication by HAART often restores protective pathogen-specific immune responses, but in some patients the restored immune response is immunopathological and causes disease. Infections by mycobacteria, cryptococci, herpesviruses, hepatitis B and C virus, and JC virus are the most common pathogens associated with IRD. IRD can occur early or late after HAART initiation (25). Currently, none of our HIV+ hemophilia patients exhibits symptoms of IRD.
Our data suggest that more than 10 y after initiation of HAART, immunological reconstitution is associated with a strong Th-1 activation in combination with a downregulation of autoimmunity and non-occurrence of IRD. We speculate that immunoregulatory DC and PBL block autoimmunity and development of IRD. However, this hypothesis is difficult to prove because there are no DC, regulatory T cell (Treg), or T suppressor cell (Ts) measurements available from the pre-HAART era, when autoimmunity in HIV+ hemophilia patients was high.
In a previous study, we analyzed immunoregulatory mechanisms and found in HIV+ hemophilia patients and in healthy controls similar proportions of DC subsets with DC1 and DC2 qualities, similar proportions of T PBL with a Treg phenotype, and increased proportions of T PBL with Ts phenotype (18). However, healthy controls do not suffer from chronic HBV and HCV infection, and do not receive regular substitution with immunostimulatory clotting factor preparations. HIV– hemophilia patients are therefore a more appropriate control group for examining the immunological reconstitution of HIV+ hemophilia patients, and the mechanisms that might contribute to the disappearance of autoimmunity. Both patient groups had been substituted with similar, in part virus-contaminated, clotting factor preparations for a similar period of time. Most of our HIV+ and HIV– hemophilia patients are chronically infected with HCV, HBV, CMV, and EBV (19). The comparison of HIV+ with HIV– hemophilia patients provides the opportunity to identify HAART-induced immunoregulatory mechanisms that might have contributed to the disappearance of autoimmunity in HIV+ patients.
In the present study, we investigated in HIV+ and HIV– hemophilia patients with similar duration of disease their blood DC subpopulations with immunostimulatory (CD11c+CD83+CD40+IL-12+ DC, lineage– HLA-DR+CD11c+CD123– precursor [p] DC1, and HLA-DR+CD11c+CD123–IL-12+ DC) or immunosuppressive phenotypes (CD11c+CD83+CD40+IL-10+, lineage– HLA-DR+CD11c–CD123+ pDC2, and HLA-DR+CD11c–CD123+IL-10+ DC). In addition, PBL with the phenotype of Treg (CD3+CD4+CD25+Foxp3+) or Ts cells (CD3+CD8+CD28–Foxp3+) were also examined (4,7,27,36,46).
Patients and Methods
HIV+ and HIV– hemophilia patients
In this study we investigated 40 long-term HIV-infected hemophilia patients and 13 HIV– hemophilia patients followed over a similar period of time. The patients were infected with HIV at the end of the 1970s and in the early 1980s by virus-contaminated clotting factor products, and are part of an ongoing long-term study. The patients were male HIV+ patients with a mean age of 39.9 ± 8.8 y (range 23–63 y), and HIV– patients aged 36.2 ± 3.2 y (range 32–42 y) (p = 0.137), and these two patient groups with congenital hemophilia A received clotting factor preparations for a similar period of time, and had a similar risk of acquiring chronic virus infections during the 1970s and 1980s. Since 1996, HIV+ patients have been treated with HAART, consisting of combinations of nucleoside and non-nucleoside analogues and protease inhibitors. At the time of the investigation, 17 HIV+ patients had a retroviral load below the detection limit of the test (<20 HIV-1 RNA copies/mL), and 23 patients had a retroviral load of 30–120,000 HIV-1 RNA copies/mL. All patients gave informed consent for the tests performed in this study. The study was approved by the local ethics committee and was conducted in adherence to the Declaration of Helsinki.
Determination of IL-10+ or IL-12+ CD11c+CD83+CD40+ DC
Preparation of assays
IL-10+ DC and IL-12+ DC numbers were determined in freshly obtained heparinized whole blood using four-color fluorescence flow cytometry as previously described (18,19). Monoclonal antibodies conjugated with fluorescein isothiocyanate (FITC), phycoerythrin (PE), Cy-Chrome, and allophycocyanin (APC) were used. The amount of monoclonal antibody (mAb) used for the assays corresponded with the recommendation of the manufacturer, and refers to the original dilution of the mAb in the purchased flask. Three tubes were prepared for each test. Tube A served as an isotype control, tube B was used for the determination of IL-12+ DC, and tube C was used for the determination of IL-10+ DC. First, 20 μL of mouse-IgG1/FITC (BD Biosciences, Heidelberg, Germany), 20 μL of rat-IgG1/PE (BD Biosciences), 10 μL of mouse-IgG2b/APC (BD Biosciences), and 5 μL of mouse-IgG1/Cy-Chrome (BD Biosciences) were pipetted into tube A. Tubes B and C contained 20 μL of CD83/Cy-Chrome, 5 μL of CD11c/APC, and 20 μL of CD40/FITC (all from BD Biosciences). Then 100 μL of freshly obtained heparinized whole blood was added to each tube, and the tubes were vortexed and incubated for 30 min at 22°C in the dark. Thereafter, 2 mL of FACS lysing solution (diluted 1:10 with aqua dest; BD Biosciences) was pipetted into each tube, the tubes were vortexed, incubated for 10 min at room temperature in the dark, and centrifuged at 200 × g for 8 min. The supernatant was removed, 2 mL phosphate-buffered saline (PBS) (Gibco) containing 0.1% NaN3 and 1% fetal calf serum (Promocell, Heidelberg, Germany) was added, and the tubes were centrifuged at 200 × g for 8 min. The supernatant was removed and the cell membranes were permeabilized by adding 500 μL Perm2 solution (diluted 1:10 with aqua dest; BD Biosciences). The tubes were incubated for 10 min at 22°C in the dark, 2 mL of PBS was added, and the tubes were centrifuged at 200 × g for 8 min. The supernatant was removed and 20 μL of mouse-anti-human-IL-12/PE (BD Biosciences) was added to tube B, and 5 μL of rat-anti-human-IL-10/PE (BD Biosciences) was added to tube C. After incubation for another 30 min at 22°C in the dark, 2 mL of PBS was added to tubes B and C, the tubes were centrifuged at 200 × g for 8 min, and the supernatant was removed. Then 500 μL of formaldehyde was added to each tube and the assays were analyzed immediately using a FACScalibur flow cytometer (BD Biosciences).
Gating procedure
The gating strategy was extensively described previously (18). Briefly, dot plots of the isotype controls in tube A were adjusted to approximately 0.1% double-stained cells. This standard gate setting was used for subsequent measurement of all patient and control samples. As for all further DC and T subset determinations, 100,000 lymphocytes, monocytes, and granulocytes were gated in whole blood samples using forward/side-scatter gating. DC were analyzed using a CD83/CD11c dot plot, and double-stained cells were studied further using a CD40/IL-12 (tube B) or CD40/IL-10 dot plot (tube C). Double-stained cells were defined as the fraction of IL-12+ or IL-10+ DC cells, respectively, and their percentages were used for all further statistical analyses.
Determination of lineage– HLA-DR+CD11c+CD123– pDC1 and lineage– HLA-DR+CD11c–CD123+ pDC2
Preparation of assays
DC subsets were determined in freshly obtained heparinized whole blood using four-color fluorescence flow cytometry. We used 20 μL FITC-, PE-, or PE-Cy5-labeled mouse-IgG1 (BD Biosciences), and 20 μL PE- or APC-coupled mouse-IgG2b as isotype controls, and these were pipetted into tube A. Tube B contained mAbs against lineage (10 μL CD3/PE, 10 μL CD14/PE, 10 μL CD16/PE, and 10 μL CD19/PE), CD11c (5 μL APC; BD Biosciences), HLA-DR, DP, DQ (20 μL FITC; BD Biosciences), and CD123 (20 μL PE-Cy5; BD Biosciences). Then 100 μL of freshly obtained heparinized whole blood was added to each tube and they were incubated for 30 min at 22°C. After incubation, 2 mL of FACS lysing solution (diluted 1:10 with aqua dest; BD Biosciences) was pipetted into each tube, then they were incubated for 10 min and centrifuged at 200 × g for 8 min. The supernatant was removed, 2 mL of PBS (Gibco) containing 0.1% NaN3 and 1% fetal calf serum was added, and the tubes were centrifuged again. Then 500 μL of PBS was added to each tube and the assays were analyzed immediately using a FACScalibur flow cytometer.
Determination of IL-12-producing HLA-DR+CD11c+CD12– DC and IL-10-producing HLA-DR+CD11c–CD123+ DC
In order to study IL-12 or IL-10 production in DC with a phenotype similar to pDC1 or pDC2, we determined in a separate assay HLA-(DR, DP, DQ)+CD11c+CD123–IL-12+ (similar to pDC1), and HLA-(DR, DP, DQ)+CD11c–CD123+IL-10+ (similar to pDC2) DC subsets.
Determination of PBL with Th-1, Th-2, Treg, or Ts phenotype
PBL with Th-1, Th-2, Treg, or Ts phenotype were determined using four-color fluorescence flow cytometry. Isotype control consisted of 20 μL of each of FITC-, PE-, PerCP- (peridinin-chlorophyll-protein), or APC-coupled mouse- and rat-IgG1 (BD Biosciences). For the determination of CD3+CD4+CD25+, CD3+CD4+CD28–, and CD3+CD8+CD28– lymphocytes, the mAbs CD3/FITC (20 μL; BD Biosciences), CD4/PerCP (20 μL; BD Biosciences), CD8/PerCP (20 μL; BD Biosciences), CD25/APC (5 μL; BD Biosciences), and CD28/APC (20 μL; BD Biosciences) were used. Intracellular cytokine production was measured using the mAbs IL-2/PE (20 μL; BD Biosciences), IL-12/PE (20 μL; BD Biosciences), IFN-γ/PE (20 μL; BD Biosciences), IL-4/PE (5 μL of a 1:100 dilution; BD Biosciences), and IL-10/PE (5 μL of a 1:100 dilution; BD Biosciences). Intracellular Foxp3 expression was determined using Foxp3/PE (20 μL; NatuTec, Frankfurt, Germany) mAb. In addition, IL-7R expression on CD3+CD4+ and CD3+CD8+ lymphocytes was investigated using anti-CD127/PE (20 μL; BD Biosciences). The gating procedures are described in Fig. 1.
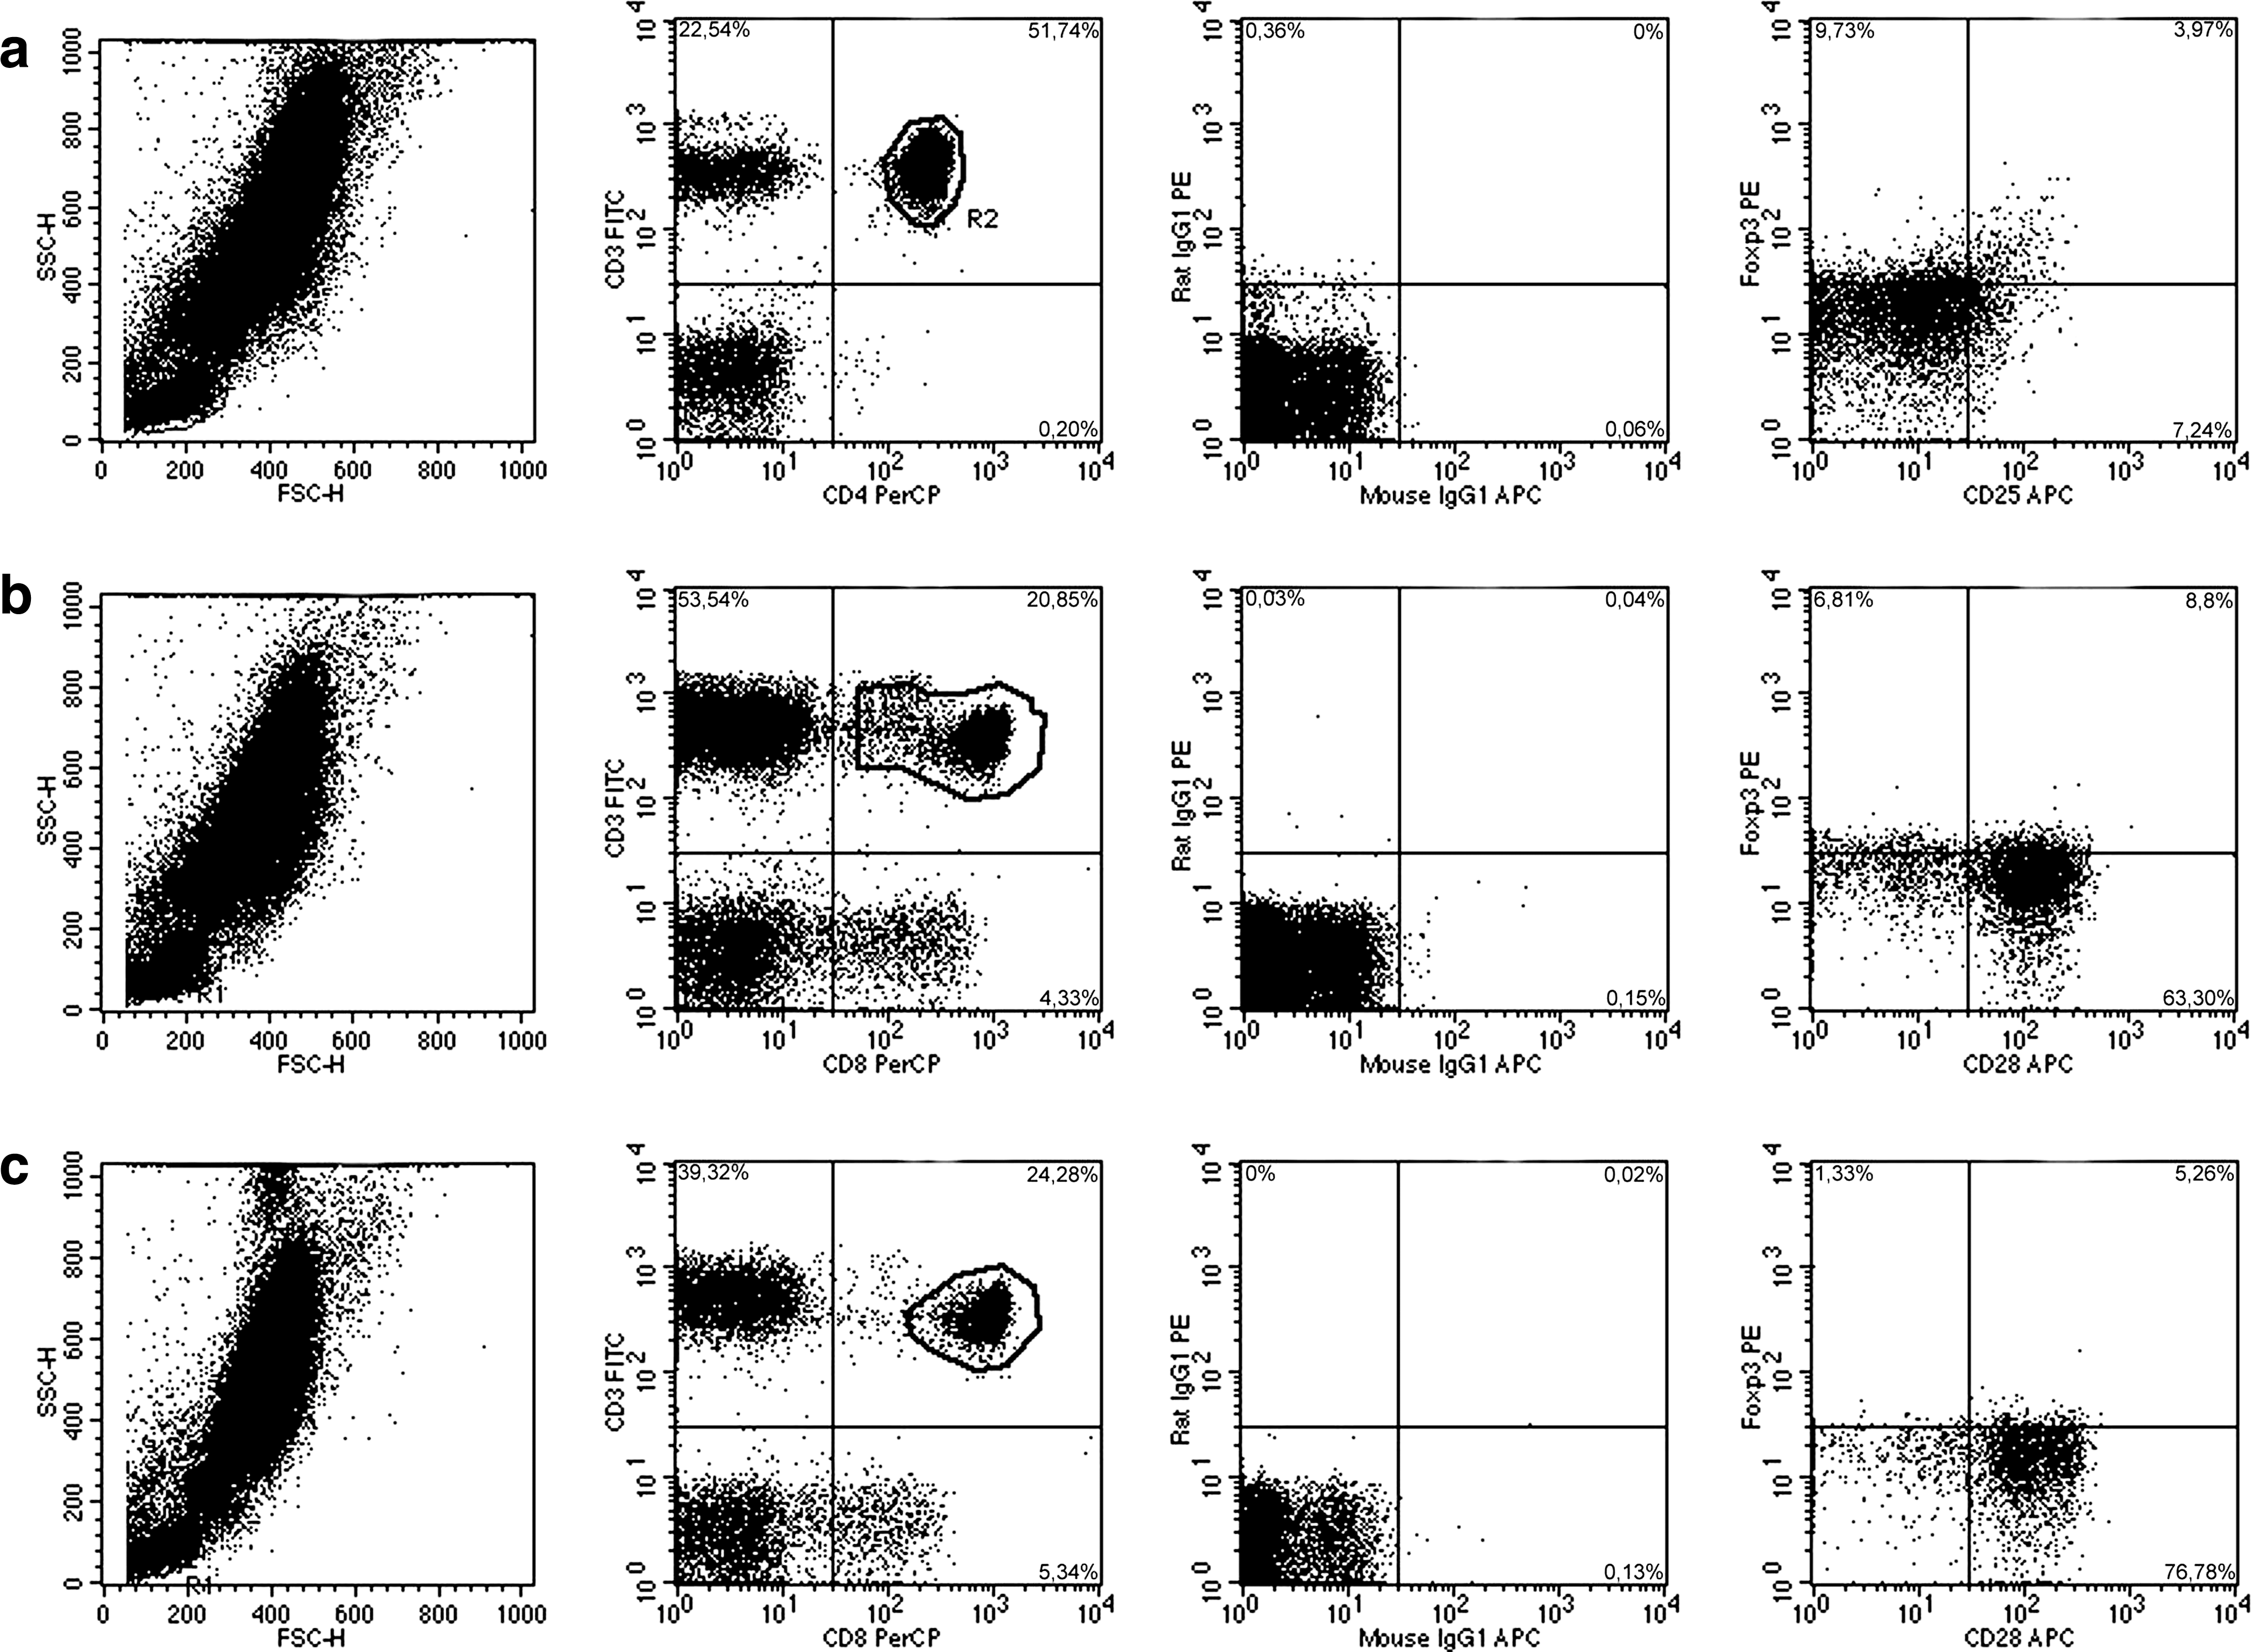
Gating procedure of Treg and Ts in 3 HIV– hemophilia patients. We analyzed 100,000 lymphocytes, monocytes, and granulocytes in heparinized whole blood in a forward (FSC-H)/side-scatter (SSC-H) dot plot. Lymphocytes were gated. (
Determination of plasma cytokines, soluble cytokine receptors, and soluble cytokine receptor antagonists
Levels of plasma-soluble interleukin-1 receptor antagonist (sIL-1RA), IL-2, sIL-2R, IL-3, IL-4, IL-6, sIL-6R, IL-10, transforming growth factor-β2 (TGF-β2), IFN-γ, and tumor necrosis factor-α (TNF-α) were determined by ELISA. sIL-1RA, IL-2, sIL-2R, IL-3, IL-4, IL-6, sIL-6R, IL-10, TGF-β2, and TNF-α were measured using Quantikine kits (R&D Systems, Wiesbaden, Germany), and IFN-γ was measured using HBT kits (Holland Biotechnology BV, Biermann, Bad Nauheim, Germany). Plasma was flash frozen within 2 h after the blood was drawn and it was stored at −30°C until testing.
Plasma neopterin
Plasma neopterin was measured with the Neopterin-ELItest assay (Brahms Diagnostics, Berlin, Germany). Based on control measurements in 70 healthy individuals, a plasma neopterin level >15 nmol/L was considered abnormally high.
Determination of lymphocyte subpopulations
CD3+CD16–56–CD19–CD45+, CD3–CD16+56+CD19–CD45+, CD3–CD16–56–CD19+CD45+, CD3+CD4+CD8–CD45+, and CD3+CD4–CD8+CD45+ lymphocyte subsets were defined in 50 μL of heparinized whole blood using four-color fluorescence flow cytometry and antibodies purchased from Becton Dickinson/Pharmingen (BD Biosciences) (18).
Determination of Ig, IgM, IgG, C3d, and gp120 on CD4+ and CD8+ T lymphocytes
The proportion of immunoglobulin-positive CD4+ cells in peripheral blood was determined using double fluorescence flow cytometry. First, 100 μL of whole blood was incubated with 10 μL PE-conjugated anti-CD3, anti-CD4, or anti-CD8 (all from BD Biosciences) mAb for 30 min at 4°C. Erythrocytes were lysed by the addition of NH4Cl solution for 15 min, the cells were washed with PBS, and 50 μL FITC-labeled goat-anti-human-Ig (Medac, Hamburg, Germany), goat-anti-human-IgG (Tago, Burlingame, CA), goat-anti-human-IgM (Medac), rabbit-anti-human-C3d (Dakopatts, Hamburg, Germany), or 10 μL sheep-anti-gp120 (Biochrom, Berlin, Germany) was added. Sheep-anti-gp120 was used undiluted, and the other antibodies were diluted 1:40. The cells were incubated for another 30 min at 4°C, washed, and analyzed by flow cytometry (FACScan; Becton Dickinson, Heidelberg, Germany). The gate setting for background staining was adjusted to less than 1% CD3+IgG+ control lymphocytes, and this gate was used for all subsequent analyses. We tested blood samples from 150 healthy controls in parallel, and they showed a median (interquartile range) of CD3+IgG+ 1.0% (0%), CD4+IgM+ 1.0% (1%), CD4+IgG+ 1.0% (1%), CD4+C3d+ 5.0% (5%), CD4+gp120+ 1.0% (1%), CD8+IgM+ 2.0% (3%), CD8+IgG+ 2.0% (4%), and CD8+C3d+ 15.0% (10%) lymphocytes in the blood. Test results of >30% double-stained cells were defined as autoantibody- or immune complex-positive.
Determination of HIV-1 RNA copies in plasma
HIV-1 RNA was measured using the NucliSens HIV-1 QT kit (Bio Merieux, Nürtingen, Germany). According to the manufacturer's instructions, HIV-1 RNA was quantified using a 1-mL plasma sample. Sensitivity of the assay is 20 copies using 1-mL samples of plasma.
Statistical analysis
The Wilcoxon rank sum test and chi-square test were used for statistical analysis with SPSS software (SPSS Inc., Chicago, IL). Adjustment for multiple testing was done according to the method of Bonferroni. p Values of <0.01 were considered significant and are shown in bold type in the tables.
Results
Absolute numbers of lymphocyte subsets in HIV+ and HIV– hemophilia patients
HIV+ hemophilia patients had lower CD4+ (p < 0.001) but higher CD8+ PBL absolute counts (p = 0.011) than HIV– hemophilia patients, suggesting that lower CD4+ cell counts are sufficient for a strong cellular immune response (Table 1). Mean CD8+ PBL counts in HIV+ patients were twice as high as those in HIV– hemophilia patients. HIV+ patients had lower absolute counts of CD3+CD4+ PBL expressing CD25+IL-2+, CD28–IL-2+, CD28–IL-4+, CD25+Foxp3+, and IL-7R+ (p = 0.002, p < 0.001, p = 0.004, p < 0.001, and p < 0.001, respectively), and higher absolute counts of CD3+CD8+ PBL expressing CD28–Foxp3+ (p < 0.001). The deficit in Tregs and IL-2-producing CD4+ subsets, and the elevated number of PBL with a Ts phenotype may be attributable to the decrease in CD4+ and increase in CD8+ PBL absolute counts. We therefore focused on the relative proportions of the different cell subpopulations, which probably reflect differences in cell activation more adequately than absolute counts.
Only T subset and plasma cytokine levels showing a difference of p ≤ 0.01 are included here.
Data are given as median with interquartile range in brackets. Adjustment for multiple testing was done according to the method of Bonferroni. p Values <0.01 were considered significant and are shown in bold type.
Relative proportions of cell subsets in HIV+ and HIV– hemophilia patients
HIV+ patients showed higher proportions of circulating DC subsets with immunostimulatory qualities than HIV– patients. Proportions of IL-12+CD40+ within CD11c+CD83+ DC, IL-12+CD123– within HLA-DR+CD11c+ DC, and CD11c+CD123– within lineage– HLA-DR+ pDC1 were higher in HIV+ than HIV– hemophilia patients (p = 0.003, p = 0.003, and p < 0.001, respectively) (Table 1). Percentages of DC with an immunosuppressive DC2 phenotype were similar in the two patient groups (IL-10+CD40+ within CD11c+CD83+ DC, IL-10+CD123– within HLA-DR+CD11c+ DC, and CD11c–CD123+ within lineage– HLA-DR+ pDC2; p = n.s.). Due to the domination of immunostimulatory DC subsets, the pDC1/pDC2 ratio was higher in HIV+ patients (p < 0.001) (Table 1). These data suggest more of an increase in immunostimulatory DC in HIV+ than in HIV– hemophilia patients.
HIV+ patients had lower CD4+ PBL (p < 0.001) and higher CD8+ PBL proportions (p < 0.001) than HIV– patients. CD16+56+ NK cells were lower in HIV+ than in HIV– patients (relative: p = 0.004, absolute: p < 0.001), suggesting a stronger adaptive than innate immune response in HIV+ patients (Table 1).
Furthermore, IL-2 and IL-2R plasma levels were higher and TNF-α plasma levels were lower in HIV+ than in HIV– patients (p < 0.001, p = 0.002, and p < 0.001, respectively), indicating T-cell activation and impaired innate immunity in HIV+ patients (Table 1).
Simultaneously, percentages of Foxp3+CD25+ cells within CD3+CD4+ PBL, and of Foxp3+CD28– cells within CD3+CD8+ PBL, were higher in HIV+ than in HIV– patients (p = 0.001 and p < 0.001, respectively), suggesting more activation of suppressive Treg and Ts in HIV+ than in HIV– hemophilia patients (Table 1). Cytokine production in CD3+CD4+CD25+ and CD3+CD4+CD28– PBL of HIV+ patients was strongly impaired. HIV+ patients less frequently had CD3+CD4+CD25+ PBL with detectable IL-2, IL-4, IL-10, IL-12, and IFN-γ production (>0% CD3+CD4+CD25+cytokine+ PBL), and less frequently had CD3+CD4+CD28– PBL secreting IL-2 and IL-4 (>0% CD3+CD4+CD28– cytokine+ PBL) than HIV– patients (p < 0.001, p = 0.020, p = 0.009, p = 0.019, p = 0.020, p < 0.001, and p = 0.001, respectively) (Fig. 2) indicating an overall downregulation of cytokine production in CD4+ PBL of HIV+ patients compared to HIV– hemophilia patients. In contrast, the frequency of cytokine-producing CD3+CD8+CD28– PBL subsets (>0% CD3+CD8+CD28– cytokine+ PBL) was similar in HIV+ and HIV– patients (p = n.s.) (Fig. 2).
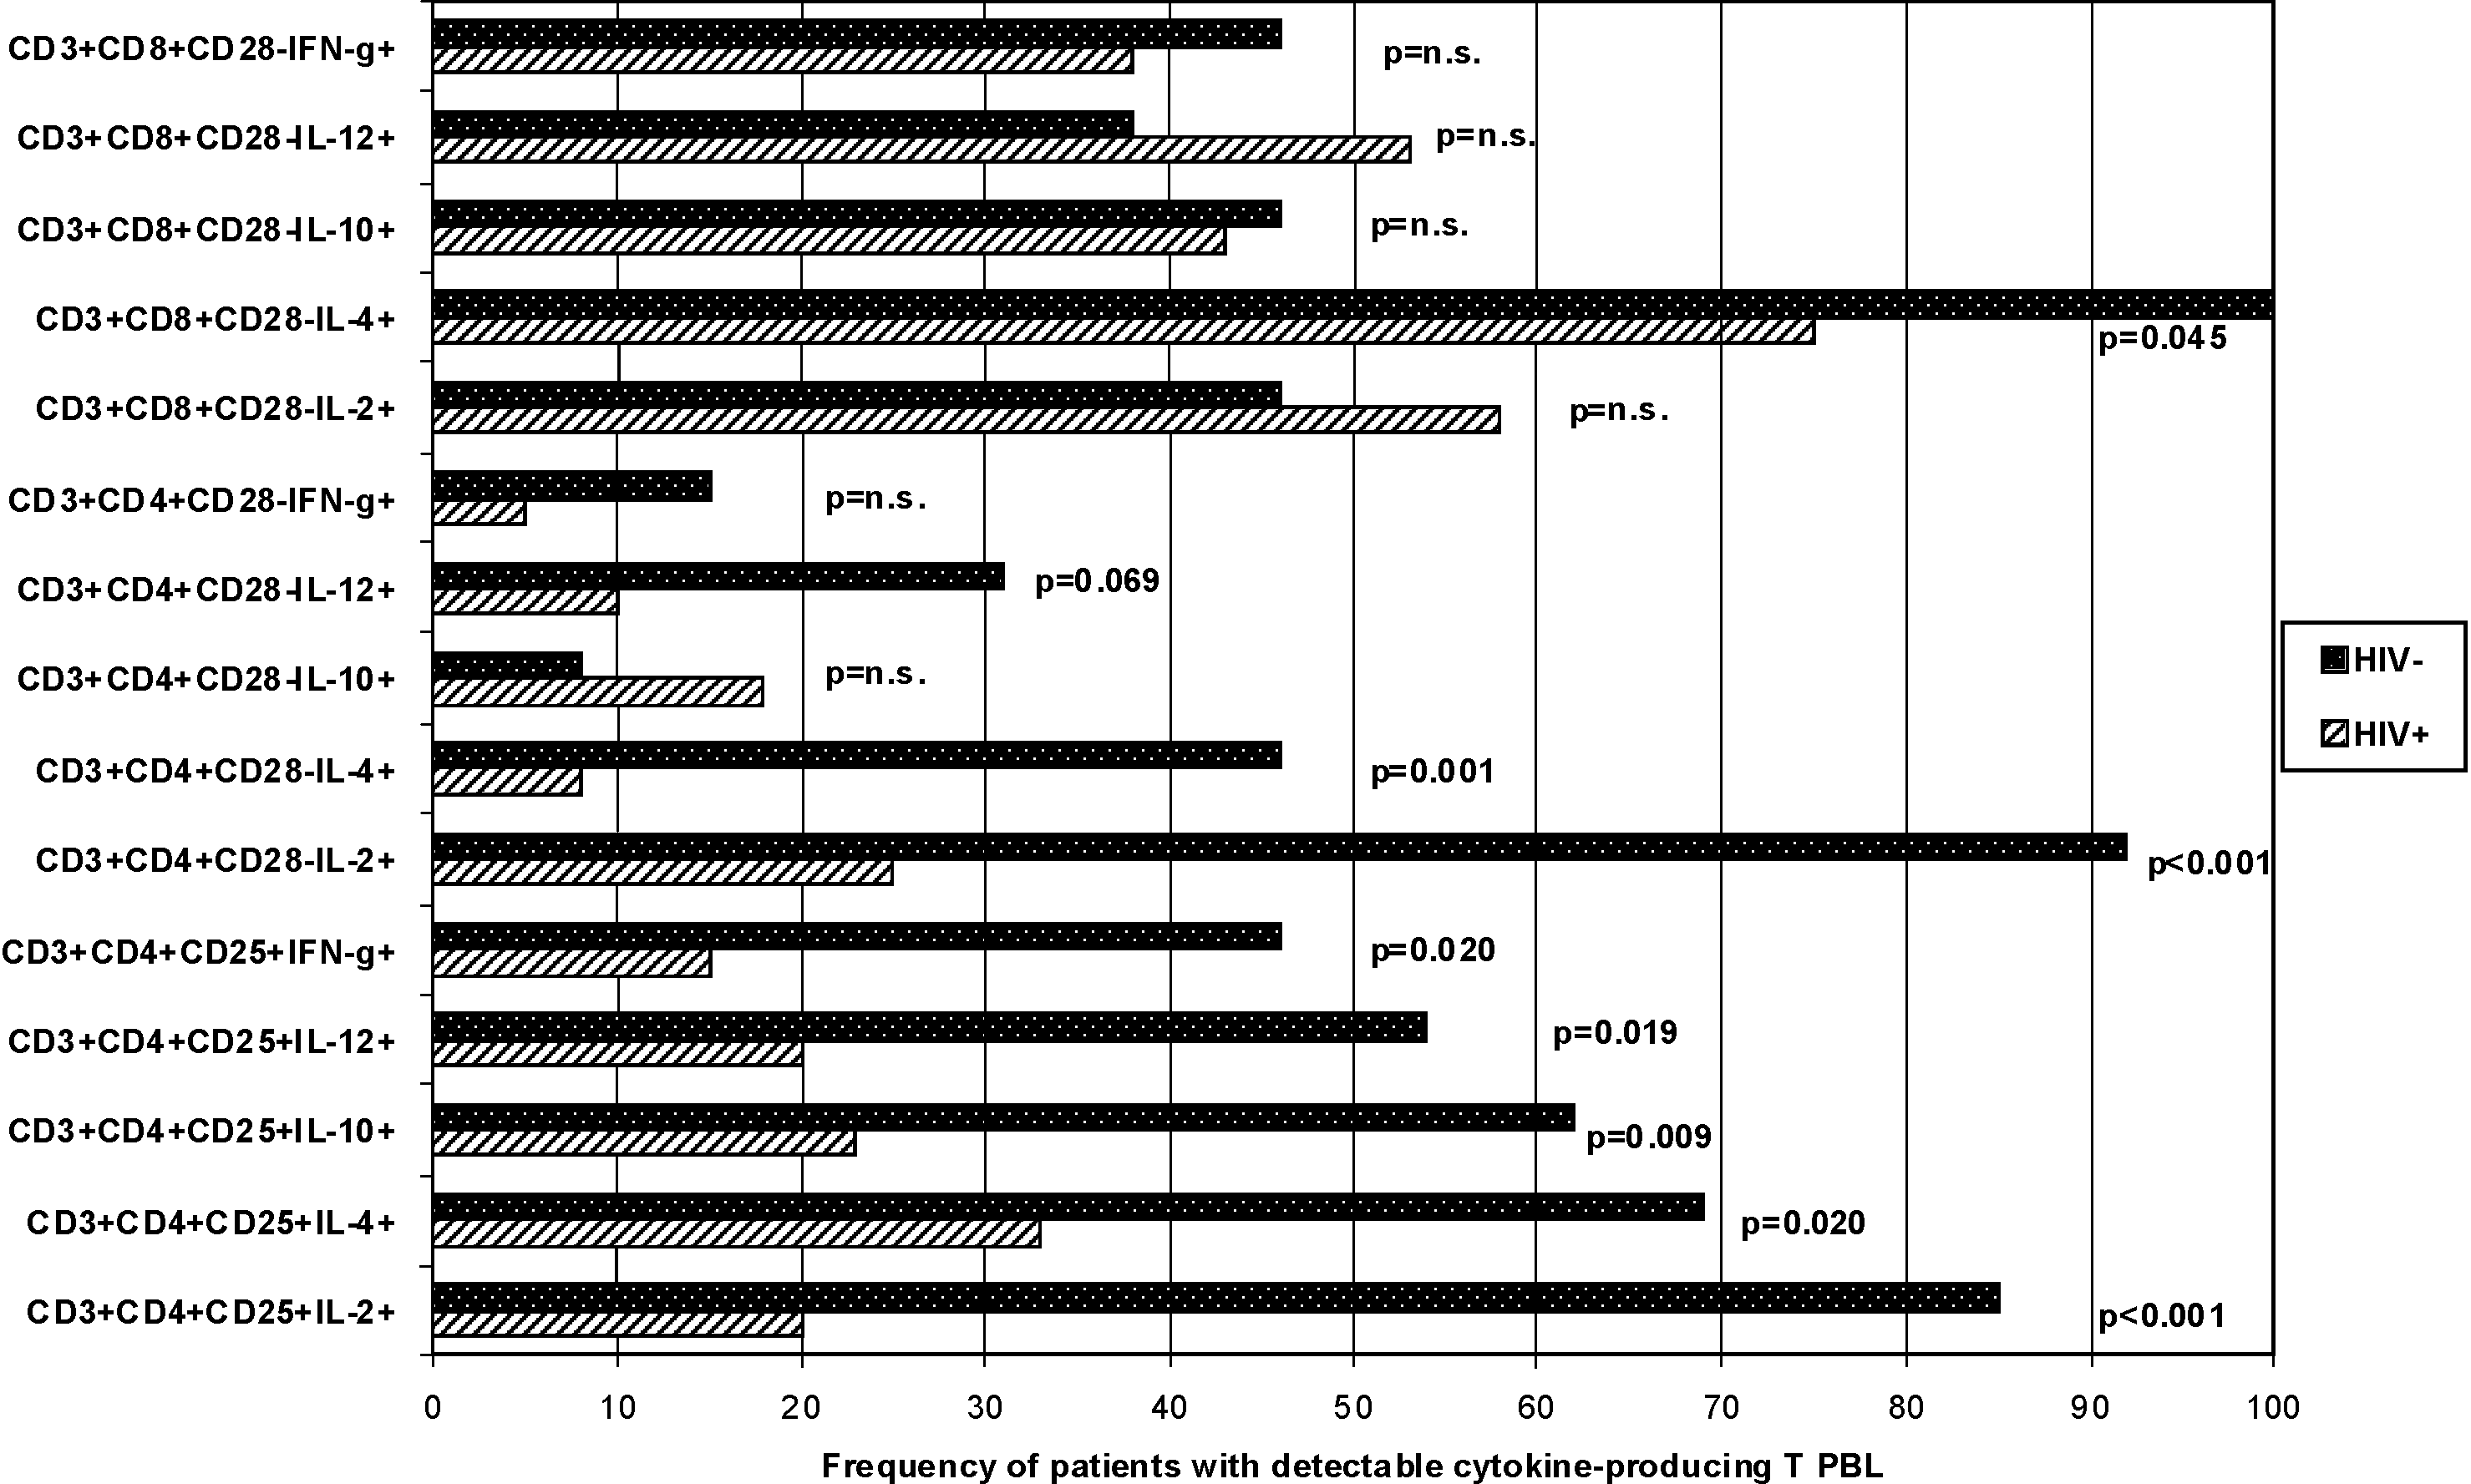
Frequency of HIV+ (n = 40) and HIV– (n = 13) hemophilia patients with cytokine-producing CD3+CD4+CD25+, CD3+CD4+CD28–, and CD3+CD8+CD28– PBL subsets. Cytokine production in CD3+CD4+CD25+ and CD3+CD4+CD28– PBL of HIV+ patients was strongly impaired. HIV+ patients less frequently had CD3+CD4+CD25+ PBL with detectable IL-2, IL-4, IL-10, IL-12, and IFN-γ production (>0% CD3+CD4+CD25+ cytokine+ PBL), and less frequently had CD3+CD4+CD28– PBL secreting IL-2 and IL-4 (>0% CD3+CD4+CD28– cytokine+ PBL) than HIV– patients (p < 0.001, p = 0.020, p = 0.009, p = 0.019, p = 0.020, p < 0.001, and p = 0.001, respectively) indicating an overall downregulation of cytokine production in CD4+ PBL of HIV+ patients compared to HIV– hemophilia patients. In contrast, the frequency of patients with cytokine-producing CD3+CD8+CD28– PBL subsets (>0% CD3+CD8+CD28– cytokine+ PBL) was similar in HIV+ and HIV– patients (p = n.s.).
The proportion of CD127+CD3+CD8+ PBL was lower in HIV+ than in HIV– patients (p = 0.001) indicating lower IL-7R expression on CD8+ PBL in HIV+ than in HIV– patients (Table 1).
IgM, IgG, and C3d load of CD4+ and CD8+ PBL were similar in HIV+ and HIV– patients (p = n.s), implying that production of autoreactive immune complexes against CD4+ and CD8+ PBL was similar in both patient groups. CD4+ PBL of HIV+ patients stained stronger with a fluorochrome-labeled anti-gp120 antibody than CD4+ PBL of HIV– patients (p = 0.002), indicating expression or attachment of HIV proteins on CD4+ PBL of HIV+ patients (Table 1). None of the HIV–, but 65% of the HIV+ hemophilia patients, had more than 2% CD4+gp120+ PBL. High numbers of HIV-1 RNA copies in the 23 patients with a detectable viral load were associated with high proportions of CD4+ PBL coated with IgG, IgM, C3d, and/or gp120 (r = 0.667, p = 0.001; r = 0.424, p = 0.044; r = 0.455, p = 0.029; and r = 0.408, p = 0.054, respectively), suggesting that the immune complex load of CD4+ PBL is induced by HIV.
Treg, Ts, and autoreactive immune complexes in HIV+ hemophilia patients
When CD4+ PBL showed coating with IgG, CD8+ PBL were also loaded with immune complexes in HIV+ (p < 0.001) and HIV– hemophilia patients (p < 0.01) (Table 2). In HIV+ patients, only an IgG load of CD4+ PBL was associated with high plasma neopterin and low plasma TGF-β2 (p = 0.013 and p = 0.004, respectively) suggesting monocyte/macrophage activation and presumably downregulation of TGF-β2-producing Treg in the few patients with immune complex-coated CD4+ PBL. Associations of high CD4+gp120+ PBL with high plasma IL-6 and low absolute numbers of CD3+CD4+CD25+Foxp3+ Treg (p = 0.007 and p = 0.012, respectively) (Table 2 and Fig. 3) support this interpretation. Fig. 3 shows the relationship of CD4+IgG+ and CD4+gp120+ PBL with CD3+CD4+CD25+Foxp3+ PBL in HIV+ hemophilia patients. Three patients had high CD4+gp120+ PBL (63%, 88%, and 92%), and these patients also had high CD4+IgG+ PBL (26%, 62%, and 89%), but low Treg counts (5/μL, 20/μL, and 1/μL CD3+CD4+CD25+Foxp3+ PBL, respectively) (Fig. 3). The retroviral loads of these patients were 62,000, <20, and 120,000 HIV-1 copies/mL plasma, and their CD4+ PBL counts were 13/μL, 382/μL, and 223/μL, respectively. Conversely, the patient with 170/μL CD3+CD4+CD25+Foxp3+ PBL shown in Fig. 3 had 1% CD4+IgG+, 4% CD4+gp120+ PBL, <20 HIV-1 copies/mL plasma, and 1128/μL CD4+ PBL, supporting the finding of high Treg and low immune complex-coated CD4+ PBL in HIV+ patients. In HIV– hemophilia patients CD4+IgG+ PBL ranged from 15–34%, CD4+gp120+ PBL from 1–2%, and CD3+CD4+CD25+Foxp3+ PBL from 15–173/μL, indicating lower levels of CD4+IgG+ and CD4+gp120+ PBL, and higher levels of Treg in HIV– hemophilia patients than in the 3 HIV+ patients with immune complexes on CD4+ PBL. Whereas in HIV– patients proportions of CD16+56+ NK cells increased in parallel with CD4+IgG+ PBL (p = 0.007) (Table 2), in HIV+ patients the “downregulated” NK cells did not respond to opsonized CD4+ PBL (p = 0.729) (Table 2).
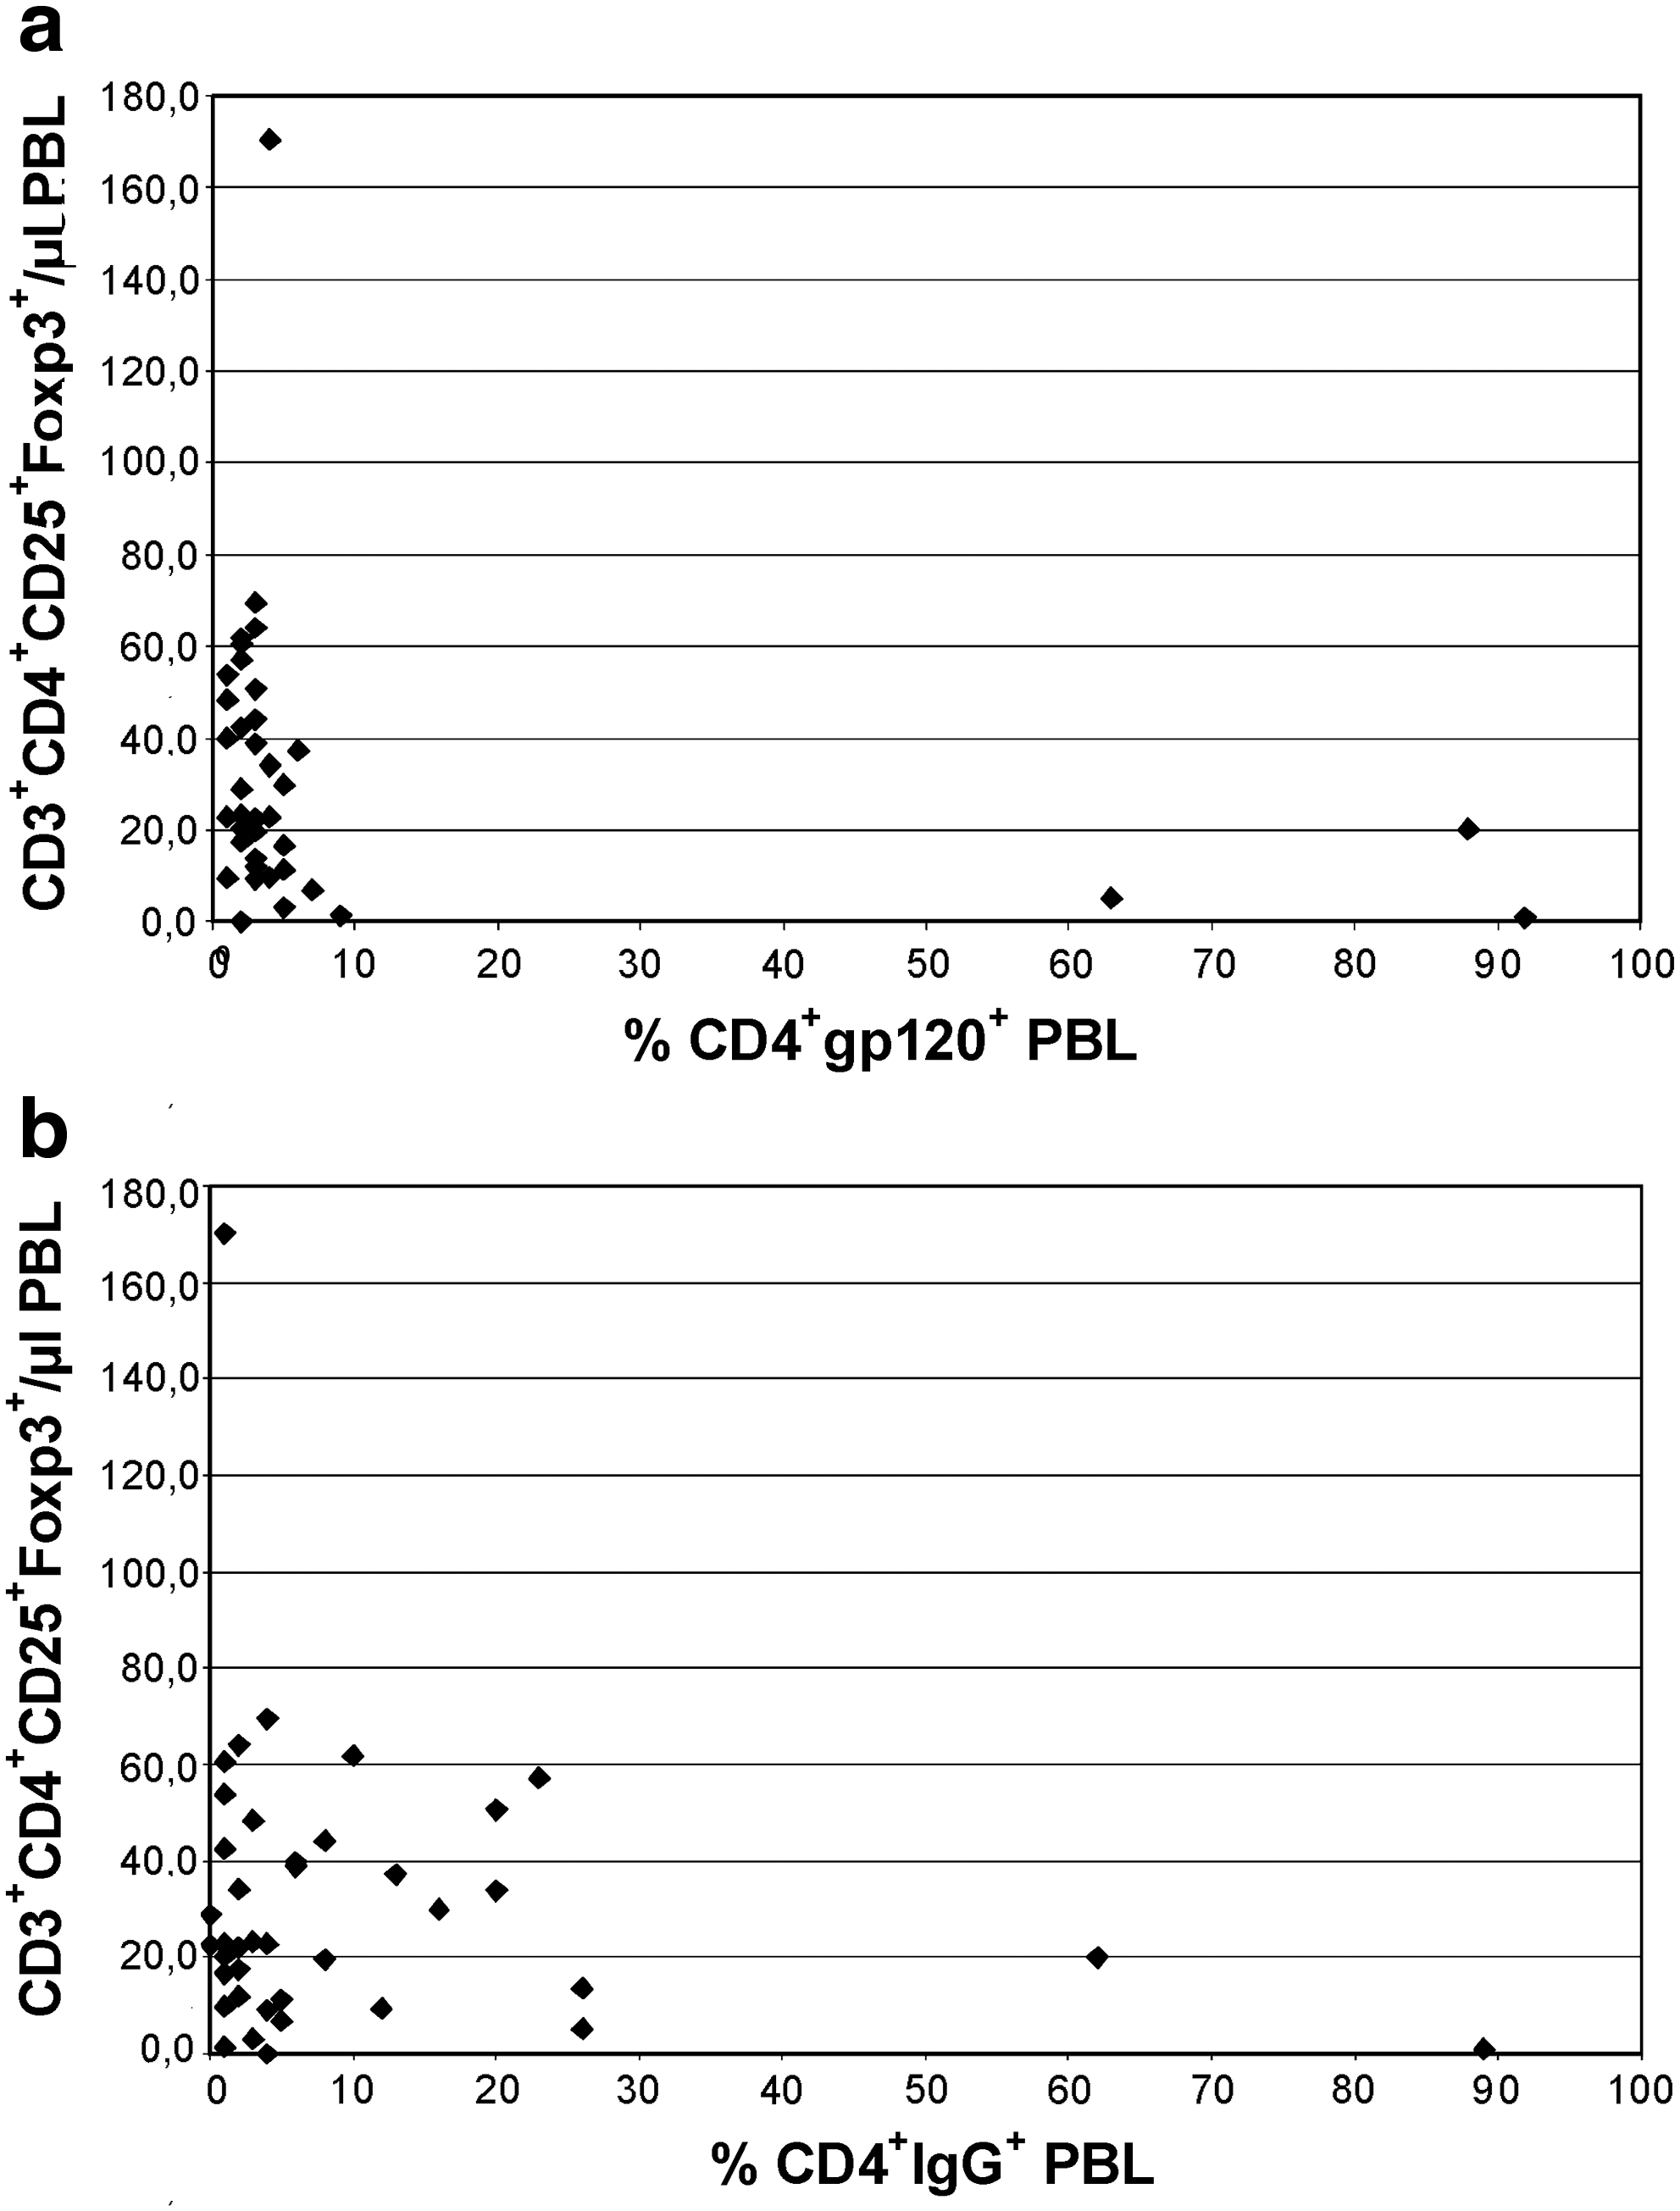
Relationship of CD4+IgG+ and CD4+gp120+ PBL with CD3+CD4+CD25+Foxp3+ PBL in 40 HIV+ hemophilia patients. (
TGF-β2 plasma levels were 0 pg/mL in all HIV− hemophilia patients.
Associations of proportions of CD4+IgG+ and CD4+gp120+ PBL with all immune parameters were analyzed using Spearman's rank correlation test. Only associations with p ≤ 0.01 are shown here. p Values <0.01 were considered significant and are shown in bold type.
Discussion
This analysis documents the strong benefit of HAART on the immune system of HIV+ hemophilia patients more than 25 years after infection with the retrovirus, and more than 10 years after initiation of HAART. After HAART-induced immunological reconstitution we observed a disappearance of IgG autoantibodies against CD4+ PBL in the majority of our HIV+ hemophilia patients (11,17,19). We suspect that beside a lower HIV-1 viral load, reconstitution of immunoregulatory DC and T PBL might contribute to the blockade of autoimmunity in these patients, and the development of an adaptive CD8+ immune response.
HIV+ hemophilia patients showed higher CD8+ PBL than HIV– hemophilia patients or healthy controls, as previously published (18). As also reported in previous studies, nearly all of our HIV+ and HIV– hemophilia patients were infected with HCV, HBV, CMV, and/or EBV due to treatment with virus-contaminated clotting factor preparations in the 1970s and 1980s (19). During subsequent years, virus-inactivated pooled or pure clotting factor preparations became available, and administration of these preparations eliminated the risk of additional clotting factor–acquired virus infections. Interferon was introduced successfully into the treatment protocols of HCV-infected patients in the 1990s (19). This progress in treatment strategies probably accounts for the currently normal CD8+ PBL counts in our HIV– hemophilia patients (19). In contrast to HIV+ hemophilia patients, our HIV– hemophilia patients did not show increased CD8+ PBL (19).
Our HIV+ patients showed a stronger activation of immunostimulatory DC1 than our HIV– hemophilia patients; however, the activation was in the normal range when compared with healthy controls (18). These data can be interpreted as showing normal activation of immunostimulatory DC1 in HIV+ patients, resulting in a response of the adaptive cellular immune system, presumably against HIV. Innate immunity, such as NK cells and TNF-α-producing monocytes and macrophages, were found to be downregulated in our HIV+ patients.
Before conversion to HAART, many of our HIV+ hemophilia patients had extremely low CD4+ PBL counts of approximately 20/μL, and normal CD8+ PBL counts of approximately 400/μL, indicating the lack of a cytotoxic response against the retrovirus (17,16). After conversion to HAART, CD4+ PBL recovered, CD8+ PBL increased strongly, and the HIV-1 viral load decreased in most patients, to levels below the detection limit of the test (17 –19). We interpreted this PBL increase as indicating an increase in immunoreactivity and antiretroviral response.
The remarkable finding of the present study is that a considerable proportion of the recovered CD4+ and CD8+ PBL in HIV+ patients showed a suppressive phenotype, and appeared to downregulate the cell pool. The proportions of PBL with Treg and Ts phenotype were higher in HIV+ than in HIV– patients. The proportions of Treg in HIV+ patients were similar to those seen in healthy controls, whereas Ts proportions were abnormally increased, as published previously (18).
Others reported that absolute Treg numbers in the blood or lymph nodes decreased during HIV infection, and were inversely correlated with activation of CD8+ PBL (1,2,8,21,22,29,32,37,39,40,42). We also found decreased absolute numbers of Treg in HIV+ hemophilia patients. However, when the Treg and Ts proportions were analyzed, our patients showed increased percentages of Treg and Ts PBL subsets in the blood compared to HIV– hemophilia patients. It thus appears that HIV+ hemophilia patients modulate strong DC1 and T-cell activation by upregulation of immunosuppressive Foxp3-expressing T-lymphocyte subsets. Highly suppressive adaptive Foxp3-expressing CD4+ Treg and CD8+ Ts have been generated by continuous antigen stimulation in the presence of TGF-β1 in vitro (24,26,35). It has been shown that Foxp3 expression and T-regulatory function are not exclusive features of a unique lineage of T cells, but rather represent a transient state attained by almost all T cells (44). These findings suggest that continuous stimulation of CD4+ and CD8+ T PBL by persisting HIV might induce the formation of Treg and Ts. Additional suppressive mechanisms may assist in this effect. HIV tat protein was shown to downregulate IL-7R expression (23). The lower expression of IL-7R on CD8+ PBL found in our HIV+ patients might indicate inhibition of cytotoxic CD8+ PBL and CD8+ memory cells (9,23,30,34,43,45). IL-7 is essential for T-cell hematopoiesis, and reduction of this receptor may contribute to the homeostatic disruption seen in HIV (3,6,9,23,30,31,34,43,45). Moreover, Treg were shown to express low levels of CD127 (23). Analogously to CD4+CD25+CD127– Treg, an increased proportion of CD8+CD127– PBL, as seen in our study, may imply the presence of an increased proportion of Ts in HIV+ hemophilia patients (5,50). Thus continuous stimulation with HIV proteins might induce immunosuppressive T PBL and functionally impaired CD8+ PBL (50). We reported previously that high CD8+ PBL counts in HIV+ hemophilia patients were associated with low IL-7R expression on CD8+ PBL, a finding that might reflect in part functionally impaired CD8+ PBL (18).
Presumably as a consequence of Treg and Ts domination, cytokine production of activated Th-1 and Th-2 PBL exhibiting a CD3+CD4+D25+ phenotype was decreased in our HIV+ patients, compared to the levels found in our HIV– hemophilia patients. Th-1 cytokine production was markedly lower than in healthy controls, as reported previously (18). In addition, IL-2 and IL-4 production in CD3+CD4+CD28– PBL showing the phenotype of aggressive proinflammatory lymphocytes was reduced. CD3+CD4+CD28– PBL have been frequently observed in patients with virus infections, unstable angina, or autoimmune diseases such as rheumatoid arthritis and multiple sclerosis (20,38,47,52,53). CD3+CD4+CD28– PBL were shown to produce primarily IFN-γ, TNF-α, and IL-10, and less frequently IL-2 and IL-4 (20,38,53). In our HIV+ patients, IL-2 and IL-4 production was downregulated in CD3+CD4+CD28– PBL, and IL-10, IL-12, and IFN-γ production was not induced in this PBL subset. TNF-α blockade, using a TNF-α mAb, has been shown to inhibit the in-vitro proliferation of CD3+CD4+CD28– PBL (47). It is conceivable that circulating CD3+CD4+CD28– PBL were downregulated by the low plasma TNF-α levels observed in our HIV+ patients. Imbalances in plasma cytokine levels have been frequently observed in patients with IRD (33). High IFN-γ effector and low IL-10 regulatory cytokine responses were assumed to be responsible for mycobacterial IRD in HIV+ patients (33). Downregulation of IL-2+ and IL-4+ CD3+CD4+CD28– PBL, and non-activation of IL-10+, IL-12+, and IFN-γ+ CD3+CD4+CD28– PBL, as observed in this study, might prevent IRD and the development of aggressive proinflammatory lymphocytes, as they were frequently observed in patients with infections or autoimmune diseases. Excessive Th-1-induced cellular immune responses (IL-2 and IFN-γ), as well as overshooting Th-2-mediated humoral immune responses and autoantibody production (IL-4 and IL-10) might be inhibited by the downregulation of CD3+CD4+CD28– PBL.
Upregulation of Treg and Ts, which downregulate cytokine-producing CD4+ T and autoantibody-forming B PBL, may also impede the generation of autoreactive IgG antibodies against CD4+ PBL that was frequently seen in HIV+ patients before the HAART era. Anti-CD4+ PBL antibodies and immune complexes on CD4+ PBL were strongly associated with depletion and dysfunction of CD4+ PBL, and patients showed imbalances of in-vivo and in-vitro cytokine responses (12,41,48,54). CD4+ PBL depletion in the pre-HAART era potentially involved the Treg pool that contributes to the development of autoimmunity. In the present study, HIV+ and HIV– hemophilia patients exhibited similar percentages of CD4+ and CD8+ PBL coated with IgG, IgM, and/or C3d, suggesting that currently no strong HIV-induced anti-CD4 autoantibody production occurs in the majority of HIV+ patients. Only the proportion of gp120+ CD4+ PBL was higher in HIV+ than in HIV– patients, in all likelihood reflecting a higher proportion of CD4+ PBL that were HIV infected or had attached virions, free gp120, or HIV-containing immune complexes (13 –15). Sixty-five percent of the HIV+, but none of the HIV– hemophilia patients, showed more than 2% circulating CD4+gp120+ PBL. Interestingly, high CD4+gp120+ PBL were associated with low Treg counts, supporting our hypothesis that disappearance of immune complex-coated CD4+ PBL during the last few years was induced by reconstitution of the Treg pool.
Our data as well as those of others suggest that immunoregulatory T PBL affect the course of HIV disease. Downregulation of immunoregulatory T PBL was shown to induce IRD and autoimmunity that is able to trigger HIV disease progression (10,51). Excessive upregulation of immunoregulatory T PBL was shown to induce strong immunosuppression, and might also initiate disease progression (28). Induction of CD8+CD25+Foxp3+ PBL was associated with low CD4+ T-cell activation and high viral load during primary simian immunodeficiency virus infection in cynomolgus macaques (28).
We conclude that long-term HAART results in a partial immunological reconstitution of long-term HIV-infected hemophilia patients, leading to higher levels of immunostimulatory DC and effector T cells, but also higher levels of immunosuppressive T PBL subsets, than in HIV– hemophilia patients. The comparison of HIV+ with HIV– hemophilia patients detailed here demonstrates that these likely HAART-induced immunoregulatory mechanisms are more impressive than were the findings of our previously published comparison of HIV+ patients with healthy controls (18). The increased immunosuppressive T PBL subsets may be beneficial, and they may have decreased the occurrence of autoimmunity and prevented the development of IRD in our clinically stable patients. Decreased autoimmunity against CD4+ PBL might have contributed to the reconstitution of the immune system and the clinical stabilization of our long-term HIV-infected hemophilia patients on HAART.
Footnotes
Acknowledgments
We would like to acknowledge the skillful technical assistance of Silja Petersen, Marion Miltz, Martina-Kutsche-Bauer, Regina Seemuth, and Anja Brüchig.
Author Disclosure Statement
No competing financial interests exist.