




Abstract
Tick-borne encephalitis virus (TBEV), a representative acute central nervous system disease-inducible virus, is known to elicit dose-independent mortality in a mouse model. We previously reported that subcutaneous infection with a wide range of TBEV Oshima strain challenge doses (102–106 PFU) produced an approximately 50% mortality rate. However, the factors playing critical roles in mortality and severity remain unclear. In this study, we distinguished surviving and dying mice by their degree of weight loss after TBEV infection, and investigated qualitative differences in brain-infiltrating T cells between each group by analyzing T-cell receptor (TCR) repertoire and complementary determining region 3 (CDR3) sequences. TCR repertoire analysis revealed that the expression levels of VA8-1, VA15-1, and VB8-2 families were increased in brains derived from both surviving and dying mice. CDR3 amino acid sequence characteristics differed between each group. In dying mice, high frequencies of VA15-1/AJ12 and VB8-2/BJ1.1 gene usage were observed. While in surviving mice, high frequencies of VA8-1/AJ15 or VA8-1/AJ23 gene usage were observed. VB8-2/BJ2.7 gene usage and short CDR3 were observed frequently in both surviving and dying mice. However, no differences in T-cell activation markers and apoptosis-related genes were observed between these groups using quantitative real-time PCR analysis. These results suggest that TBEV-infection severity may be involved in antigen specificity, but not in the number or activation level of brain-infiltrating T cells.
Introduction
Clinical manifestations caused by TBEV range from inapparent infections and fevers, with complete recovery of patients, to debilitating or fatal encephalitis. While such diverse manifestations can be caused by any of the three subtypes (16,17), the percentage of severe cases differs among each subtype. We previously reported that differences exist in the severity of symptoms among individual mice after peripheral infection with the Oshima strain of TBEV, a member of the Far Eastern subtype (6,18,21). Following subcutaneous infection with a wide range of challenge doses (102–106 PFU), the mortality rate was consistently approximately 50% (21). Although a dose-independent mortality pattern is shown in several encephalitic flavivirus infection models, the causative biological mechanisms have yet to be defined (24,26,35,42,44,45). Thus, we investigated the immunological and biological responses in surviving and dying mice, so that increased corticosteroid serum levels and TNF-α expression levels in the serum and the brains were observed in dying mice (21). However, as there was no significant difference in viral loads and the levels of cellular infiltration in the brains between the two groups, the fate of infected mice was not likely to be determined by neuro-invasiveness or the number of brain-infiltrating cells.
Multiple complex factors are associated with encephalitis pathogenesis. Recent studies indicate that brain-infiltrating T cells play an important role in viral encephalitis (24,26,34,45). T cells potentially contribute to both recovery and immunopathogenesis, and the functional balance between these differs among virus species and experimental conditions. For example, it is widely thought that T-cell responses are essential for viral clearance in WNV infection (4,5,15,32,36,37), although differences in responses between surviving and dying mice under identical inoculation conditions have not been determined. We further reported no differences in the number of brain-infiltrating CD8+ T cells in our previous study (21), but did not compare immunological markers.
We previously demonstrated that T cells with selected T-cell receptors (TCRs) accumulate in JEV-infected mouse brains using TCR repertoire analysis and nucleotide sequencing of the complementary determining region 3 (CDR3) (10). These are efficient methods for analyzing relative expression levels of each TCR family and the frequency of each T-cell clone, which allows us to better understand the pathological and/or protective mechanism in our TBEV-infected mouse model. By determining the TCR repertoire and frequencies of T-cell clones we can assess if different patterns exist between surviving and dying mice. Identical patterns would indicate that disease severity is independent of T cells, whereas different patterns would indicate that T-cell antigen recognition pattern is related to severity. The purpose of our study was therefore to clarify whether T cells influence the severity of TBEV-induced encephalitis.
Materials and Methods
Virus and cells
Stock virus of TBEV Oshima 5-10 strain (accession no. AB062063) was prepared from the medium used to culture baby hamster kidney (BHK) cells after five passages through suckling mouse brains (20). BHK cells were maintained in Eagle's Minimal Essential Medium (EMEM; Nissui Pharmaceutical Co., Tokyo, Japan) containing 8% fetal calf serum (FCS). All experiments using live TBEV were performed in a biosafety level three (BSL3) laboratory at the Tokyo Metropolitan Institute for Neuroscience according to the standard BSL3 guidelines.
Mice
Five-week old female C57BL/6j mice were subcutaneously inoculated with 103 PFU of TBEV diluted in EMEM containing 2% FCS. Mock-infected mice were inoculated with EMEM from the supernatant medium of BHK cells. Mice were weighed daily and observed for clinical disease symptoms including behavioral symptoms and signs of paralysis. Morbidity was determined as relative weight loss compared with day 0. Thirteen days post-infection (dpi), mice exhibiting more than 25% or less than 10% weight loss were recognized as dying or surviving mice, respectively (21). The Animal Care and Use Committee of the Tokyo Metropolitan Institute for Neuroscience approved all experimental protocols.
Isolation of total RNA from tissues
Mice injected with mock or TBEV were anesthetized and perfused with cold PBS at 13 dpi. Brains and spleens were excised and immediately submerged in RNAlater ® RNA Stabilization Reagent (Qiagen, Hilden, Germany). Total RNA was then isolated using an RNeasy Lipid Tissue Mini kit (Qiagen) according to the manufacturer's instructions. Isolated total RNA was used for TCR repertoire analysis, CDR3 sequencing, and quantification of viral RNA and gene expressions using quantitative real-time PCR.
Adaptor ligation-mediated polymerase chain reaction (AL-PCR)
AL-PCR methodology was previously reported (30,41,48). Briefly, isolated total RNA was converted to double-stranded cDNA using the Superscript cDNA synthesis kit (Invitrogen, Carlsbad, CA), according to the manufacturer's instructions, except that a specific primer (BSL-18E) was used (48). The P10EA/P20EA adaptors were ligated to the 5′ end of cDNA and this adaptor-ligated cDNA was cut with Sph I. PCR was performed using TCR α-chain or β-chain constant region-specific primers (MCA1 or MCB1) and P20EA. The second PCR was performed with MCA2 or MCB2 and P20EA. Biotinylation of PCR products was performed using both P20EA and 5′-biotinylated MCA3 or MCB3 primers.
TCR repertoire analysis
TCRAV and TCRBV repertoires were analyzed using a microplate hybridization assay (MHA) (48). In brief, 10 pmol of amino-modified oligonucleotides specific for TCRAV and TCRBV segments were immobilized onto carboxylate-modified 96-well microplates with water-soluble carbodiimide. Prehybridization and hybridization were performed in GMCF buffer (0.5 M Na2HPO4, pH 7.0, 1 mM EDTA, 7% SDS, 1% BSA, and 7.5% formamide) at 47°C. One-hundred microliters of denatured 5′-biotinylated PCR products were mixed with an equivalent volume of 0.4 N NaOH/10 mM EDTA, and added to 10 mL of GMCF buffer. Hybridization solution (100 μL) was added to each well of the microplate containing immobilized oligonucleotide probes specific for the V segment. After hybridization, the wells were washed four times with washing buffer (2 × SSC, 0.1% SDS) at room temperature. The plate was incubated at 37°C for 10 min for stringency washing. After washing four times with 2 × SSC, 0.1% SDS, 200 μL of TB-TBS buffer (10 mM Tris-HCl, 0.5 M NaCl, pH 7.4, 0.5% Tween 20, and 0.5% blocking reagent; Boehringer Mannheim, Mannheim, Germany) were added to block non-specific binding. Next, 100 μL of 1:1000-diluted alkaline phosphatase-conjugated streptavidin in TB-TBS was added, and the sample was incubated at 37°C for 30 min. The plates were washed six times in T-TBS (10 mM Tris-HCl, 0.5 M NaCl, pH 7.4, and 0.5% Tween 20). For color development, 100 μL of substrate solution (4 mg/mL p-nitrophenylphosphate in 10% diethanolamine, pH 9.8) was added and the absorbance was determined at 405 nm. The ratio of the hybridization intensity for each TCRV-specific probe to that of a TCRC-specific probe (V/C value) was determined using the TCR cDNA concentrated samples that contained the corresponding V segment and the universal C segment, respectively. Absorbances obtained for each TCRV-specific probe were divided by the corresponding V/C value. The relative frequency was calculated using the corrected absorbencies by the formula: relative frequency (%) = (corrected absorbance of TCRV-specific probe/the sum of corrected absorbencies of TCRV-specific probes) × 100.
T-cell clonality analysis with CDR3 size spectratyping
PCR was performed for CDR3 size spectratyping (23) for 30 cycles in a 20 μL volume under the same conditions as described above. PCR assays used 1 μL of 1:20 or 1:50 diluted second PCR product, 0.1 μM of 5′-Cy5 MCA3/MCB3 primer, and 0.1 μM of the primer specific for each variable segment. Oligonucleotide probes for hybridization were used as primers specific for each variable segment (as described above). Two microliters of 1:20-diluted PCR product in sample loading solution was analyzed using a CEQ8000 Genetic Analysis System (Beckman Coulter, Brea, CA). Spleen cells from mock-infected mice were used as a control for the peak patterns of peripheral blood.
Determination of nucleotide sequence of CDR3 regions
PCR was performed with 1 μL of 1:20 diluted second PCR product, using a forward primer specific to the variable region and a reverse primer specific to the constant region (MCA4 or MCB4) under the conditions described above. Primers VA8-1 (5′-ACGCCACTCTCCATAAGAGCA-3′), VA15-1 (5′-GTGGACAGAAAACAGAGCCAA-3′), and VB8-2 (5′-GGCTACCCCCTCTCAGACAT-3′) were used in this study. After elution from the agarose gel, PCR products were cloned into the pGEM-T Easy Vector (Promega Corp., Madison, WI). DH5α-competent cells were transformed with the recombinant plasmid DNA. Sequence reactions were performed with a GenomeLab DTCS Quick Start Kit (Beckman Coulter) and analyzed using the CEQ8000 Genetic Analysis System (Beckman Coulter).
Quantitative real-time PCR (qPCR)
mRNA expression levels of T-cell-related antigens, activation markers, and apoptosis-related genes for brains excised from TBEV-infected or mock-infected mice were determined by qPCR using a LightCycler (Roche Diagnostics Corp., Indianapolis, IN). Previously reported primer pairs specific for glyceraldehyde-3-phosphate dehydrogenase (GAPDH), CD3, CD4, and CD8 (10) were used in this study. The following additional primer pairs were designed for our study: CD25 (forward: 5′-AAGATGAAGTGTGGGAAAACGG-3′, reverse: 5′-GGGAAGTCTGTGGTGGTTATGG-3′), CD69 (forward: 5′-AGGATCCATTCAAGTTTCTATCCC-3′, reverse: 5′-CAACATGGTGGTCAGATGATTCC-3′), Granzyme (Gym) A (forward: 5′-CCTGAAGGAGGCTGTGAAAG-3′, reverse: 5′-GAGTGAGCCCCAAGAATGAA-3′), Gym B (forward: 5′-CCATCGTCCCTAGAGCTGAG-3′, reverse: 5′-TTGTGGAGAGGGCAAACTTC-3′), Perforin (forward: 5′- GCCTGGTACAAAAACCTCCA-3′, reverse: 5′- AGGGCTGTAAGGACCGAGAT-3′) and Fas ligand (FasL) (forward: 5′- GGGCAGTATTCAATCTTACCAG-3′, reverse: 5′-GTGCCCATGATAAAGAATAGTAGA-3′). Freshly isolated RNA was converted to cDNA using a PrimeScript™ RT reagent kit (Takara Bio Inc., Shiga, Japan), and the PCR reaction was performed using SYBR® Premix Taq™ (Takara Bio) for SYBR Green I according to the manufacturer's instructions. The expression level of each gene was measured by qPCR as demonstrated previously (10). Expression levels were normalized based on the housekeeping gene GAPDH copy number. Relative quantification was expressed as a ratio between TBEV-infected and mock-infected brains.
Viral RNA levels of TBEV were examined with NS1-specific primers (forward: 5′-CGGCTAGCCACACTATCGACAA-3′, reverse: 5′-GGCGAGTACTTCCATGGTCCTT-3′). Reverse transcription and PCR reactions were conducted as described above. Viral RNA was quantified as copy number per 1 ng of total RNA. Copy number in each sample was determined on the basis of a standard curve.
Statistical analysis
Student's t-test was used for statistical analysis to assess significant differences in weight change ratio, the degree of the relative expression in TCR repertoire analysis, and the expression levels of genes in qPCR analysis. The Mann-Whitney U test was used to evaluate frequencies of CDR3 sequences. A p value <0.05 was determined to be statistically significant.
Results
Discrimination of surviving and dying mice
Thirteen C57BL/6 mice were subcutaneously inoculated with 103 PFU of TBEV and weighed daily (Fig. 1A). Four mice from each of the surviving and dying groups were used in the experiments. Dying mice were defined as those exhibiting more than 25% weight loss at 13 dpi, and surviving mice were defined as those with less than 10% weight change. Mock-infected mice (n = 4) exhibited negligible weight change (data not shown). Weight percentage at 13 dpi, compared with that on day 0, was significantly different between the surviving and dying mouse groups (Fig. 1B). However, the amounts of viral RNA in the brains at the 13 dpi were no different between these two groups of mice (Fig. 1C). These data indicate that the virus propagation level is not the main factor that determines the fatality of TBEV-infected mice.
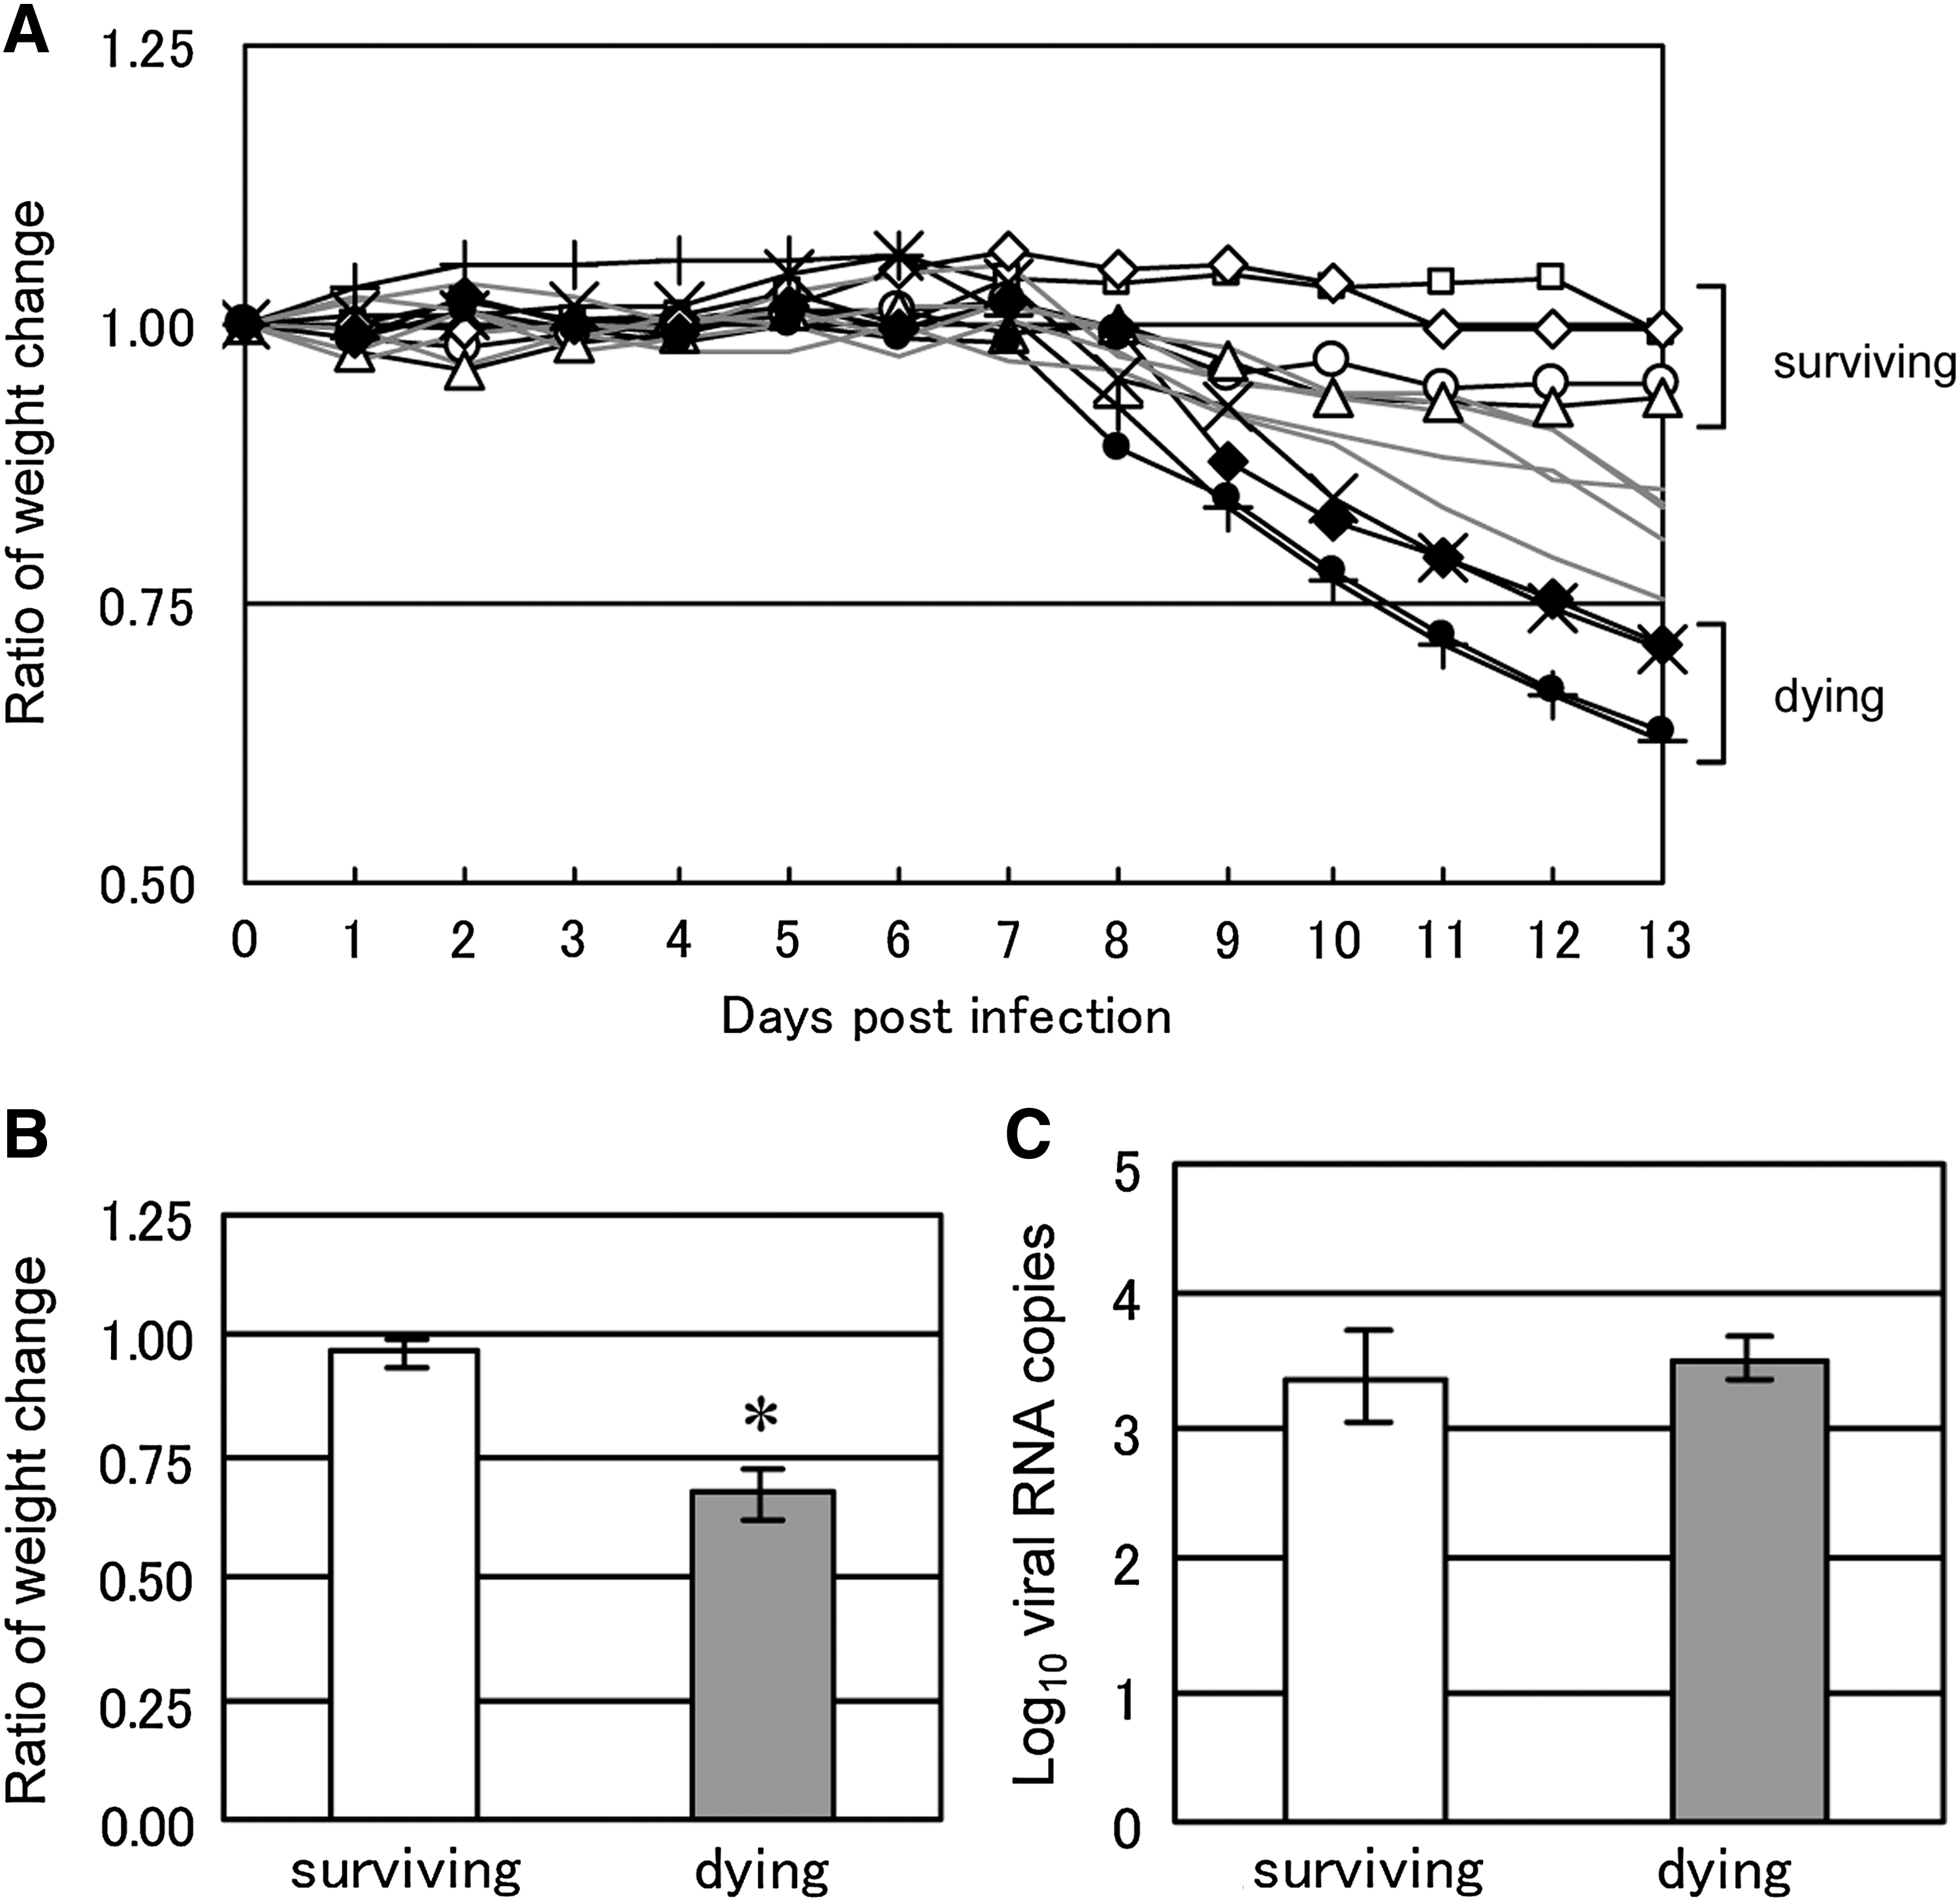
Fatality of TBEV-infected mice is characterized by weight loss rather than brain viral replication. (
TCR repertoire analysis
TCRAV and TCRBV repertoires were analyzed using brains and spleens collected from TBEV-infected dying mice, surviving mice, or mock-infected mice at 13 dpi (Fig. 2). Using TCR repertoire analysis, significant expressions of TCRAV and TCRBV were detected in TBEV-infected brains both in surviving and dying mice. Frequencies of T cells bearing VA8-1, VA15-1, and VB8-2 were significantly increased in brains compared with mock-infected spleens. However, there was no significant difference between surviving and dying mice. VA14-1, known as the family expressed on NKT cells (3), was expressed at very low levels in virus-infected brains. No difference between mock-infected and TBEV-infected mouse spleens was observed for both TCRAV and TCRBV repertoires, and this suggests that systemic T-cell response changes were below the detectable level in our analysis. In mock-infected mouse brains, the expression of TCRAV and TCRBV was not detected (data not shown) due to the low lymphocyte numbers.
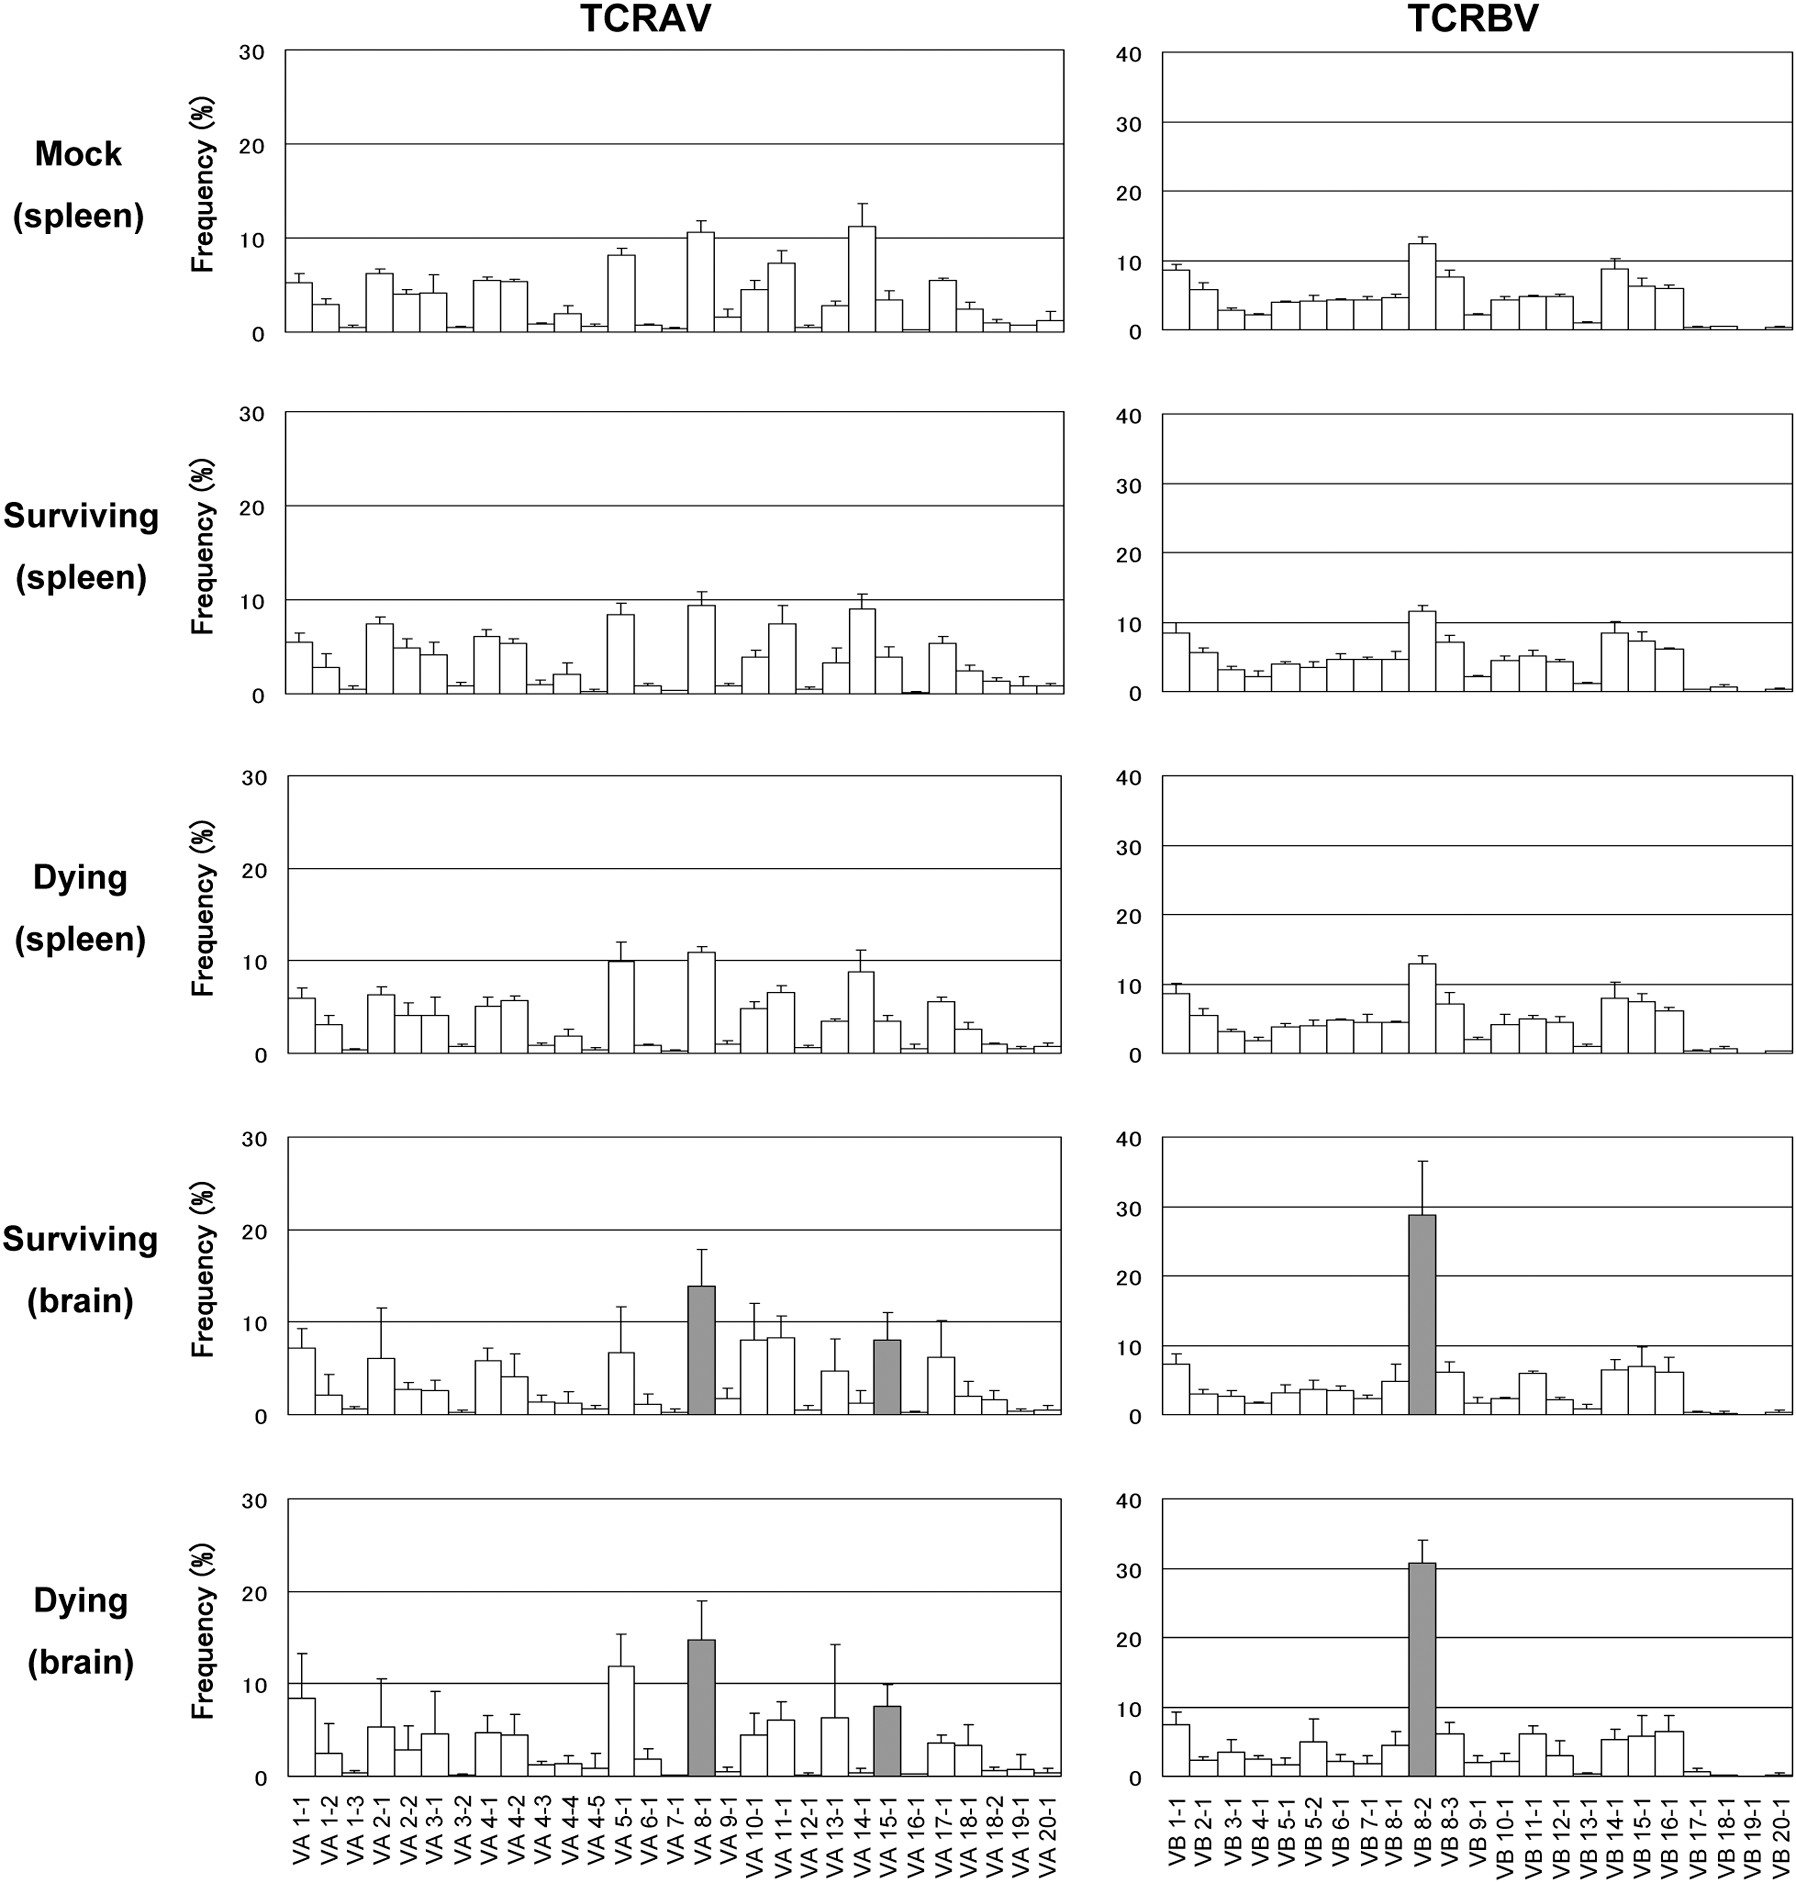
TCR repertoire analysis of spleens and brains from TBEV-infected or mock-infected mice. TCRAV and TCRBV repertoires were analyzed by MHA as described in the materials and methods section. Mean percent frequencies ± SD (standard deviation) of 4 mice are indicated. Gray bars indicate a significant increase compared with mock-infected spleens (p < 0.05 by Student's t-test).
CDR3 size spectratyping
We performed CDR3 size spectratyping analysis to confirm the clonalities of T cells expressing VA8-1, VA15-1, and VB8-2 families in TBEV-infected mouse brains (Fig. 3). Different patterns were observed between TBEV-infected brains and mock spleens for all three families. Furthermore, VA15-1 clonalities for dying mice were higher than those for surviving mice. A short VB8-2 size peak was also observed in surviving mice.
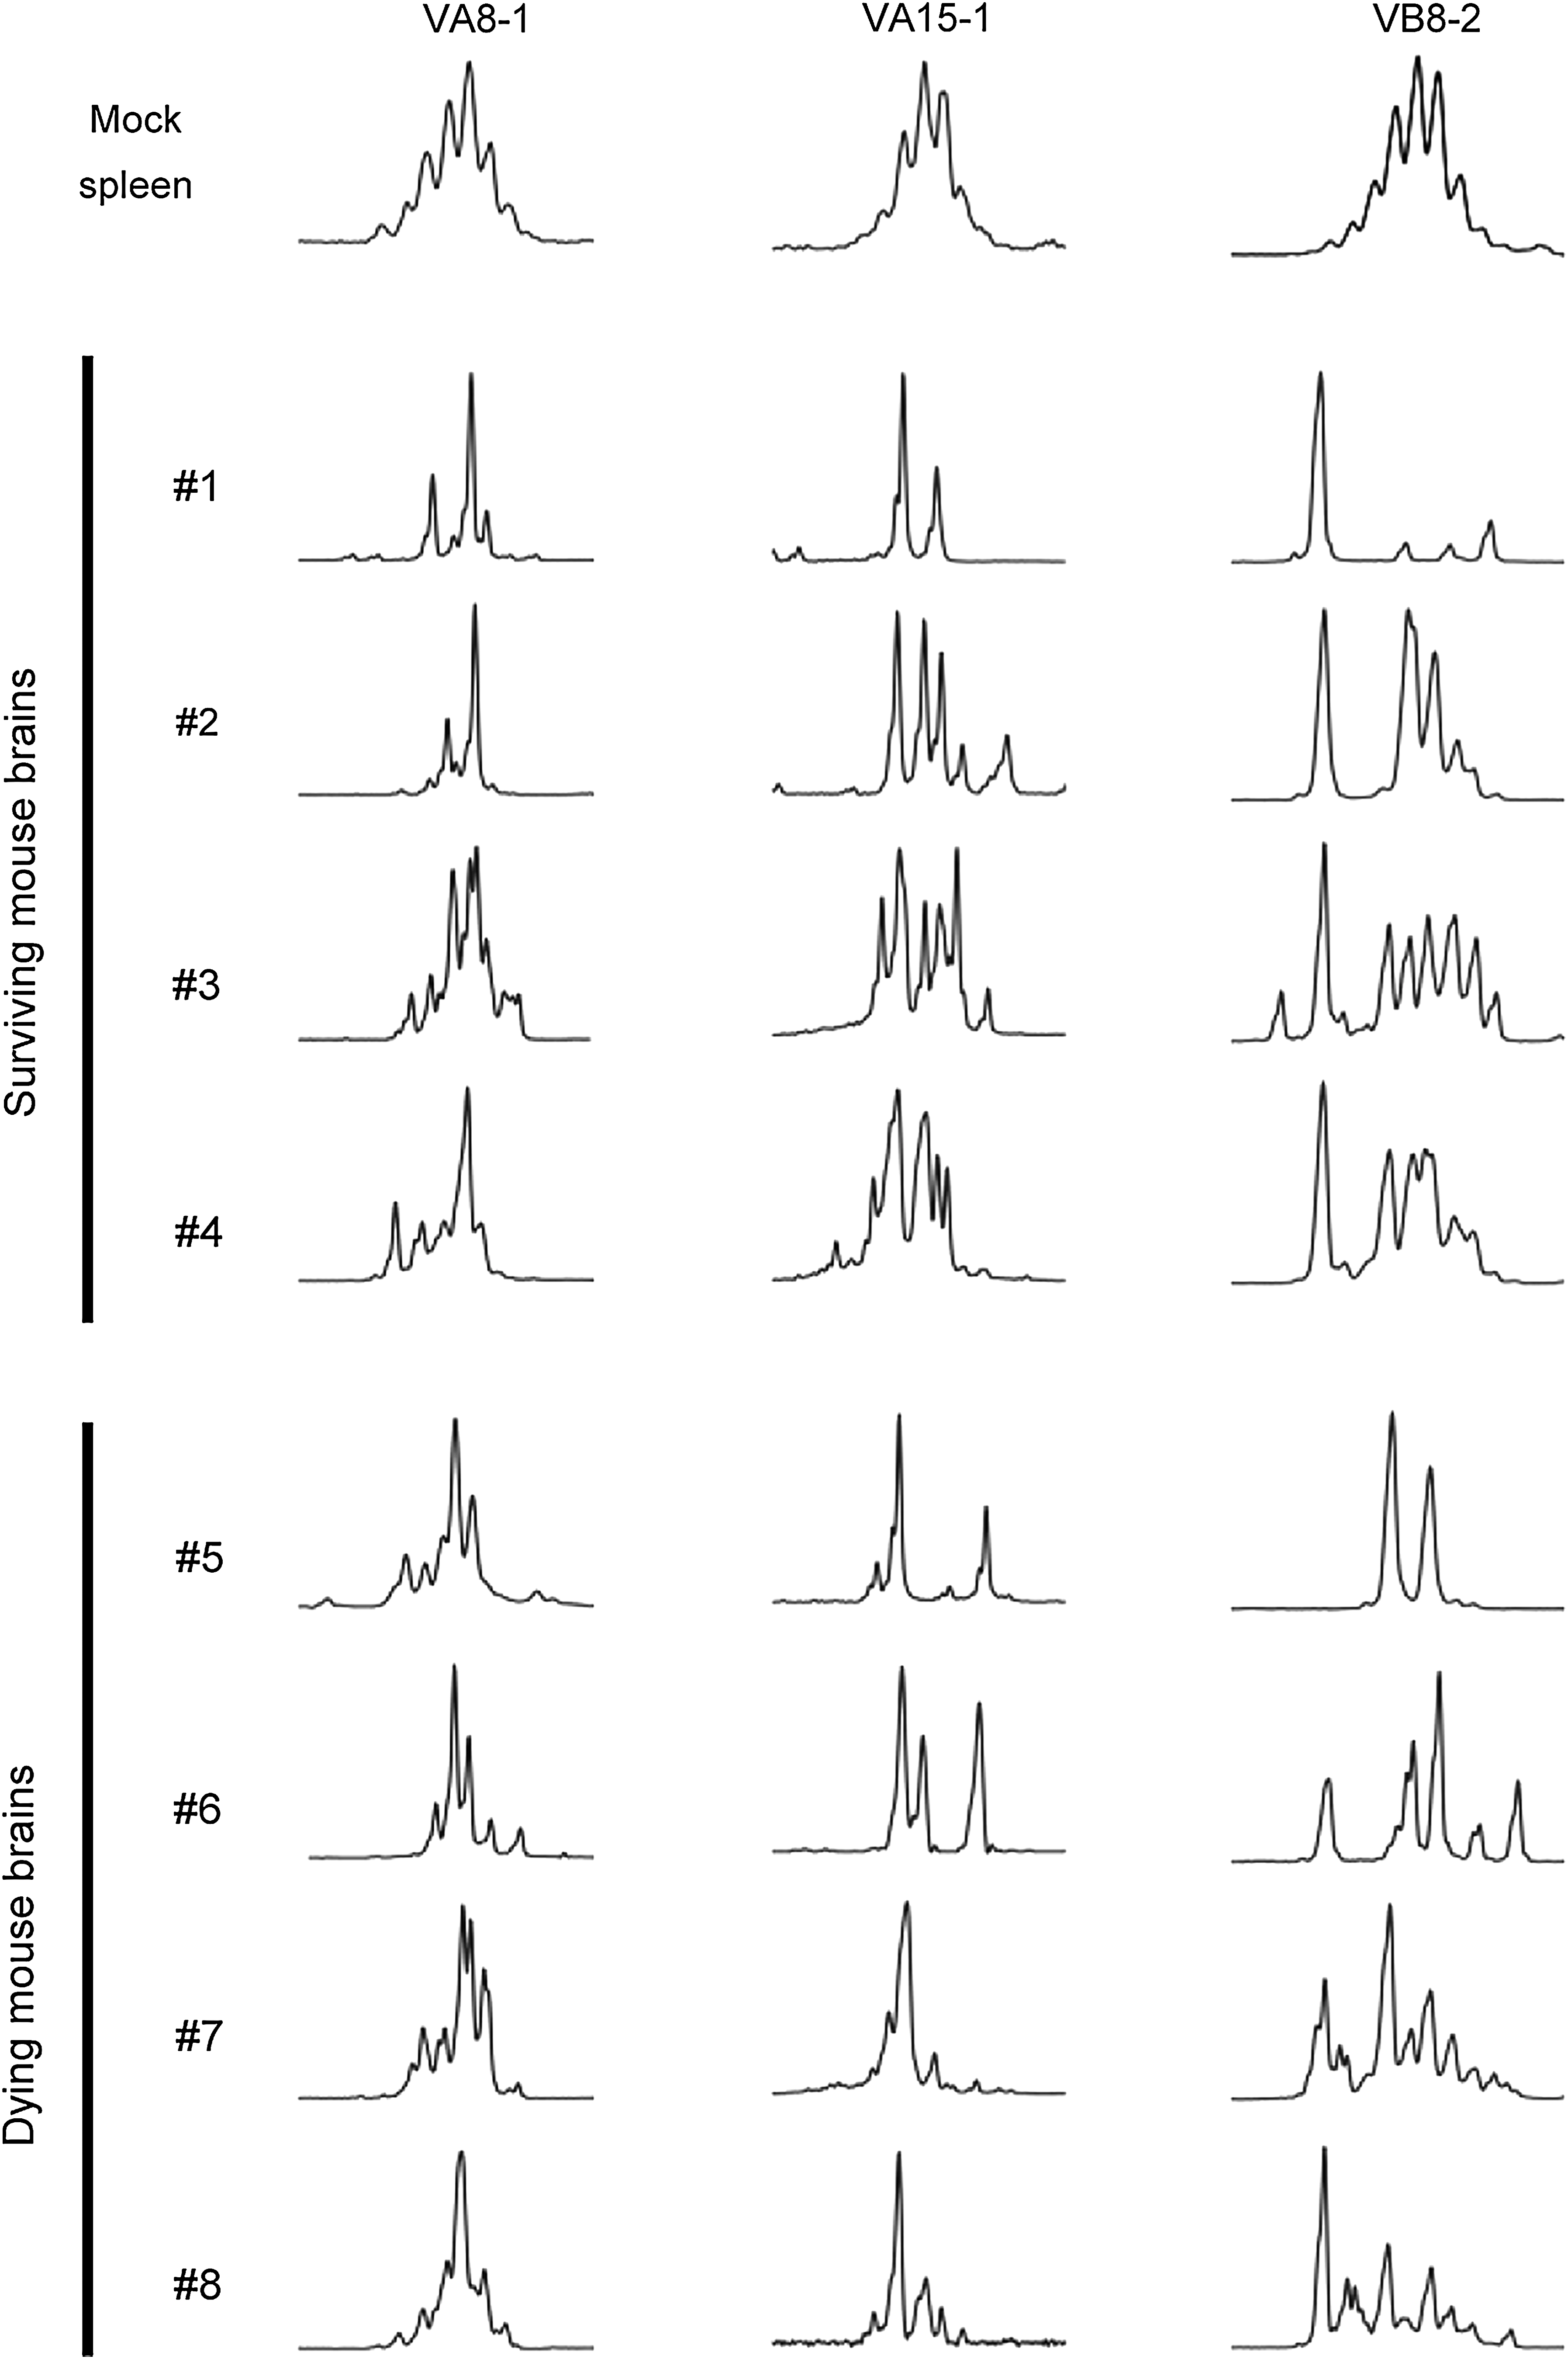
CDR3 size spectratyping revealed different T-cell clonality patterns between surviving and dying mice. T-cell clonality for VA8-1, VA15-1, and VB8-2 families in individual mouse brains are shown. Peak numbers indicate the size variation of CDR3. Nucleotide size becomes longer at the right side. Generally, multiple peaks indicate the existence of polyclonal T cells, and one or a few peaks indicate the existence of monoclonal and oligoclonal T cells, respectively. Mock-infected spleen was used as a control to indicate polyclonal pattern.
Amino acid sequences of CDR3
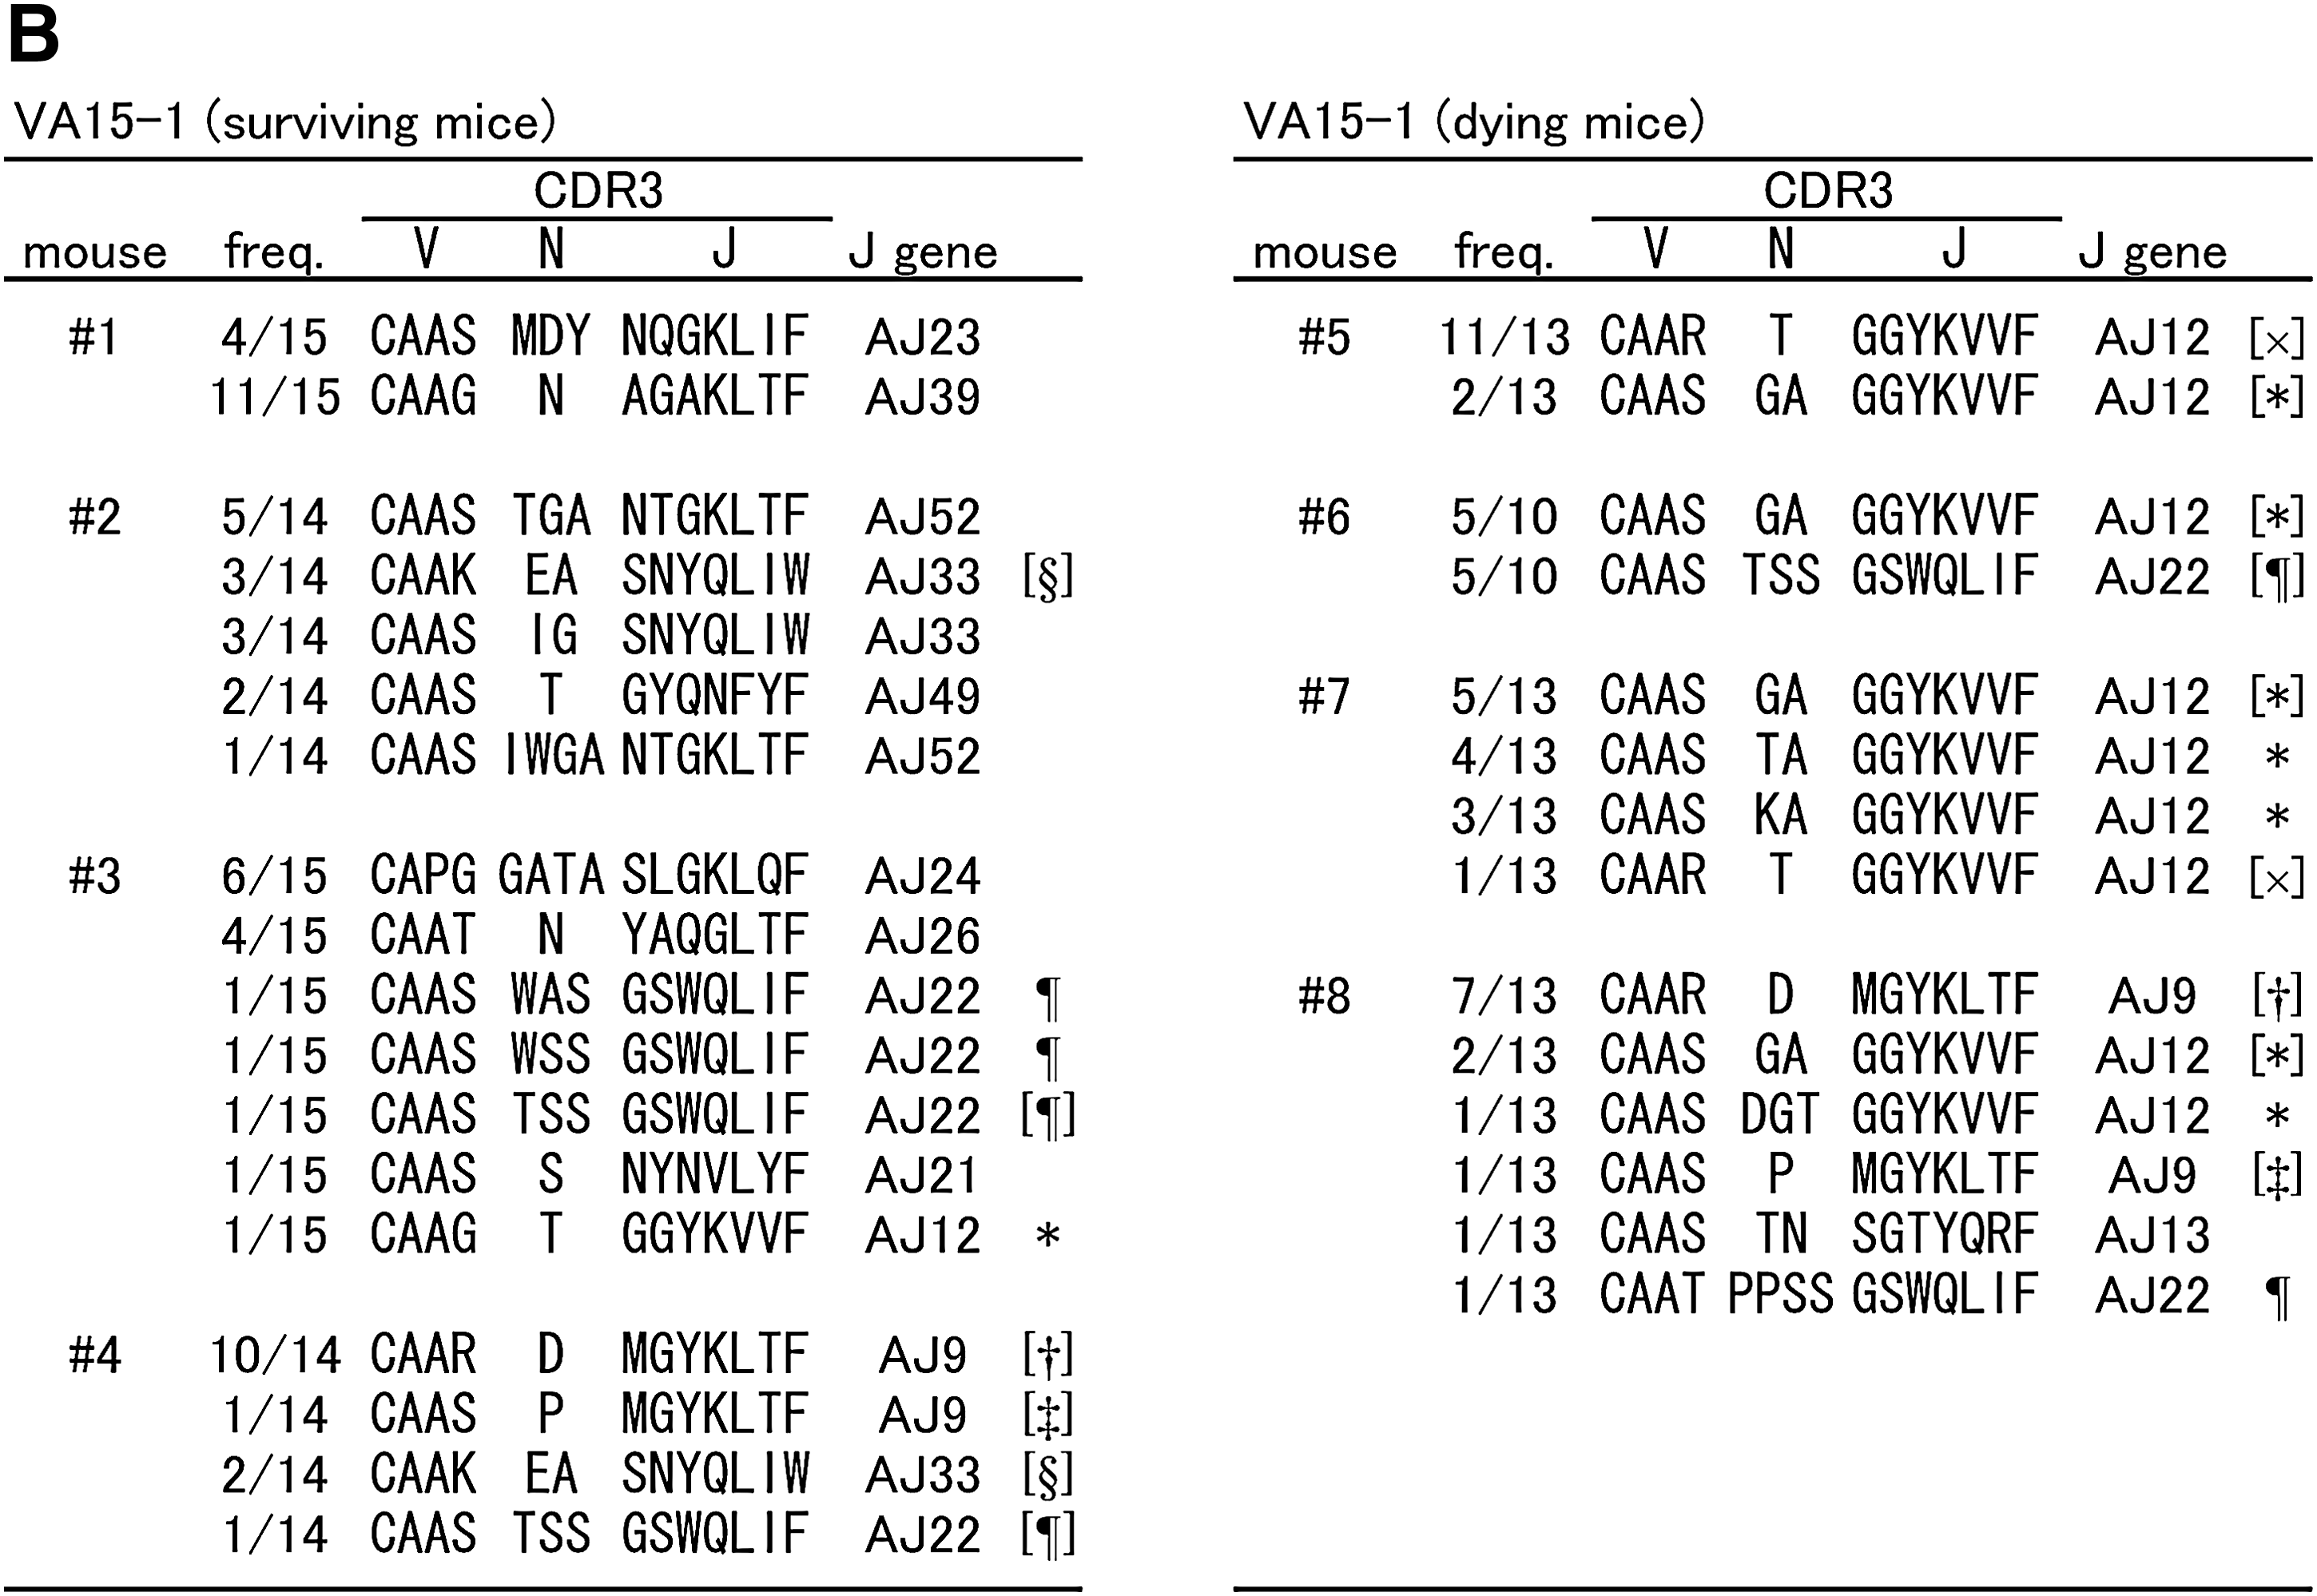
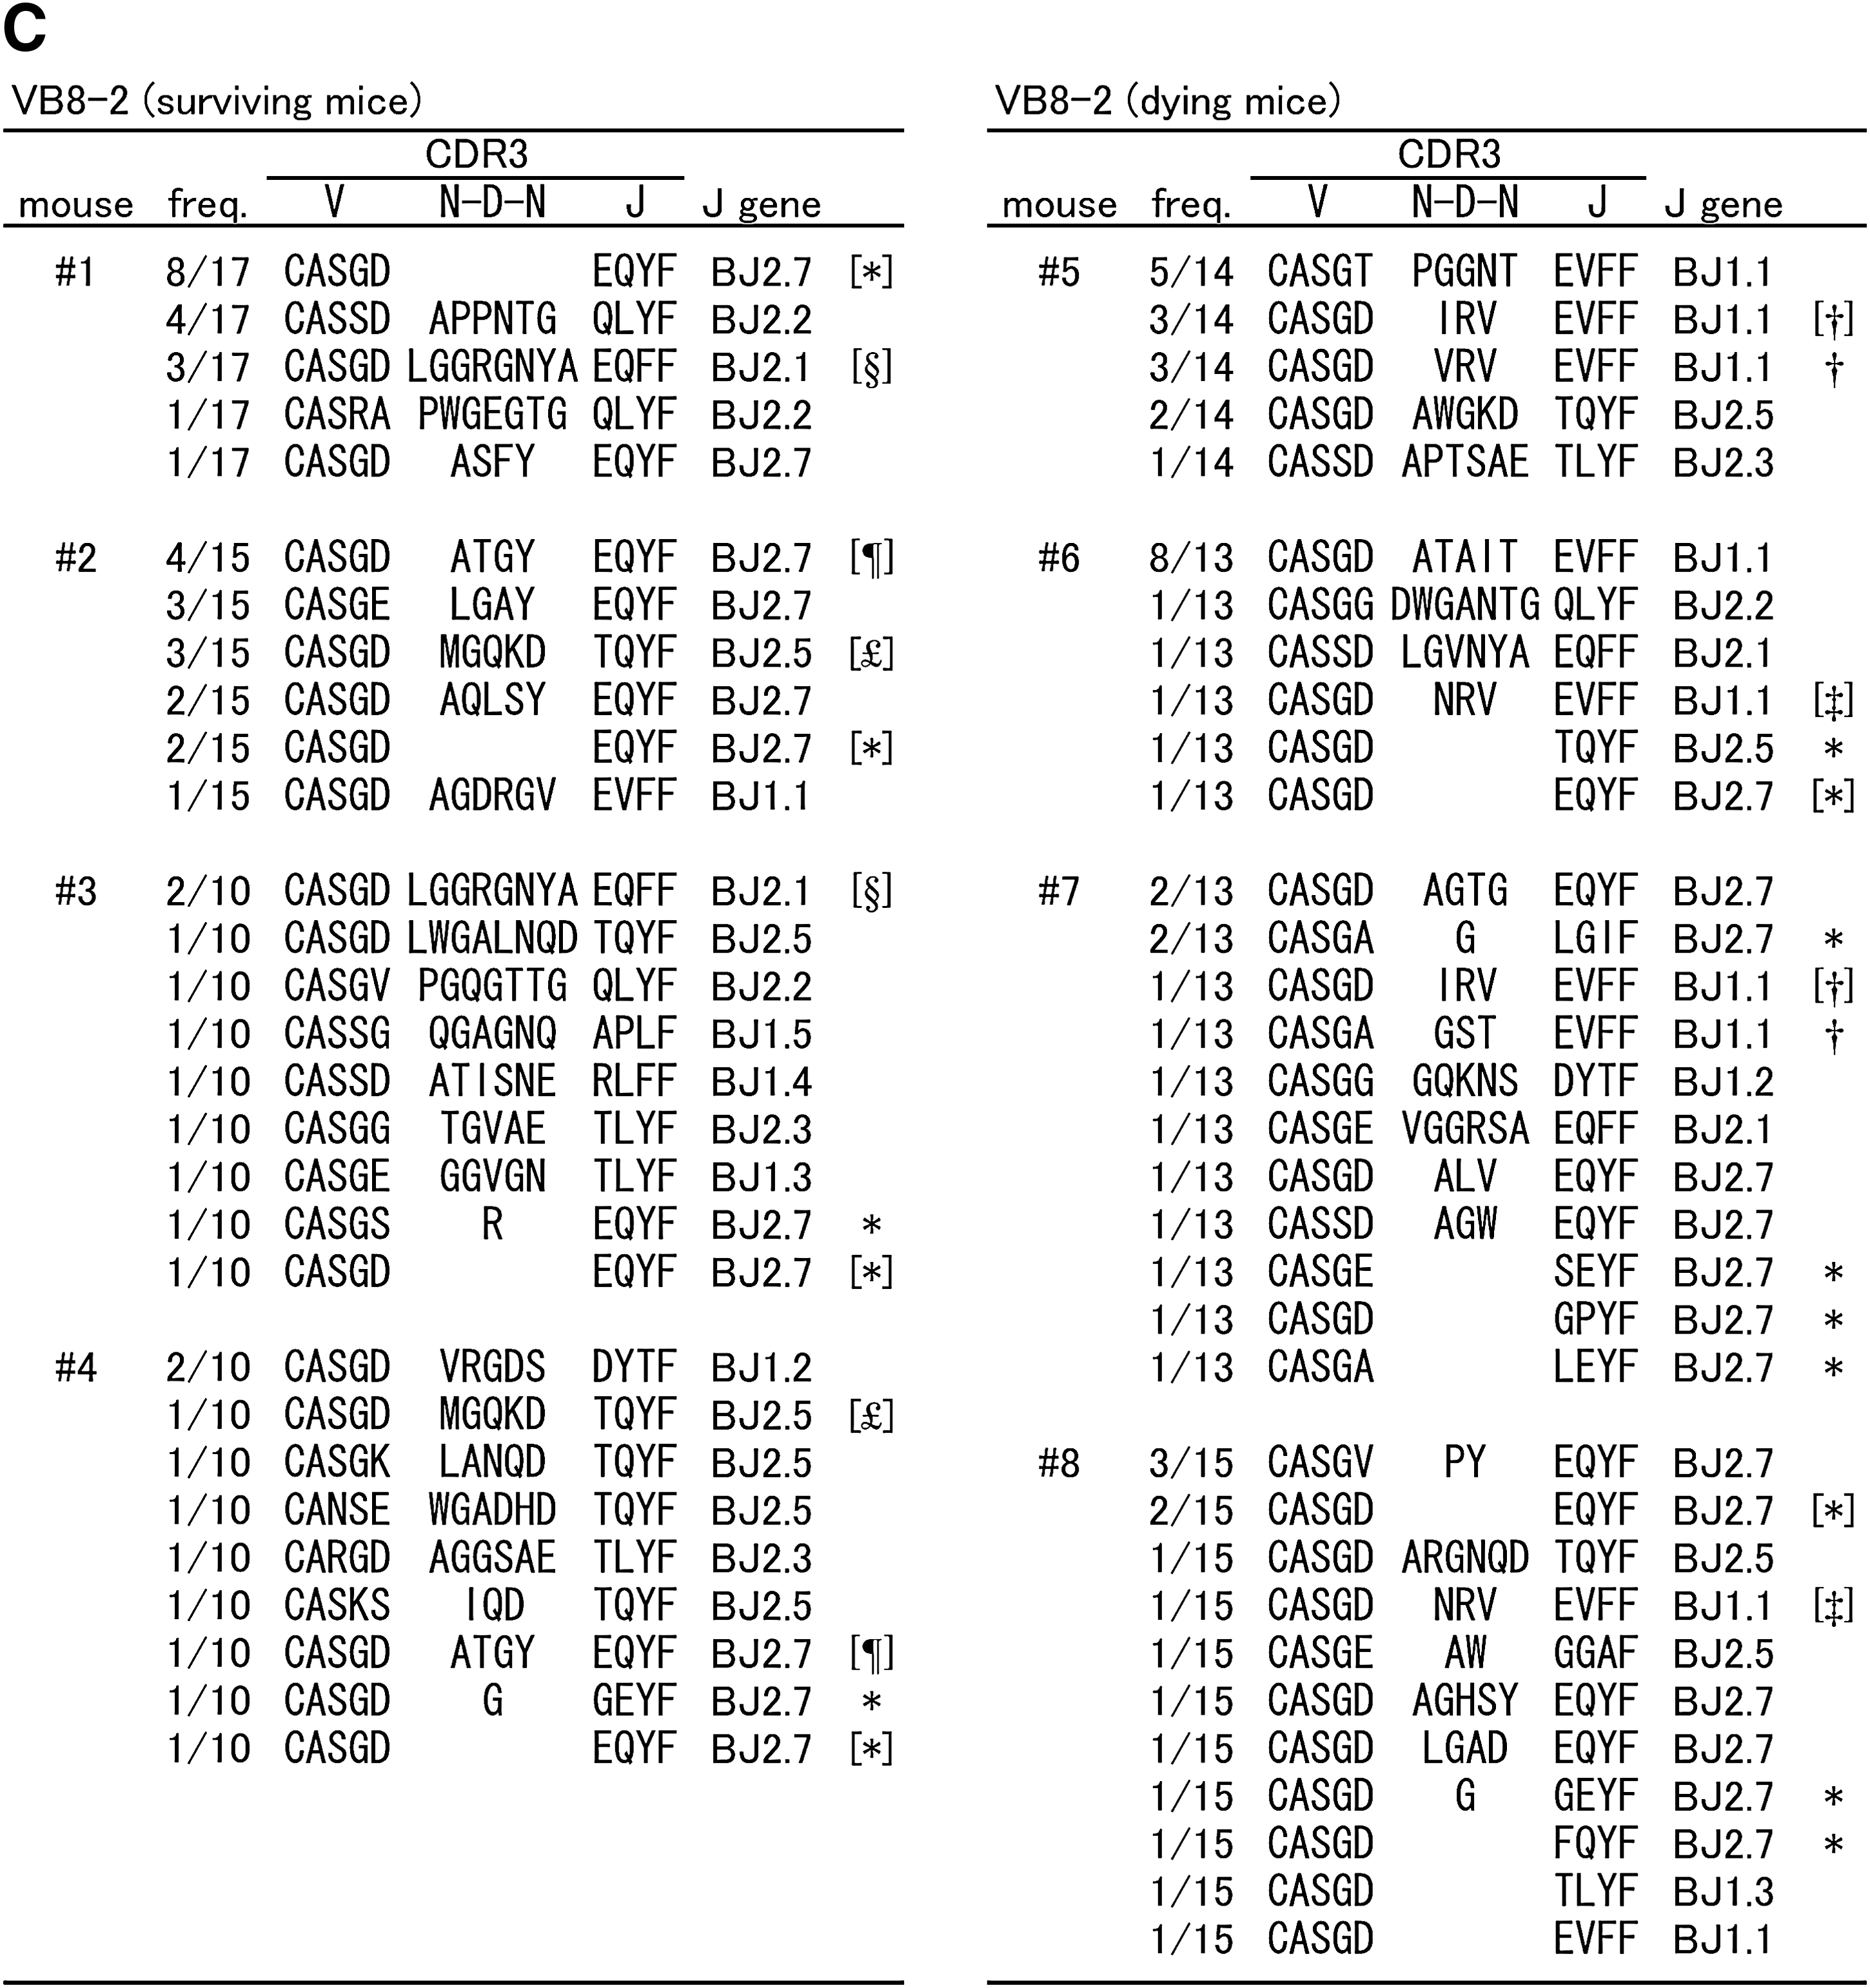
Because differences in T-cell clonality were observed between surviving and dying mice, nucleotide sequences of the CDR3 were determined for the above-mentioned TCR families, using PCR-amplified and randomly-selected cDNA clones. Predicted amino acid sequences are shown along with the frequencies of cDNA clones derived from the brains of individual mice infected with TBEV (Fig. 4). Cysteine (C) at the N-terminal portion and phenylalanine (F) or tryptophan (W) at the C-terminal portion are not contained within CDR3. Despite the fact that we analyzed more than 30 clones in mock-infected spleens, we did not find any clones with identical sequence (data not shown). Meanwhile, in TBEV-infected brains, many clones with identical sequences were found. VA8-1 (Fig. 4A) surviving mice were divided into two groups: individuals with high frequency of AJ23 gene usage (#1 and #3) or AJ15 gene usage (#2 and #4). Although dying mice also produced some clones bearing AJ23 or AJ15, the frequency of these clones was lower than in surviving mice. For VA15-1 (Fig. 4B), a high frequency of AJ12 gene usage was observed in dying mice. In addition, clones with identical amino acid sequences to CDR3 (CAAS GA GGYKVVF) were detected in all four dying mice. Identical clones bearing AJ9 and AJ22 were detected in both surviving and dying mice. For VB8-2 (Fig. 4C), a high frequency of BJ2.7 genes with short CDR3 consisting of seven amino acids (aa) was characteristic for both surviving and dying mice. Clones with such a short CDR3 were rare in TCR β chains. Some clones bearing BJ1.1 with 10 aa CDR3 (CASGD XRV EVFF, X = I, V or N) were found in every dying mouse. As shown for VA8-1, VB8-2 surviving mice were also divided into two groups: individuals (#1 and #3) that obtained clones with BJ2.1 (CASGD LGGRGNYA EQFF), or individuals (#2 and #4) that obtained clones with BJ2.7 (CASGD ATGY EQYF) and BJ2.5 (CASGD MGQKD TQYF). The frequencies of these three clones were not high in each individual, but were specific for each group. In mouse #5, there was no clone bearing BJ2.7 or short CDR3, therefore the frequency of these clones might be high but not necessary in TBEV-infected mice. As illustrated by mice #7 and #8, a high single peak in CDR3 size spectratyping analysis does not necessarily indicate monoclonal expansion. Clones were also sometimes included that were the same size as CDR3, yet had different sequences. However, several reports have shown that the β-chain J region of CDR3 does not specifically interact with antigen peptides (7,11,13,14,43). The sequence of the N-terminal half of CDR3 (V segment, D segment, and N addition) rather than J gene usage might therefore be important, as potentially each clone with a short CDR3 recognizes an identical antigen peptide. To organize sequence data, clone frequencies with more than 10% J gene usage in the total number of clones analyzed for each V family were individually plotted in Fig. 5. CDR3 length was considered for the β chain. Using the Mann-Whitney U test, the frequency of VA8-1/AJ15 was significantly higher in surviving mice, and the frequencies of VA15-1/AJ12 and VB8-2/BJ1.1 (10 aa) were significantly higher in dying mice. This suggests that these T-cell clones might be closely associated with disease severity in TBEV-infected mice.

Amino acid sequences of TCR CDR3 regions of cDNA clones derived from TBEV-infected mouse brains. For the VA8-1 (
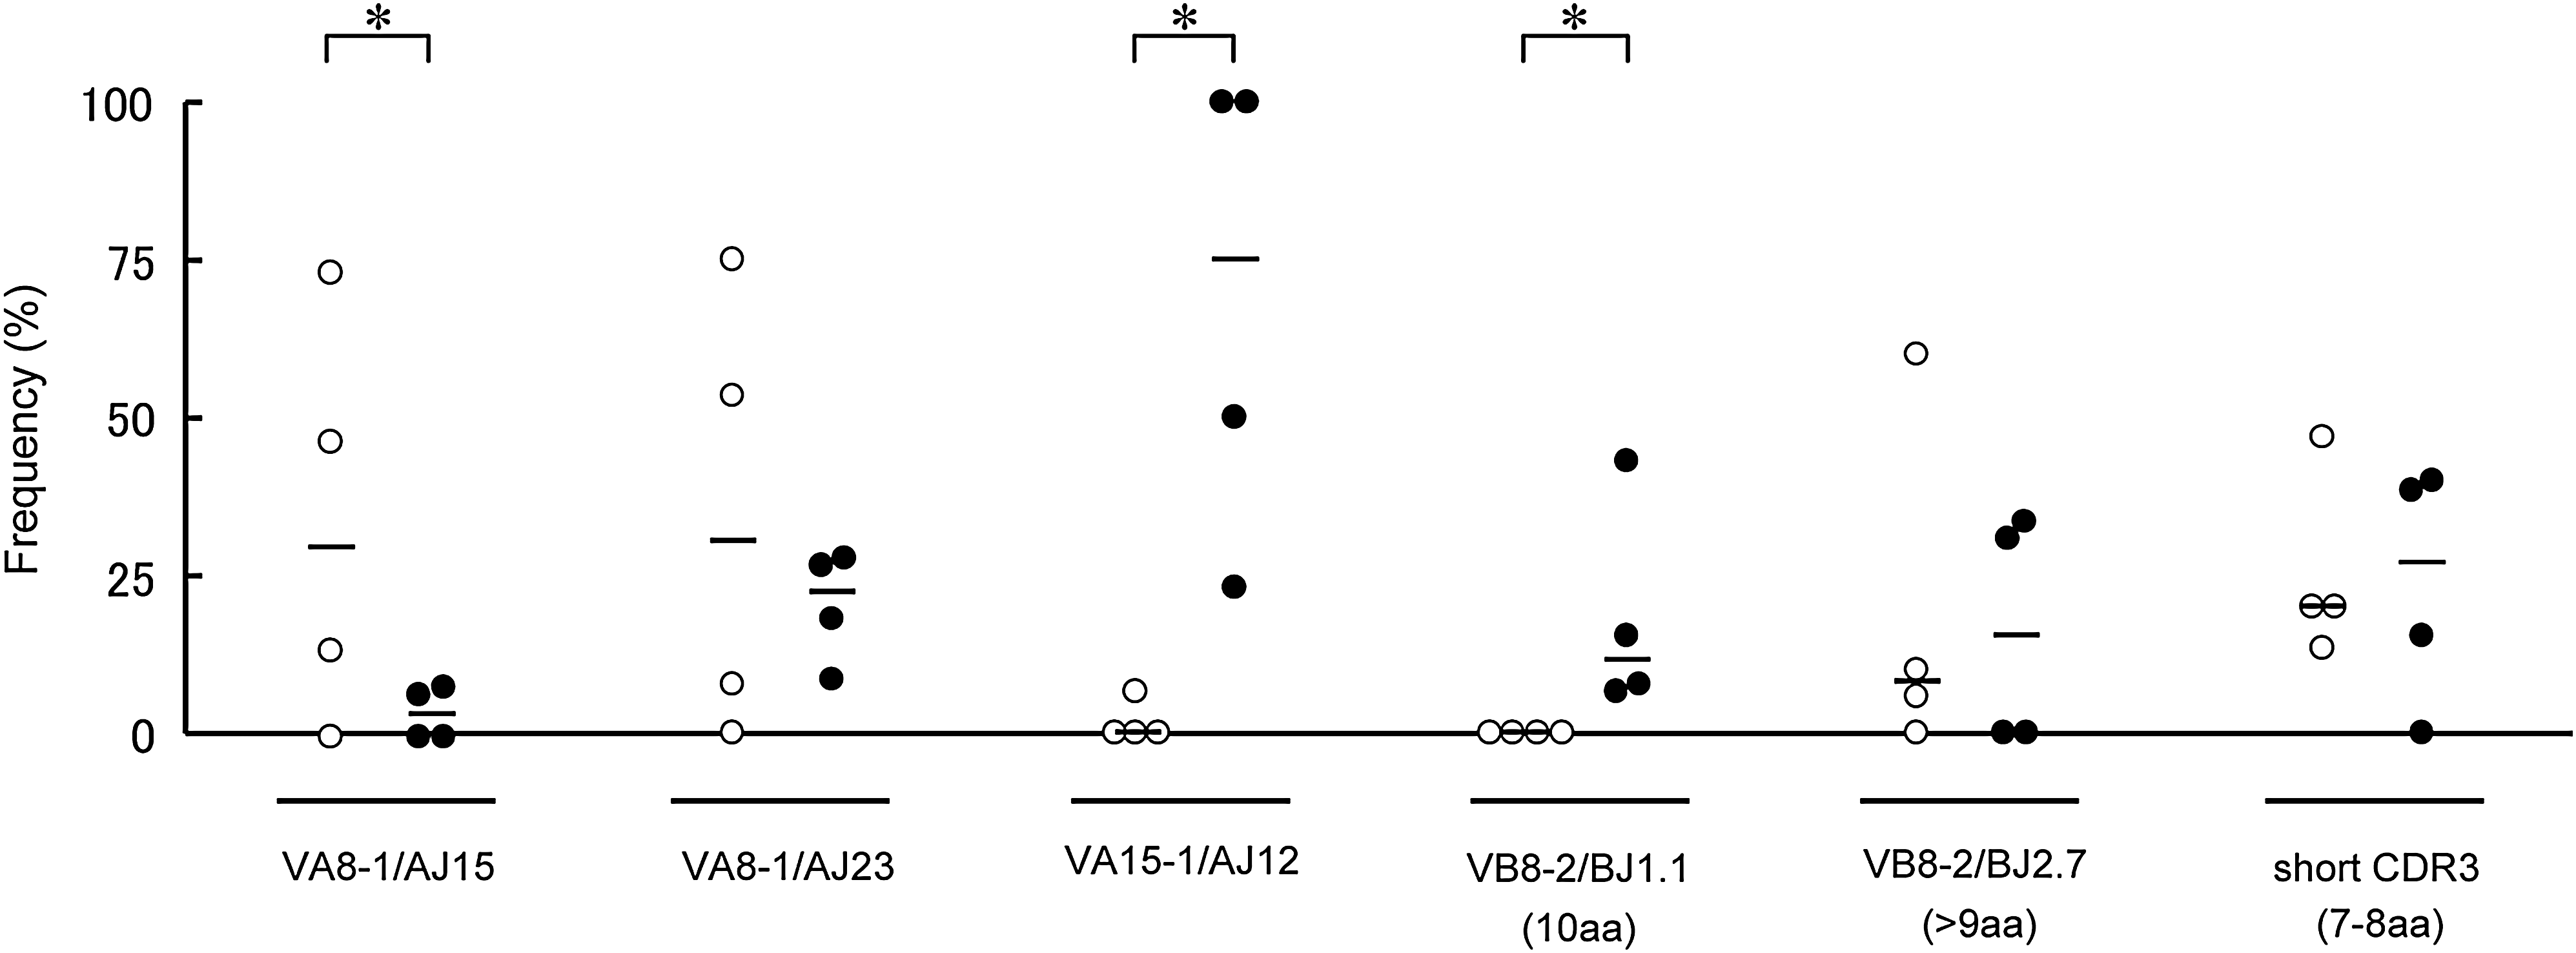
Differential patterns of TCR gene usage between surviving and dying mouse brains. Frequencies for characteristic combinations of V and J gene usages were individually plotted. CDR3 length was taken into consideration for β chain: BJ2.7 (long) indicates CDR3 consisted of more than 9 aa, and short CDR3 indicates CDR3 consisted of 7 or 8 aa. Open circles indicate surviving mice, and closed circles indicate dying mice. Bars indicate the median for each group. Asterisks denote statistically significant (p < 0.05) differences between surviving and dying mice using the Mann-Whitney U test.
Levels of cell surface markers and cytokines determined by qPCR
Differential patterns of T-cell clones can indicate that brain-infiltrating cells may play different roles between surviving and dying mice. To investigate the active state of the infiltrating cells, we studied the expression levels of T-cell antigen markers, lymphocyte activation markers, and apoptosis-related genes: CD3, CD4, CD8, and CD25 (expressed on activated T cells and B cells) (28), CD69 (expressed rapidly after lymphocyte activation) (47), and Gzm A, Gzm B, perforin, and FasL using qPCR analysis (Fig. 6). The resulting expression levels for all genes in TBEV-infected brains studied were significantly increased when compared with mock infection. This was especially the case for the expression of CD69, Gzm A, and Gzm B, which were increased more than 100 times. No significant differences were observed between mouse groups, indicating that equivalent CD8+ T-cell infiltration into TBEV-infected brains occurs in surviving and dying mice with similar activation state levels.
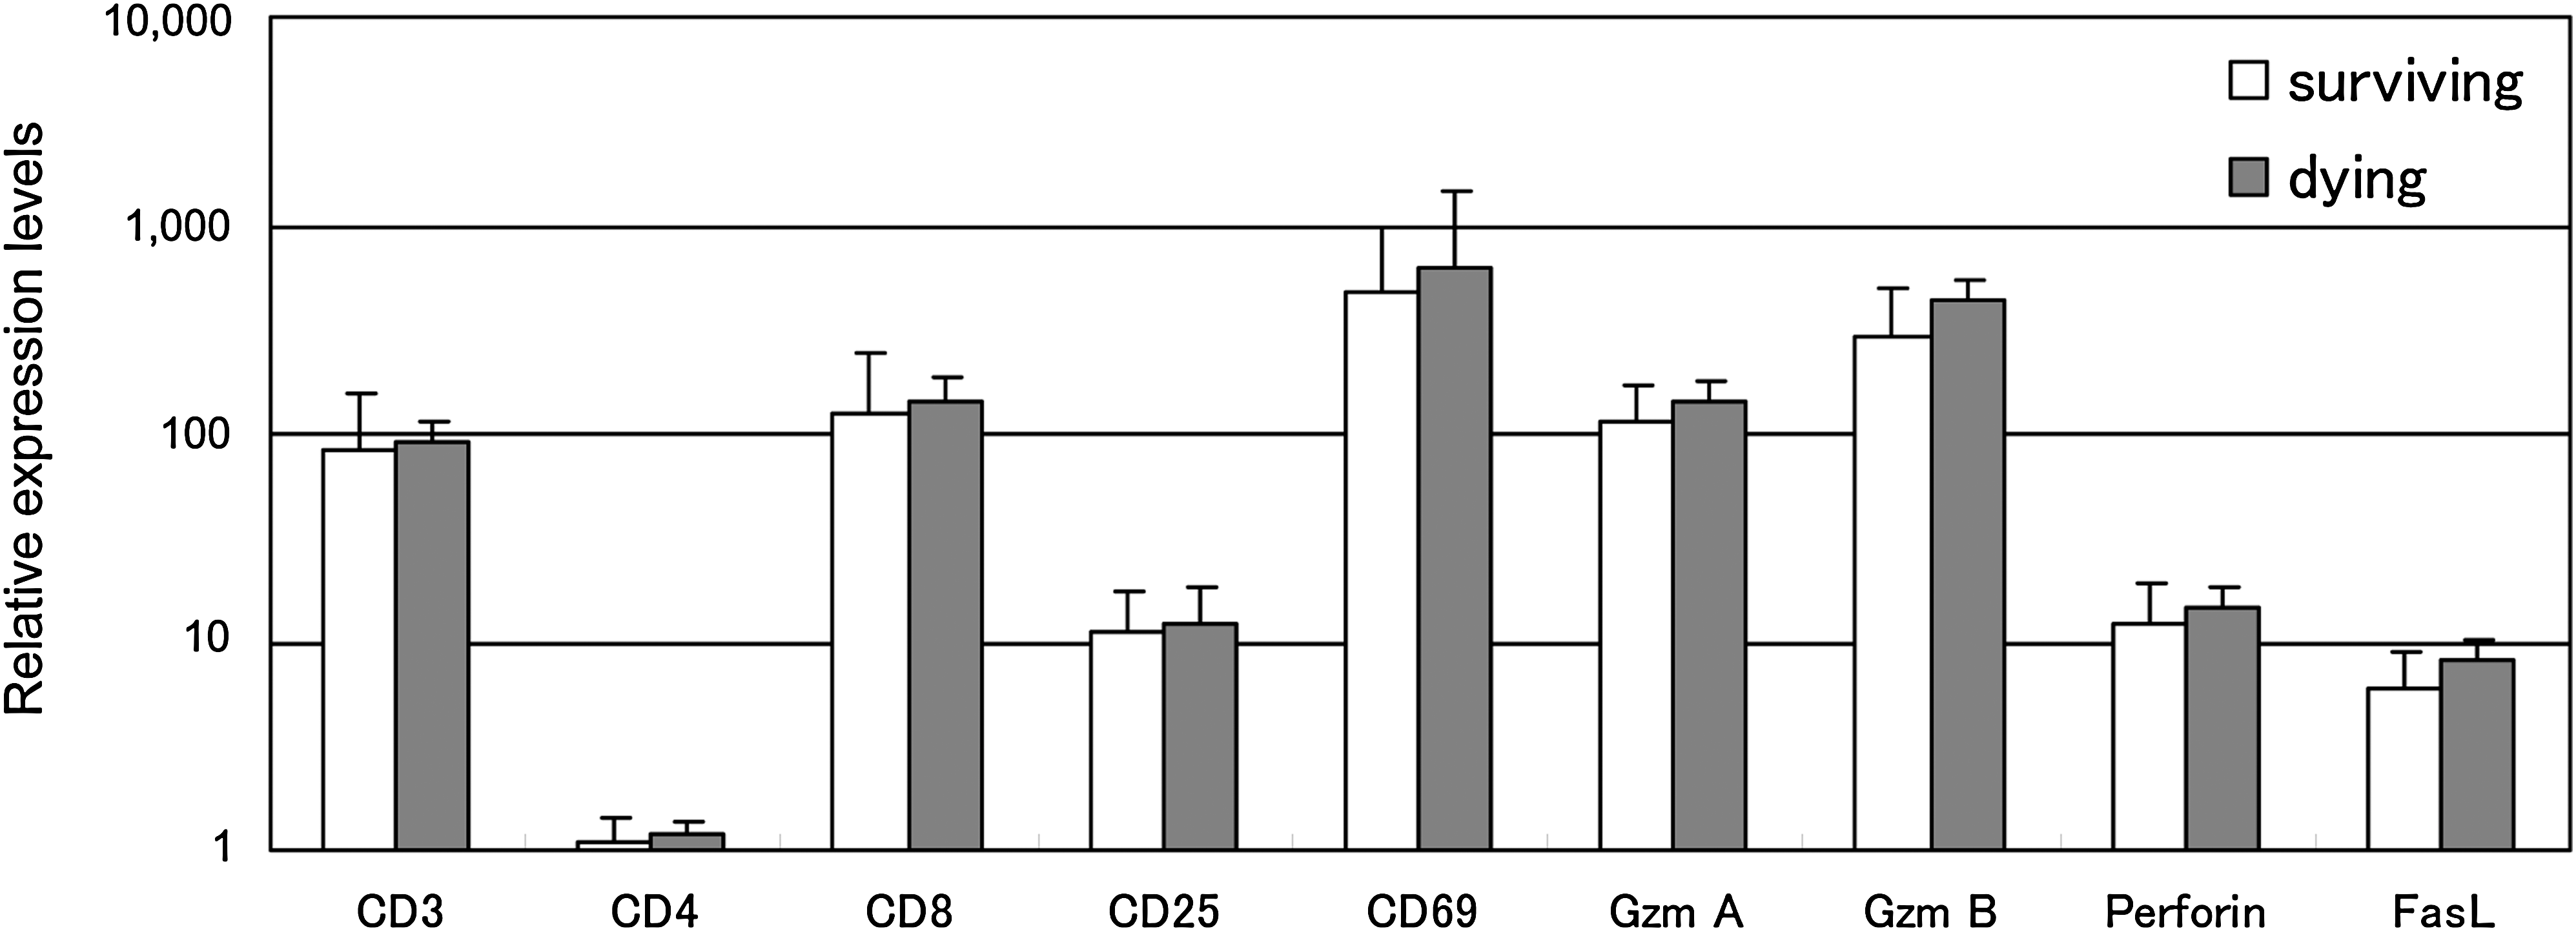
Quantification of mRNA expression of T-cell-related antigens, activation markers, and apoptosis-related genes in brains using qPCR. Sample RNAs were extracted from brains of mock-infected and TBEV-infected surviving and dying mice at 13 dpi (n = 4). The mRNA expression levels in TBEV-infected brains were normalized by GAPDH expression and are shown as the relative expression levels compared with mock-infected brains. Vertical error bars indicate the standard deviation of three independent experiments.
Discussion
Understanding the clinical variability caused by encephalitic flavivirus infection is important in explaining differences between severe and subclinical human cases. It may also further elucidate the mechanism of pathogenesis for viral encephalitis. Previous reports showed that the TBEV Oshima strain elicited dose-independent mortality following peripheral infection in some mouse strains (6,21). We therefore distinguished surviving and dying mice by their degree of weight loss after TBEV infection according to our previous study (21), as a simple and effective method to evaluate the severity.
Based on the amount of viral RNA in brain tissue, we found no difference in virus replication between surviving and dying mice. This result suggests that direct virus-induced neuronal injury cannot completely explain the severity of TBEV infection. In our previous study (21), large numbers of CD8+ T cells infiltrated the brains of TBEV-infected mice, yet no significant difference was observed between surviving and dying mice. We therefore investigated the individual characteristics of brain-infiltrating T cells in this study.
TCR repertoire analysis revealed that the frequencies of T cells bearing VA8-1, VA15-1, and VB8-2 were significantly increased in TBEV-infected mouse brains compared with those of spleens. However, there was no significant difference between surviving and dying mice. This indicated that once a certain amount of virus was inoculated, T cells with selected TCR V families accumulate in the brain regardless of disease severity. In contrast, clonality results and CDR3 sequencing analysis indicated a distinct difference between mouse groups, with frequencies of VA15-1/AJ12 and VB8-2/BJ1.1 gene usage higher in dying mice. One clone with an identical CDR3 sequence (CAAS GA GGYKVVF) was detected in all four dying mice, strongly suggesting that this clone was associated with severe encephalitis. High frequencies of VA8-1/AJ15 gene usage were characteristic of surviving mice, while high frequencies of VB8-2/BJ2.7 gene usage and clones with short CDR3 were observed in both surviving and dying mice. We therefore observed a unique increase of T-cell clones for each mouse group. Specific clones were found only in dying mice, while other clones were frequently found in surviving mice or were commonly found in every infected mouse. Thus, there are several T-cell clones that may be associated with the severity of TBEV infection, while the remaining clones may be different in each mouse. T cells associated with surviving mice may also be variable and were divided into two groups based on CDR3 sequence patterns for VA8-1 and VB8-2. Thus, specific mechanisms to overcome TBEV infection may exist. It is therefore further worthwhile to investigate the roles of the distinct clones identified in our study, especially clones with VA15-1/AJ12, VB8-2/BJ2.1 (10 aa), and VA8-1/AJ15, that exhibited different patterns between surviving and dying mice.
The large sequence variation observed in our data can be explained by multiple reasons. First, TCR-peptide MHC (pMHC) recognition is flexible (1), and different TCRs with similar binding capabilities can recognize identical antigen peptides. Such flexibility may therefore produce variations in induced T-cell clones in TBEV-infected brains. Another possible reason relates to the presence of quasispecies. Noncloned RNA viruses generally exist as a quasispecies (22,25), and it has been reported that the virus stock used in our study was a complex of quasispecies (19). Consequently, the different amino acids for the antigen peptides among the quasispecies might produce T-cell clone variations in TBEV-infected brains.
We must also consider why different characteristics between surviving and dying mice were observed despite of an absence of differences between these groups in TCR repertoire analysis. Common V gene usage means that the TCR could recognize identical or similar antigen peptides (12,33). However, as described above, TCR-pMHC recognition can allow for some cross-reactivity; for example, different TCRs can bind to the same pMHC, and a single TCR can bind to a different pMHC (29,46). Therefore, TBEV infection can induce multiple T-cell clones with certain V genes that recognize specific antigens, yet only a few may play a critical role.
Different roles may also exist for the distinct T-cell clonotypes found in surviving and dying mice. However, qPCR analysis failed to identify any difference in T-cell function-associated markers between these groups, and apoptosis-associated genes were almost equivalently expressed in both surviving and dying mice. As this was the result for total brain expression, further studies of each T-cell clonotype are needed. We also need to investigate if the difference in target antigens recognized by T cells has an impact on severity and fatality rather than activation level. Or perhaps the difference in T-cell clonotype resulted from encephalitis progression and requires further investigation.
We must exercise care, because virulent and host immune responses can be very different in experimental models, depending upon the subtype and strain of virus, the mouse strain, and so on. In addition, because our data are based on analysis at 13 dpi only, we may need to investigate immune responses at earlier time points post-infection. We previously reported increased levels of serum corticosterone in dying mice (21). Glucocorticoids are known to exert immunomodulatory effects by activating the hypothalamic-pituitary-adrenal axis and/or cytokine expression (2,31). Thus, the relationship between T-cell clone bias and the level of corticosterone is interesting and warrants further investigation.
In conclusion, we have revealed an association between brain-infiltrating T-cell clones and severity in TBEV-infected mice, although the cause of this relationship is still unclear. Specifically, as the brain is originally free from adaptive immunity, it is unknown whether particular T-cell accumulation determines disease severity, or if a certain type of disorder induces particular T-cell accumulation by changing antigen presentation patterns. Further experiments are needed to elucidate which factor causes the difference in induced T-cell clones. Although our results are complicated, we believe our data are an initial step in better understanding of the mechanisms of viral encephalitis.
Footnotes
Acknowledgments
We thank the Tokyo Metropolitan Institute for Neuroscience for their assistance with animal experiments in the BSL3 laboratory.
This work was supported in part by Grants-in-Aid for Research on Emerging and Re-emerging Infectious Diseases by the Ministry of Health, Labour, and Welfare, Japan (grant H20-shinkou-ippan-015), and Research on Publicly Essential Drug and Medical Devices from the Japan Health Sciences Foundation (grants KH53333 and KHC3332).
Author Disclosure Statement
No competing financial interests exist.