
Abstract
The level of viral DNA in early HIV-1 infection is an important parameter in the prediction of disease progression. Few data have been published on the dynamics of HIV-1 DNA during the first year of HIV infection. In this study, two distinct HIV-1 patient groups were enrolled. Group 1 (CD4High group) maintained their CD4 above 450 cells/μL within 1 year, while Group 2 (CD4Low group) progressed to CD4 below 300 cells/μL. The amounts of total, 2-long terminal repeat (2-LTR) circular, and integrated HIV-1 DNA were determined in the peripheral blood mononuclear cells at 1, 3, 6, and 12 months after HIV infection. Reductions in the amount of total and integrated HIV-1 DNA were detected in the CD4High group during the first year of HIV infection but not in the CD4Low group. Disease progression may be related to the body's ability to control HIV-1 DNA during early HIV-1 infection.
Introduction
I
HIV-1 DNA usually comprises a linear nonintegrated form, a circular nonintegrated form, and an integrated provirus. Circular nonintegrated HIV-1 DNA remains extrachromosomal in the form of 1-LTR circles or 2-LTR circles.
In this study, we described and compared the longitudinal changes in total, 2-LTR circular, and integrated HIV-1 DNA during the first year of HIV-1 infection in two distinct patient groups.
Patients and Methods
Study participants
This study enrolled subjects from an ongoing prospective clinical cohort study of acute HIV-1-infected individuals in Beijing (8,10,11). Starting in October 2006, men who have sex with men (MSM) were enrolled into a longitudinal prospective cohort study if they were at least 18 years old and HIV negative at baseline. After enrollment, these HIV-negative men were monitored every 2 months for plasma HIV antibodies, HIV RNA levels, and clinical signs of acute infection. Fifteen patients recently infected with HIV-1 were recruited from the cohort. According to the results of standard clinical laboratory tests to detect HIV-1, the 15 patients were in Fiebig stages III–IV and were estimated to have been infected for 1 month at the time of their first positive HIV-1 test (5,6). Blood samples were collected at months 1, 3, 6, and 12 after HIV infection and without ART. Eight of the 15 patients (patients 1–8) maintained their CD4 counts above 450 cells/μL during the first year of HIV infection, whereas the other seven patients (patients 9–15) had CD4 counts below 300 cells/μL (Table 1).
HIV-1 DNA quantification
Total DNA was extracted from the patients' peripheral blood mononuclear cells (PBMCs) using the QIAamp DNA Blood Mini Kit (Qiagen, Hilden, Germany). Real-time polymerase chain reaction (PCR) was used to quantify the HIV-1 DNA based on previous studies (1,3,17).
Determination of the HIV-1 subtypes
To determine the HIV-1 subtypes of the enrolled patients, viral RNA was extracted from patient plasma using the QIAamp Viral RNA Mini Kit (Qiagen, Valencia, CA). HIV-1 cDNA was obtained by reverse transcription followed by PCR using the TaKaRa One-Step RNA PCR kit (TaKaRa Biotechnology Co., Ltd., Dalian, China). The HIV-1 cDNA was then subjected to multiple nested PCR reactions to amplify the gag and env genes. The resultant sequences were ultimately subjected to an HIV-1 Blast search to compare the sequences with related reference sequences in the HIV databases (
HIV-1 viral load
HIV-1 RNA (copies/mL of plasma) was quantified by nucleic acid sequence-based amplification (NASBA, bioMerieux BV, Boxtel, Netherlands). The sensitivity of this assay to detect viral RNA is 50 copies/mL of plasma.
CD4+T-cell counts
T-lymphocyte counts were determined by three-color flow cytometry using human CD3+, CD4+, and CD8+ cell markers (BD Bioscience, San Diego, CA) in whole peripheral blood samples from each patient treated with FACSlysing Solution (Becton Dickinson, San Diego, CA) according to the manufacturer's instructions.
Statistical analysis
All of the data were analyzed using SPSS for Windows v16.0 (SPSS, Inc., Chicago, IL). The nonparametric Mann–Whitney U-test was used to compare medians between the groups. A p-value of <0.05 was considered statistically significant.
Results
Analysis of longitudinal changes in HIV-1 DNA levels in the study groups
In the eight men (patients 1–8) in the CD4High group, the total, 2-LTR circular, and integrated HIV-1 DNA levels exhibited fluctuations and tended to decrease during the first year of HIV-1 infection (Fig. 1). By contrast, in the seven men (patients 9–15) in the CD4Low group, the total, 2-LTR circular, and integrated HIV-1 DNA proviral loads exhibited fluctuations and tended to increase during the first year of HIV-1 infection (Fig. 1).
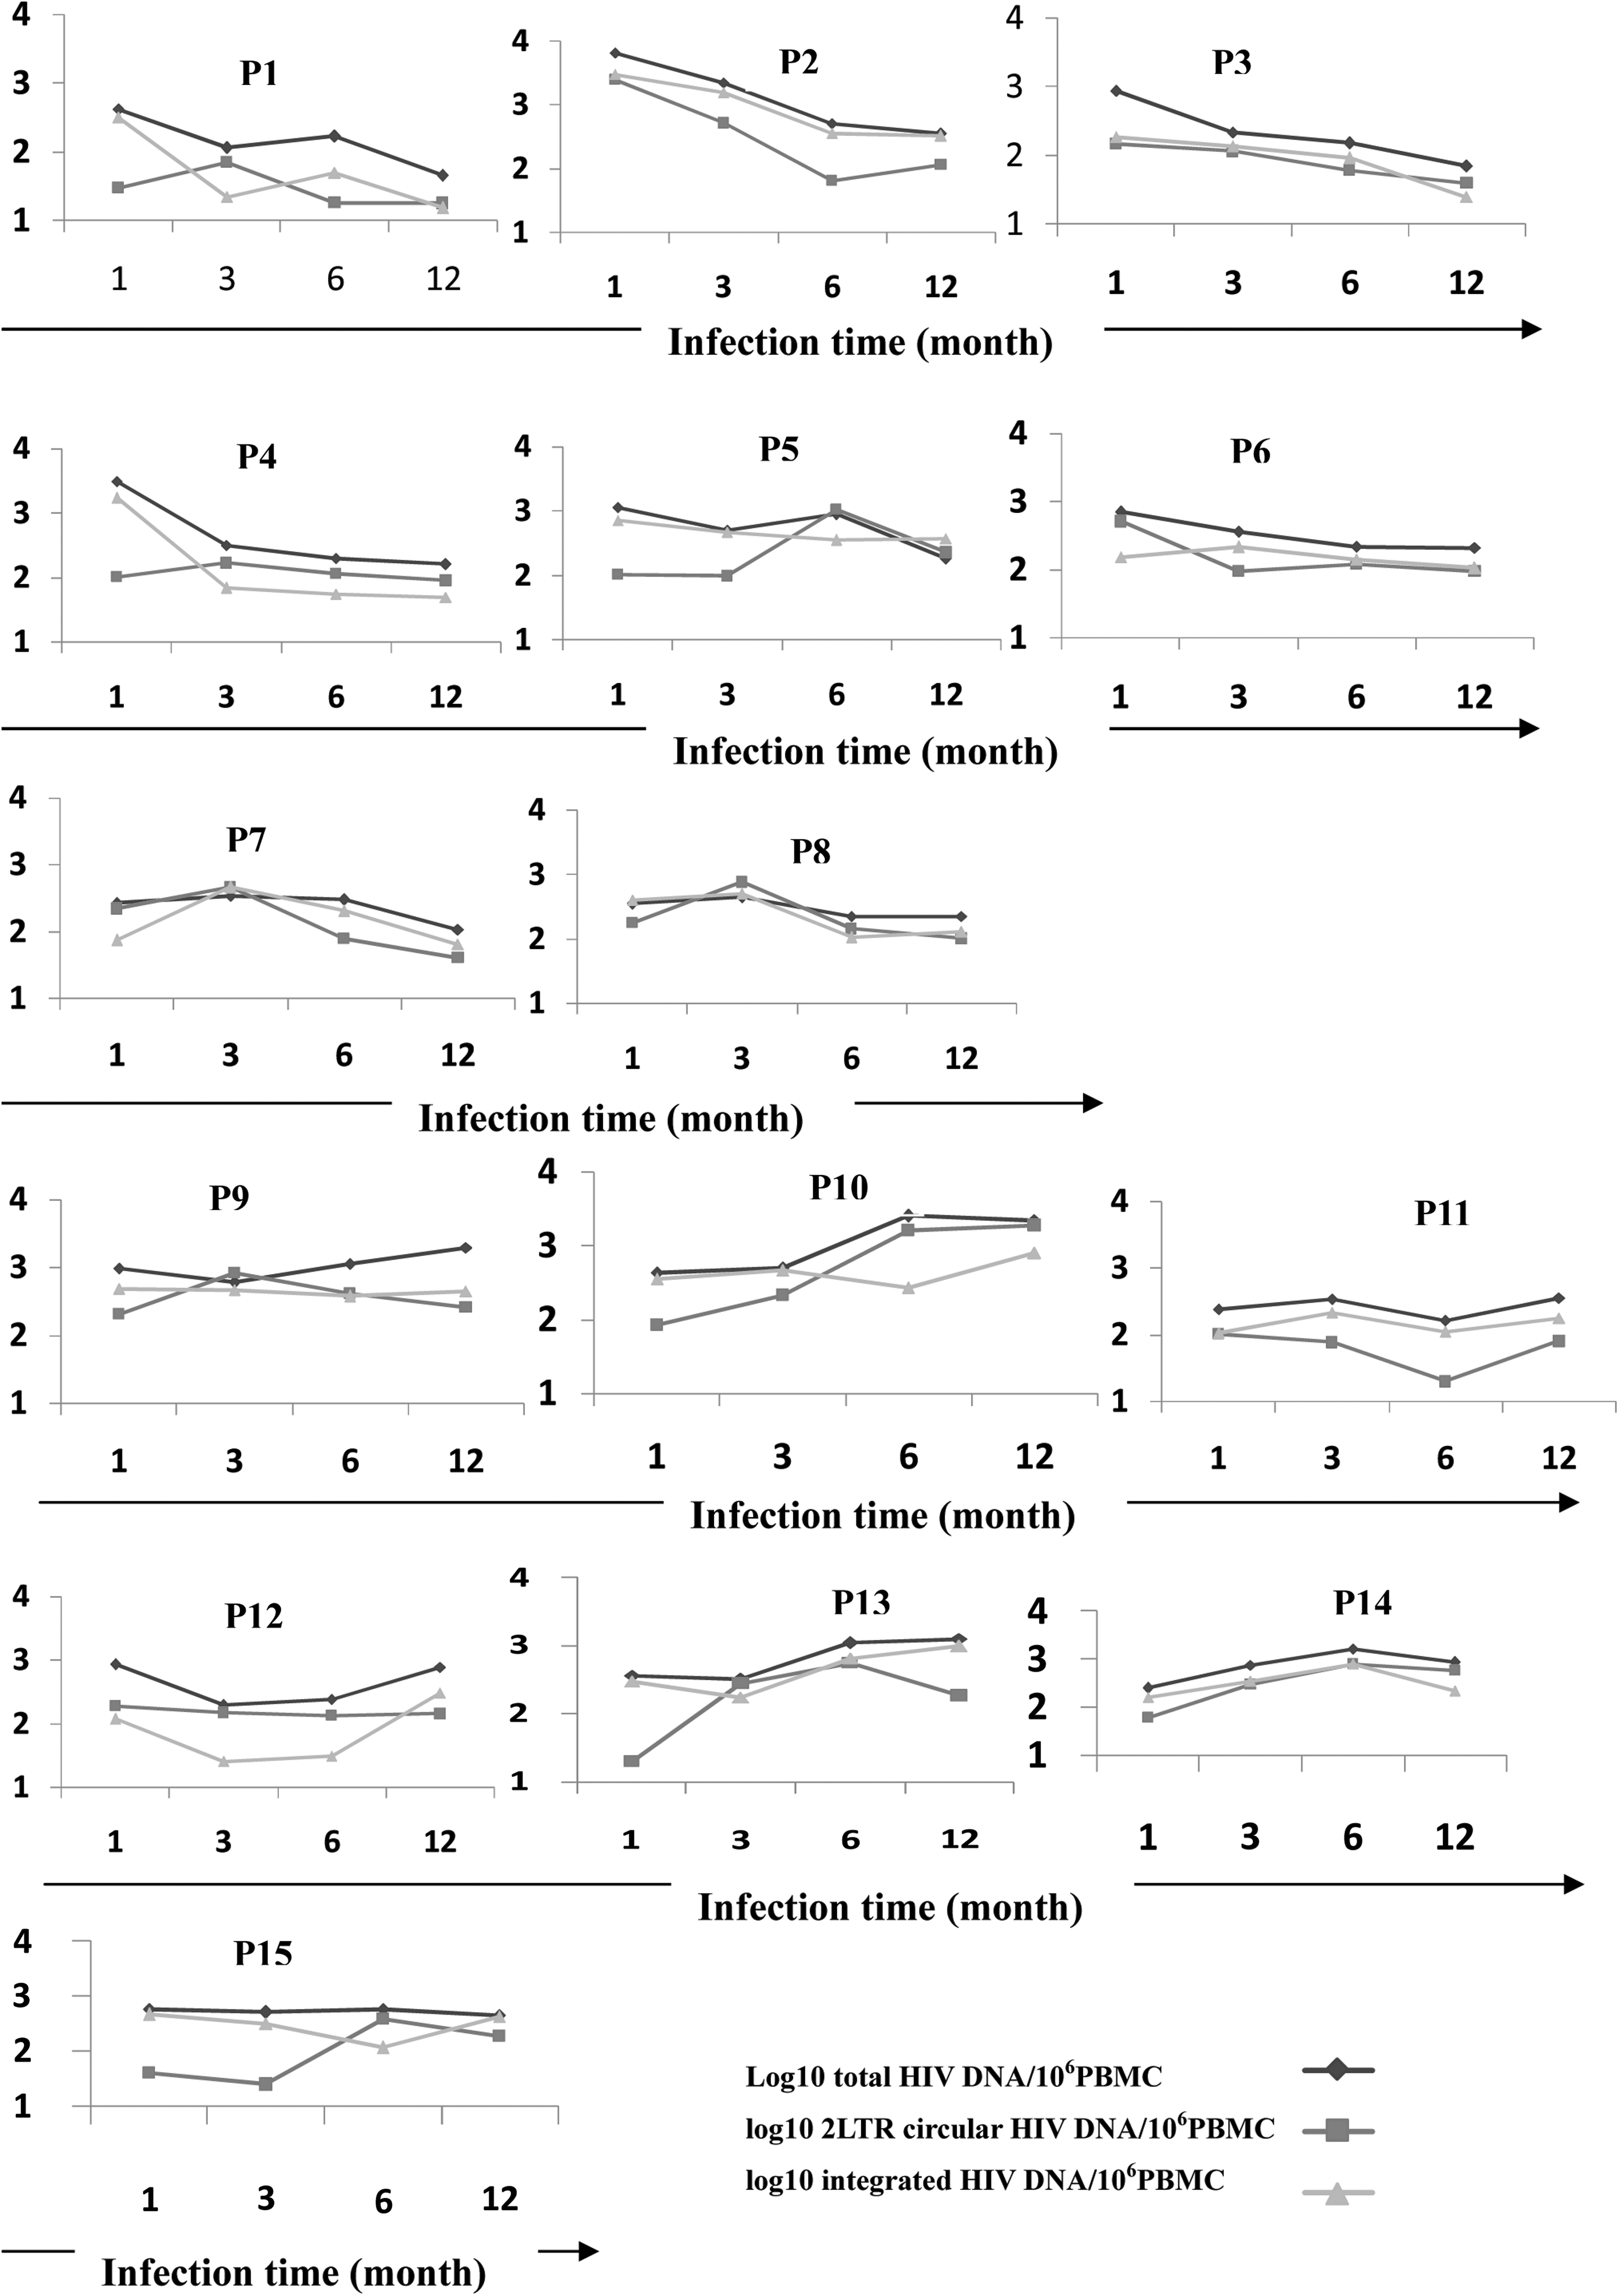
Dynamics of total, 2-long terminal repeat (2-LTR) circular, and integrated HIV-1 DNA levels during the first year of HIV infection in the CD4High (patients 1–8) and CD4Low (patients 9–15) groups.
Comparison of HIV-1 DNA levels between the two groups and between different times of infection
We compared the total, 2-LTR circular, and integrated HIV-1 DNA levels between the CD4High and CD4Low groups during the first year of HIV-1 infection. We found that there were no significant differences in the total and integrated HIV-1 DNA levels between the two groups within the first 6 months of HIV-1 infection (Fig. 2). The levels of total and integrated HIV-1 DNA were significantly higher in the CD4Low group than the CD4High group after 12 months of HIV-1 infection (Fig. 2). There were no significant differences in the 2-LTR circular HIV-1 DNA levels between the two groups during the first year of HIV-1 infection (Fig. 2).
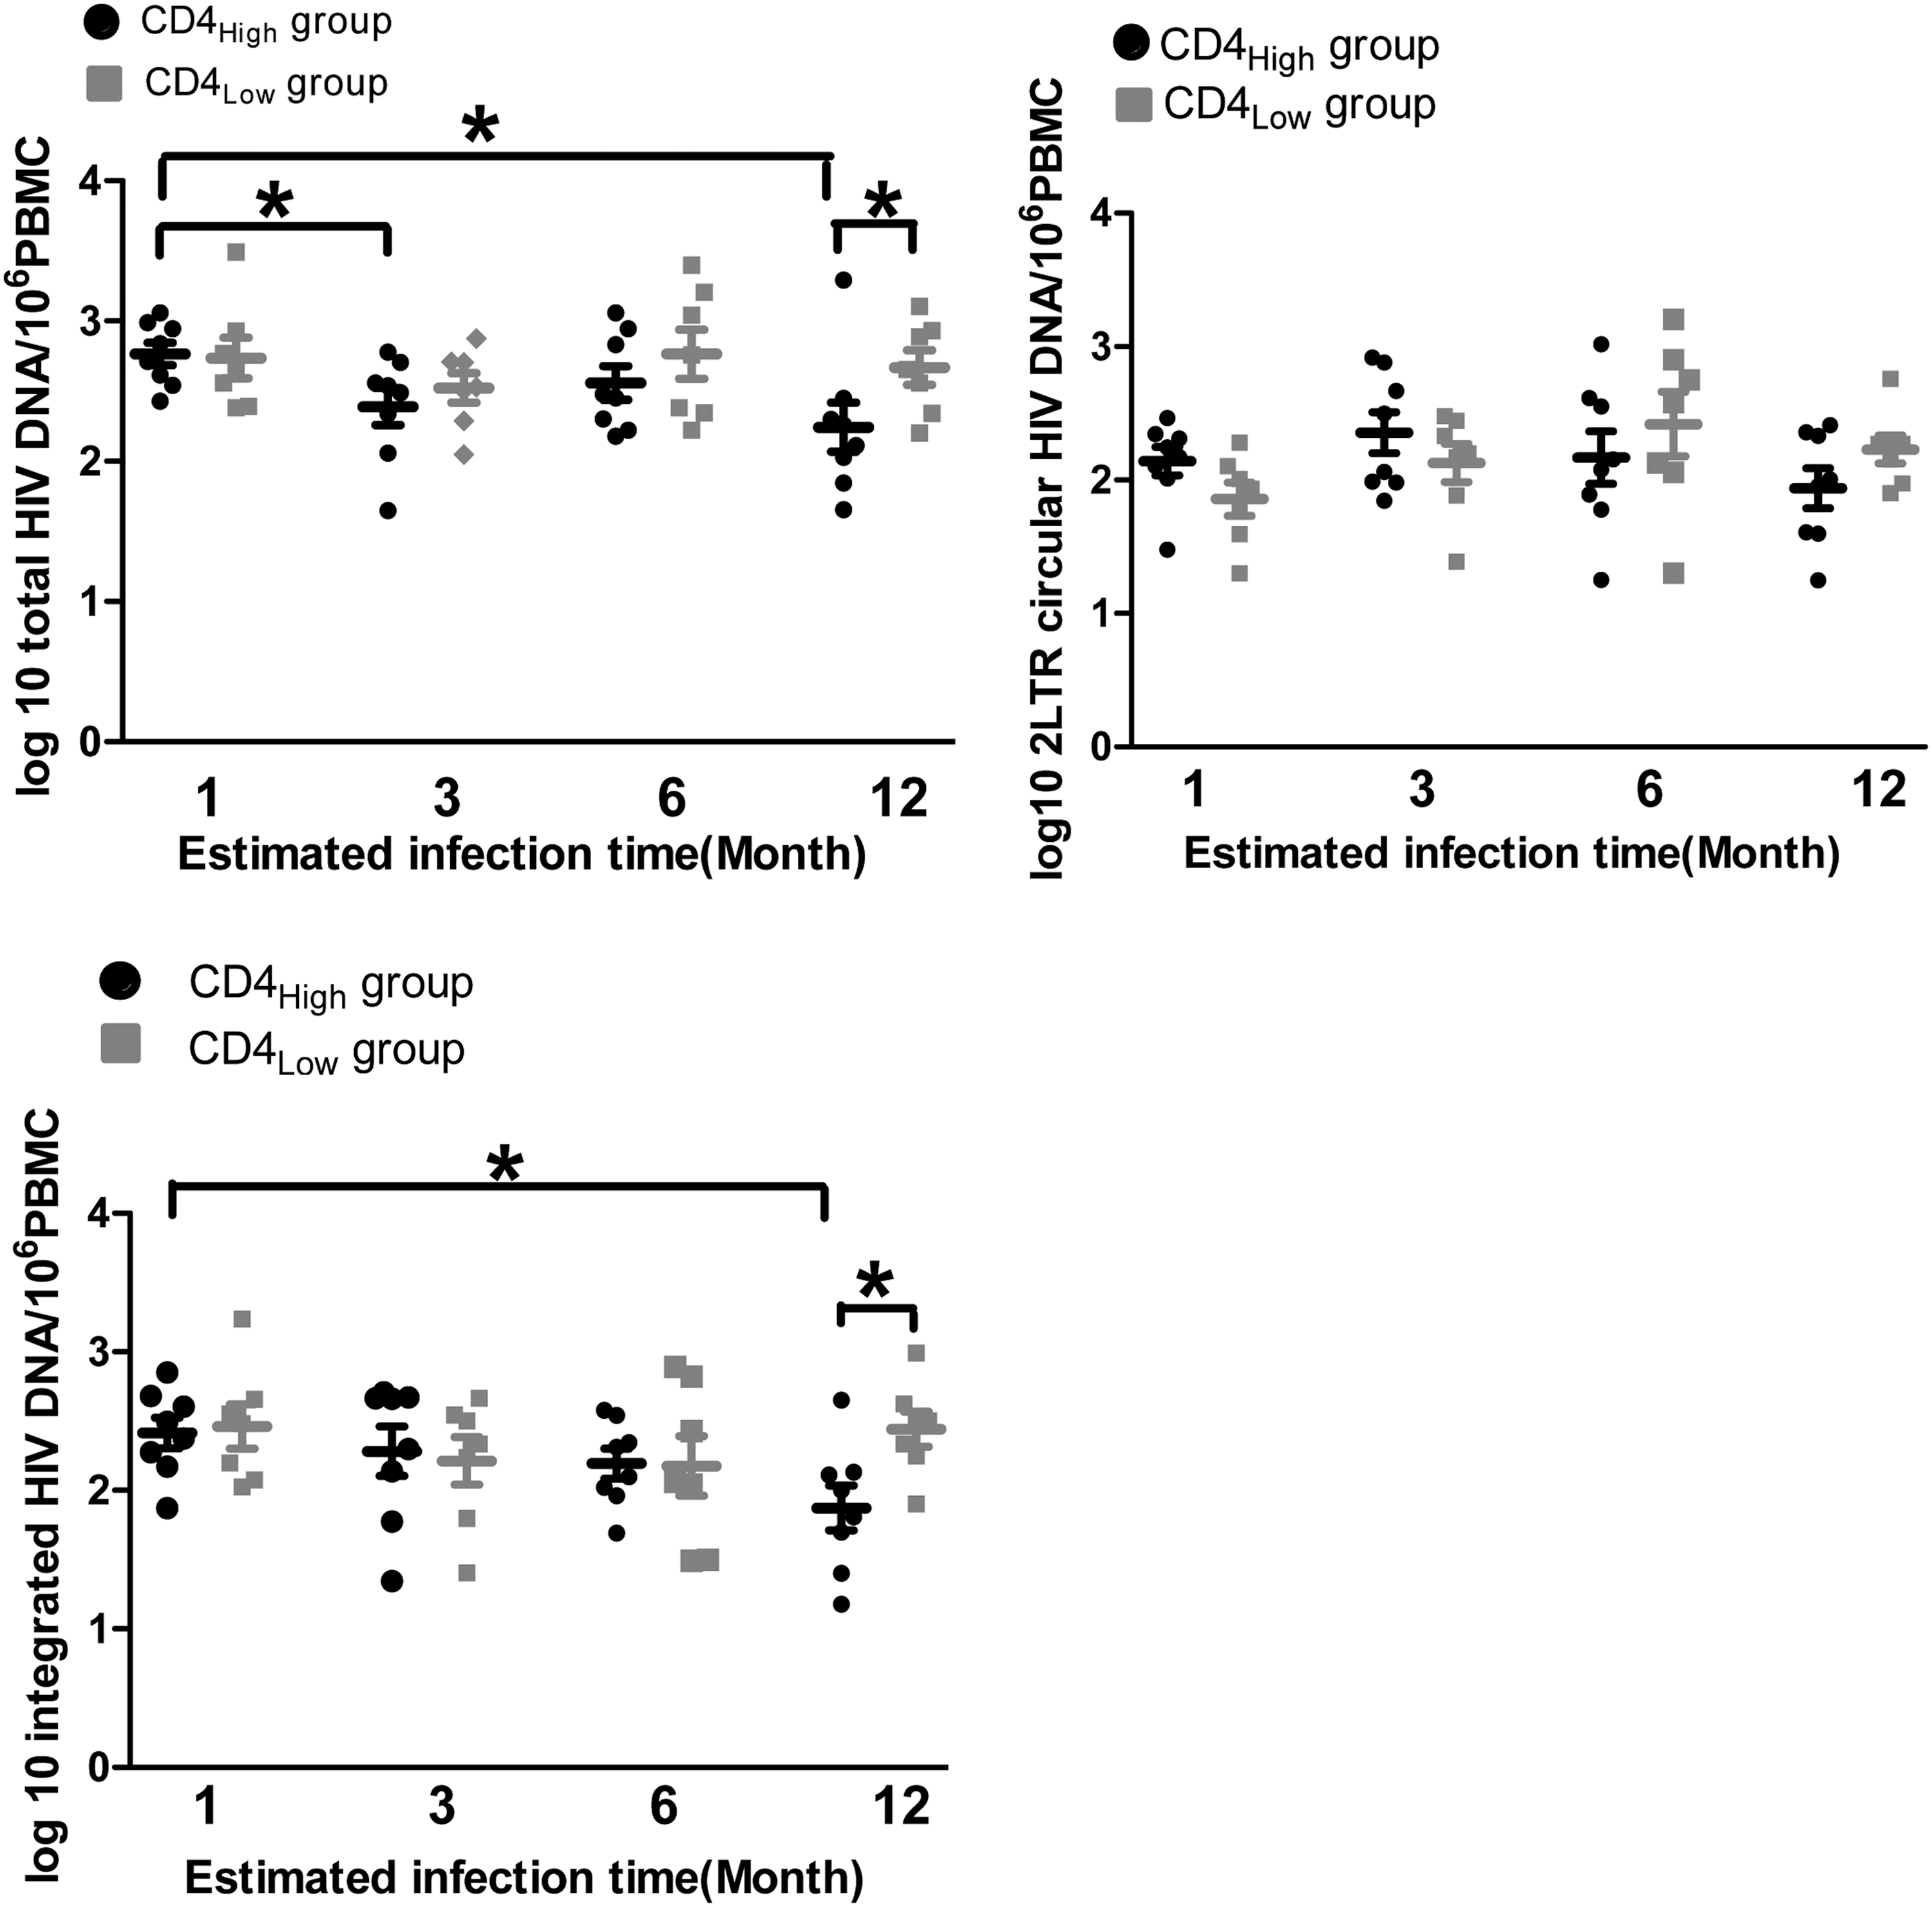
Comparison of HIV-1 DNA levels between the CD4High and CD4Low groups and between different infection times. *p<0.05.
Next, we compared the HIV-1 DNA levels at different times of infection. We found that the total HIV-1 DNA levels after 1 month of HIV-1 infection had decreased by 3 and 12 months of HIV-1 infection in the CD4High group, but there were no differences in the CD4Low group (Fig. 2). There were no significant differences in the 2-LTR circular HIV-1 DNA levels during the first year of HIV-1 infection (Fig. 2). Compared with levels after 1 month of HIV-1 infection, the integrated HIV-1 DNA levels were significantly decreased in the CD4High group after the first 12 months of HIV-1 infection, but no significant changes were observed in the CD4Low group (Fig. 2).
Discussion
The level of viral DNA (both nonintegrated and integrated) in early HIV-1 infection is an important parameter for measuring and predicting disease progression, and it provides critical information for monitoring viral reservoirs (4,7,15,17). In this study, we described and compared the longitudinal changes in the total, 2-LTR circular, and integrated HIV-1 DNA levels during the first year of HIV-1 infection in CD4Low and CD4High patients with HIV-1 subtype AE. We found that there were no obvious differences in the total, 2-LTR circular, and integrated HIV-1 DNA levels between the CD4Low and CD4High patient groups during the first month of HIV-1 infection. After the first month of HIV-1 infection, the HIV DNA levels tended to decrease in the CD4High group, but they did not decrease in the CD4Low group during the first year of HIV-1 infection. After 12 months of HIV-1 infection, the integrated HIV-1 DNA level was significantly higher in the CD4Low group compared with the CD4High group. This result suggests that the degree of host control of the HIV-1 virus during early HIV infection affects disease progression. This outcome may be the result of different levels of immune activation. Two studies by Bosinger et al. and Jacquelin et al. (2,9,12) showed that SIV-induced vigorous immune activation and the upregulation of IFN-stimulated genes in both natural and susceptible hosts; strikingly, the immune responses resolved only in the former. Thus, natural SIV hosts actively engage mechanisms to abort sustained immune activation and its associated harmful effects.
In summary, we report the dynamics of the total, 2-LTR circular, and integrated HIV-1 DNA levels during the first year of HIV infection in different patient groups infected with HIV-1 subtype AE. Considering the small number of cases included in this study, it will be important to verify these results in a future study with a larger patient sample size.
Footnotes
Acknowledgments
This study was supported in part by the National Natural Science Foundation of China (81101250, 81371803), the National 12th Five-Year Major Projects of China (2012ZX10001-003, 2012ZX10001-006), Capital Health research and development special fund (2011-2018-01), Beijing Natural Science Foundation (7132108), High-level Health Personnel Training Program of Beijing Health System (2013-3-072), and Development and Application Research of Beijing AIDS Clinical Data and Sample Repository (D131100005313005).
Author Disclosure Statement
No competing financial interests exist.