
Abstract
The rhesus macaque serves as an animal model for Ebola virus (EBOV) infection. A thorough understanding of EBOV infection in this species would aid in further development of filovirus therapeutics and vaccines. In this study, pathological and immunological data from EBOV-infected rhesus macaques are presented. Changes in blood chemistries, hematology, coagulation, and immune parameters during infection, which were consistently observed in the animals, are presented. In an animal that survived challenge, a delay was observed in the detection of viral RNA and inflammatory cytokines and chemokines which may have contributed to survival. Collectively, these data add to the body of knowledge regarding EBOV pathogenesis in rhesus macaques and emphasize the reproducibility of the rhesus macaque challenge model.
Introduction
E
Studies in filovirus-infected humans have attempted to distinguish between survivors and nonsurvivors based on measures of antibody development, lymphocyte apoptosis, and inflammatory cytokine and chemokine responses. The antibody present in survivors of filovirus infection has been shown to target primarily nucleoprotein, VP35, and VP40 (2,17), which are not expressed on the surface of virions. However, these responses were detected 3–4 weeks after the predicted exposure, long after susceptible patients have succumbed (2,16,17), and they were likely poorly neutralizing as they did not target glycoprotein, the predominant surface protein. Indeed, neutralizing antibodies are of a low frequency in survivors or in patients, and there does not seem to be a temporal correlation between the induction of neutralizing antibody and survival (18). Some data, however, have observed the emergence of an early IgG response in survivors of infection, whereas fatal infection was associated with failure to develop IgG responses against the virus (1,2,4). In terms of lymphocyte apoptosis, individuals who succumbed to infection have been shown to have circulating levels of IFN-γ and FasL early, followed by a demonstrable loss of T-cells; survivors appeared to have delayed T-cell activation, concurrent with recovery from infection (2).
IL-1β, IL-6, TNF-α, and inflammatory chemokines and growth factors have been observed in survivors of EBOV infection and in the plasma of asymptomatic, exposed individuals (1,17). A recent study examining samples from 56 patients from five different outbreaks has significantly expanded upon the understanding of the cytokine and chemokine profile of EBOV-infected patients (27). This study found that early in infection, patients who succumbed to infection had significantly higher levels of several inflammatory cytokines and chemokines, including IL-6, IL-8, MCP-1, and IP-10, compared to patients who survived infection (27). In lethal infection, patients were characterized by a “cytokine storm” in the days prior to death, whereas survivors had a more balanced immune response.
Despite the growing body of literature concerning filovirus infection in humans, approval of any EBOV therapeutic or vaccine will likely be conducted via efficacy studies in an animal model. Both cynomolgus and rhesus macaques have been utilized extensively for filovirus challenge, and they serve as reasonable surrogates for human infection (23,26). Previous work evaluating filovirus infection of nonhuman primates (NHP) has identified key pathological findings associated with infection. These findings include fibrin and fibrinocellular thrombi and lymphocyte apoptosis, particularly in the lymphoid tissues (7,9,10,13). Changes in coagulation and temperature are additional hallmarks of filovirus disease (22). One study examined EBOV pathogenesis in cynomolgus macaques over 6 days of infection (11). Lymphocyte apoptosis was shown to occur early in infection in cynomolgus macaques, and it included apoptosis of natural killer (NK) cells (11,21). Later stages of infection were characterized by elevations in liver enzymes, inflammatory cytokines and chemokines, serum creatinine (CREAT), and urea nitrogen (8,11). In addition, more recent studies have examined aerosol infection with EBOV, with the aim of modeling a potential deliberate or inadvertent aerosol exposure in man (22,24).
In this study, the pathological and immunological responses of rhesus macaques exposed to EBOV via the intramuscular route are described. The data included in this report were collected from control animals, which are being retrospectively analyzed for the purposes of understanding the rhesus macaque model of EBOV infection. The data were collected from three separate challenge studies with six animals in each study, resulting in a statistically robust data set. Within these three studies, one animal survived challenge. The survivor was demonstrably infected with EBOV but resolved the infection, and some differences in the immune response and pathogenesis of infection in this animal are highlighted in comparison to the animals that succumbed to infection.
Methods
Animal use and viral challenge
A total of 18 rhesus macaques (male and female, weight 3.7–5.6 kg) consisting of three groups of six were inoculated with a target titer of 1,000 pfu of EBOV (H.sapiens-tc/COD/1995/Kikwit-9510621 (15), demonstrated to be primarily the 8U variant at the mRNA editing site) in 0.5 mL by intramuscular injection in the left or right quadricep. Back titer calculations of challenge material was assessed by plaque assay using reference material from the day of each of the three studies with values of 1,786 pfu, 210 pfu, and 1,971 pfu, respectively. It should be noted that in the study with the surviving NHP, the reference material was 1,786 pfu. The animals described in this manuscript were control animals in larger therapeutic studies, and they are being retrospectively analyzed to expand the understanding of the rhesus macaque model of infection. In most animals, blood collection occurred on days 0, 3, 5, 8, and 10, with additional collection from the surviving NHP on days 14, 21, 28, and 41. All studies were conducted in Animal Biosafety Level 4 containment. Beginning on day 0 and continuing for the duration of the in-life phase, clinical observations were recorded, and animals were closely monitored for disease progression. Moribund animals were euthanized based on institutional-approved clinical scoring.
Clinical observation and scoring
Animals were euthanized based on prespecified criteria that relied on a sequential assessment of objective and subjective parameters, which included behavioral responses, body temperature, and serum chemistry parameters. At each health-evaluation event, animals were initially assigned a clinical responsiveness score of 0–5, with 0 corresponding to an animal judged to be active, alert, and overtly healthy, and 5 corresponding to an animal in moribund state, unresponsive to approach by study personnel. Animals assigned a clinical responsiveness score of 0–2 were not considered further for euthanasia at the time of that observation. Animals assigned a clinical responsiveness score of 4 or 5 were immediately euthanized. Animals assigned a clinical score of 3 were sedated and a rectal temperature was immediately recorded. If a body temperature ≤95.0°F was recorded, the animal was considered to hypothermic and was euthanized. If body temperature was >95.0°F, a blood sample was collected. The sample was immediately processed to obtain serum, and the serum was then subjected to serum chemistry analysis using Vitros 350 instrumentation. If any two of the following conditions were met, the animals were euthanized: ≥68 mg/dL blood urea nitrogen (BUN), ≥2.8 mg/dL CREAT, ≤6.8 mg/dL Ca2+, or ≥391 IU/dL gamma-glutamyl transferase. If at least two of these conditions were not met, the animal was returned to its cage.
Research was conducted under an IACUC approved protocol in compliance with the Animal Welfare Act, PHS Policy, and other Federal statutes and regulations relating to animals and experiments involving animals. The facility where this research was conducted is accredited by the Association for Assessment and Accreditation of Laboratory Animal Care International and adheres to principles stated in the Guide for the Care and Use of Laboratory Animals, National Research Council, 2011.
Coagulation
Blood was drawn via peripheral venipuncture using 3.2% sodium citrate vacuum tubes. Samples obtained for scheduled coagulation analysis were processed and analyzed within 6 h of sample collection. However, some samples obtained from animals at the time of euthanasia were stored frozen (–60°C to −80°C) until analysis could be performed. Coagulation analysis was conducted using a Sysmex CA-1500 for the following parameters: prothrombin time (PT), activated partial thromboplastin time (APTT), thrombin time (TT), fibrinogen concentration (Fib), antithrombin (AT), and D-dimer concentration (DD).
Hematology
Blood was drawn via peripheral venipuncture using EDTA tubes at the indicated time points. Hematology samples were processed and analyzed within 6 h of sample collection; some samples obtained at the time of euthanasia were refrigerated at 4°C until analysis could be performed. Hematology analysis was conducted using an Advia 120 Hematology Analyzer (Siemens) with multispecies software. The hematology parameters analyzed included red blood cell (RBC) count, hemoglobin (HGB), percentage hematocrit (HCT), mean corpuscular volume (MCV), mean corpuscular hemoglobin (MCH), mean cell hemoglobin concentration (MCHC), red cell distribution width (RDW), platelet (PLT) count, mean platelet volume (MPV), and reticulocyte count (RETIC). Erythrocytes included white blood cell (WBC) count and absolute counts for neutrophils, lymphocytes, monocytes, eosinophils, and basophils.
Chemistry
Blood was drawn via peripheral venipuncture using serum separator tubes and processed to serum. Serum chemistry analysis was conducted using a Vitros® 350 Chemistry System (Ortho Clinical Diagnostics). Samples obtained for scheduled chemistry analysis were processed and analyzed within 6 h of sample collection when possible; some samples obtained at the time of euthanasia were refrigerated at 4°C until analysis could be performed. Parameters analyzed included sodium (Na), potassium (K), chloride (Cl), alanine aminotransferase (ALT), aspartate aminotransferase (AST), alkaline phosphatase (ALP), lactate dehydrogenase (LDH), gamma glutamyl transferase (GGT), direct and indirect bilirubin, amylase (AMY), lipase (LIP), calcium (Ca), phosphorus (PHOS), urea nitrogen (BUN), CREAT, total protein, albumin (ALB), globulin, glucose (GLU), cholesterol (CHOL), triglycerides (TRIG), and C-reactive protein (CRP).
Viral RNA
Viral burden was measured on sera collected prior to challenge (day 0) and at indicated time points post-infection. Additionally, terminal samples were collected from animals that were moribund euthanized. Quantitative real-time polymerase chain reaction (qRT-PCR) was used to evaluate viral RNA copy number.
Histopathology
All collected tissues were immersion-fixed in 10% neutral buffered formalin for at least 21 days. The tissues were trimmed and processed according to standard protocol. Histology sections of tissues were cut at 5–6 μm on a rotary microtome, mounted on glass slides, and stained with hematoxylin and eosin.
Cytokine/chemokine analysis
Blood was drawn via peripheral venipuncture using serum separator tubes, processed to serum, and stored frozen (–60°C to −80°C) until analysis. Serum obtained from blood drawn via peripheral venipuncture was analyzed to determine circulating cytokine/chemokine concentrations using a MesoScale Discovery SI6000 platform. Assays included the Human Chemokine 9-plex assay Ultra-sensitive kit, Human Pro-inflammatory-9 plex assay Ultra-sensitive kit, and Human Cytokine Assay Ultra-sensitive kit. Samples were processed for analysis in accordance with manufacturer's recommendations. The lower limit of detection (LLOD) and upper limits of detection (ULOD) were determined based on the standard curve. For computational purposes, samples at the LLOD were defined as one-half the LLOD; samples at the ULOD were defined as the ULOD. Cytokines and chemokines were analyzed using human-specific reagents and included analysis of IFN-α2A, IFN-γ, GM-CSF, IL-10, IL-12, IL-1β, IL-2, IL-6, IL-8, TNF-α, IP-10, Eotaxin, Eotaxin-3, MCP-1, MCP-4, MIP-1β, MDC, and TARC. LLOD and ULOD are as follows (pg/mL), for the respective analytes: 2.44/2,500; 9.77/10,000; 2.44/10,000; 9.77/10,000; 9.77/10,000; 2.44/10,000; 2.44/10,000; 2.44/10,000; 2.44/10,000; 2.44/10,000; 156.25/40,000; 156.25/160,000; 156.25/40,000; 39.06/40,000; 39.06/40,000; 156.25/160,000; 390.64/400,000; and 156.25/160,000.
For comparison of average day 5 analyte levels between animals that succumbed on different days post-infection, animals that succumbed or were euthanized are grouped together. When interpreting these data, it should be considered that animals that were euthanized may not have succumbed naturally until the following day.
Flow cytometry
Peripheral blood mononuclear cells (PBMCs) were isolated at the indicated time points via peripheral venipuncture using EDTA tubes followed by ficoll gradient purification. PBMCs were then incubated with Fc Block (BD) and stained for viability using Live/Dead Aqua (Invitrogen). Finally, samples were stained for lymphocyte markers CD20 (clone L27), CD3 (clone SP34-2), CD4 (clone L200) and CD8 (clone RPA-T8) (BD). A total of 700,000 events were collected on a BD Gallios, and data were analyzed using FlowJo.
Results and Discussion
Survival
Eighteen rhesus macaques were challenged intramuscularly with EBOV. Seventeen of the animals succumbed to infection or were euthanized based on clinical scoring between days 6 and 12 after challenge (Fig. 1A). In total, 13 animals were euthanized, and four succumbed naturally. One animal survived challenge, and that animal mounted both IgM and IgG antibody responses against glycoprotein, which were first detected on days 14 and 10 respectively (Supplementary Fig. S1; Supplementary Data are available online at
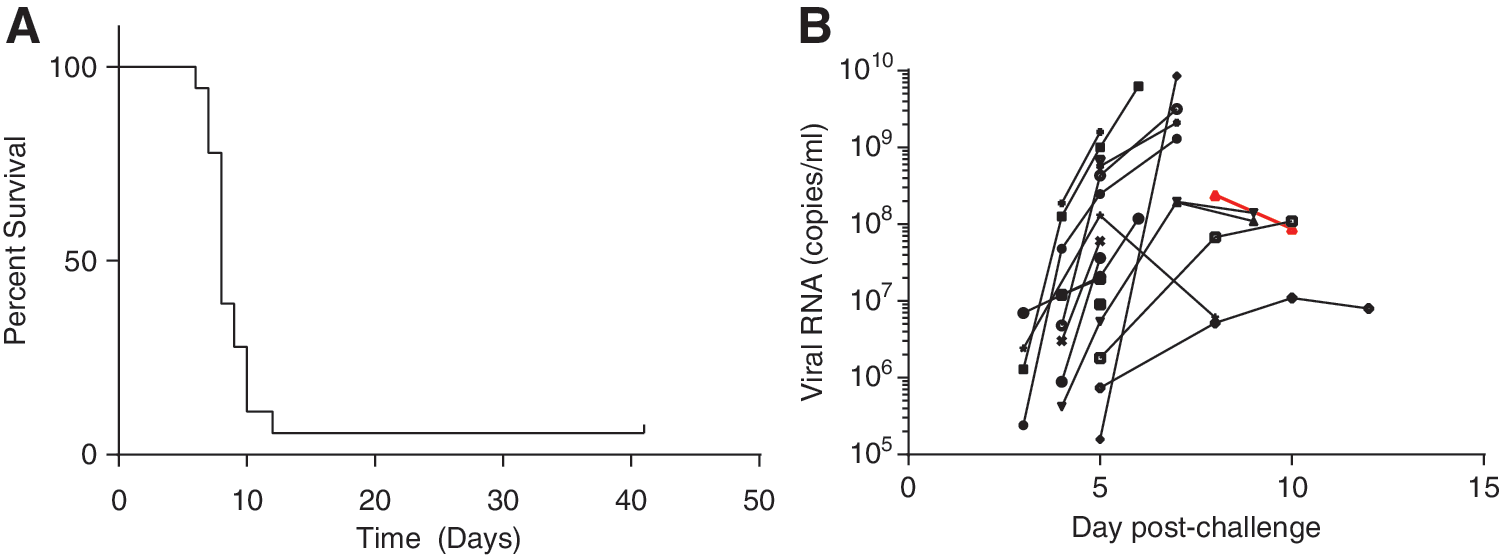
Survival and viral RNA levels of Ebola virus (EBOV)-challenged rhesus macaques. Seventeen of 18 EBOV-infected rhesus macaques succumbed to infection between days 6 and 12 after challenge
Coagulation
Coagulation was evaluated using the Prothrombin Time (PT) test, which measures the extrinsic and common pathways of coagulation, and the Activated Partial Thromboplastin Time (APTT) test, which measures the intrinsic and common pathways of coagulation. All animals experienced an increase in both PT and APTT, with values for both peaking between days 6 and 10 post-infection (Fig. 2A and B). In general, the slowest coagulation time by both tests was detected on the final sample day before the animal succumbed to infection. Two animals, however, were exceptions to this finding. The animal that survived challenge had the slowest coagulation at days 8 and 10 by the PT and APTT tests respectively. A second animal, which succumbed to infection on day 12, presented with a slight decrease in coagulation times between days 8 and 12 or 10 and 12 by PT and APTT respectively. Histologically, coagulation disorders can be detected by the presence of fibrin thrombi, fibrin within vessels, or fibrin in extravascular locations in tissues. This presentation is typical for macaques with filoviral disease and was observed in this study. It is attributed to disseminated intravascular coagulation (DIC) and a loss of platelets and clotting factors (Fig. 2E and F).
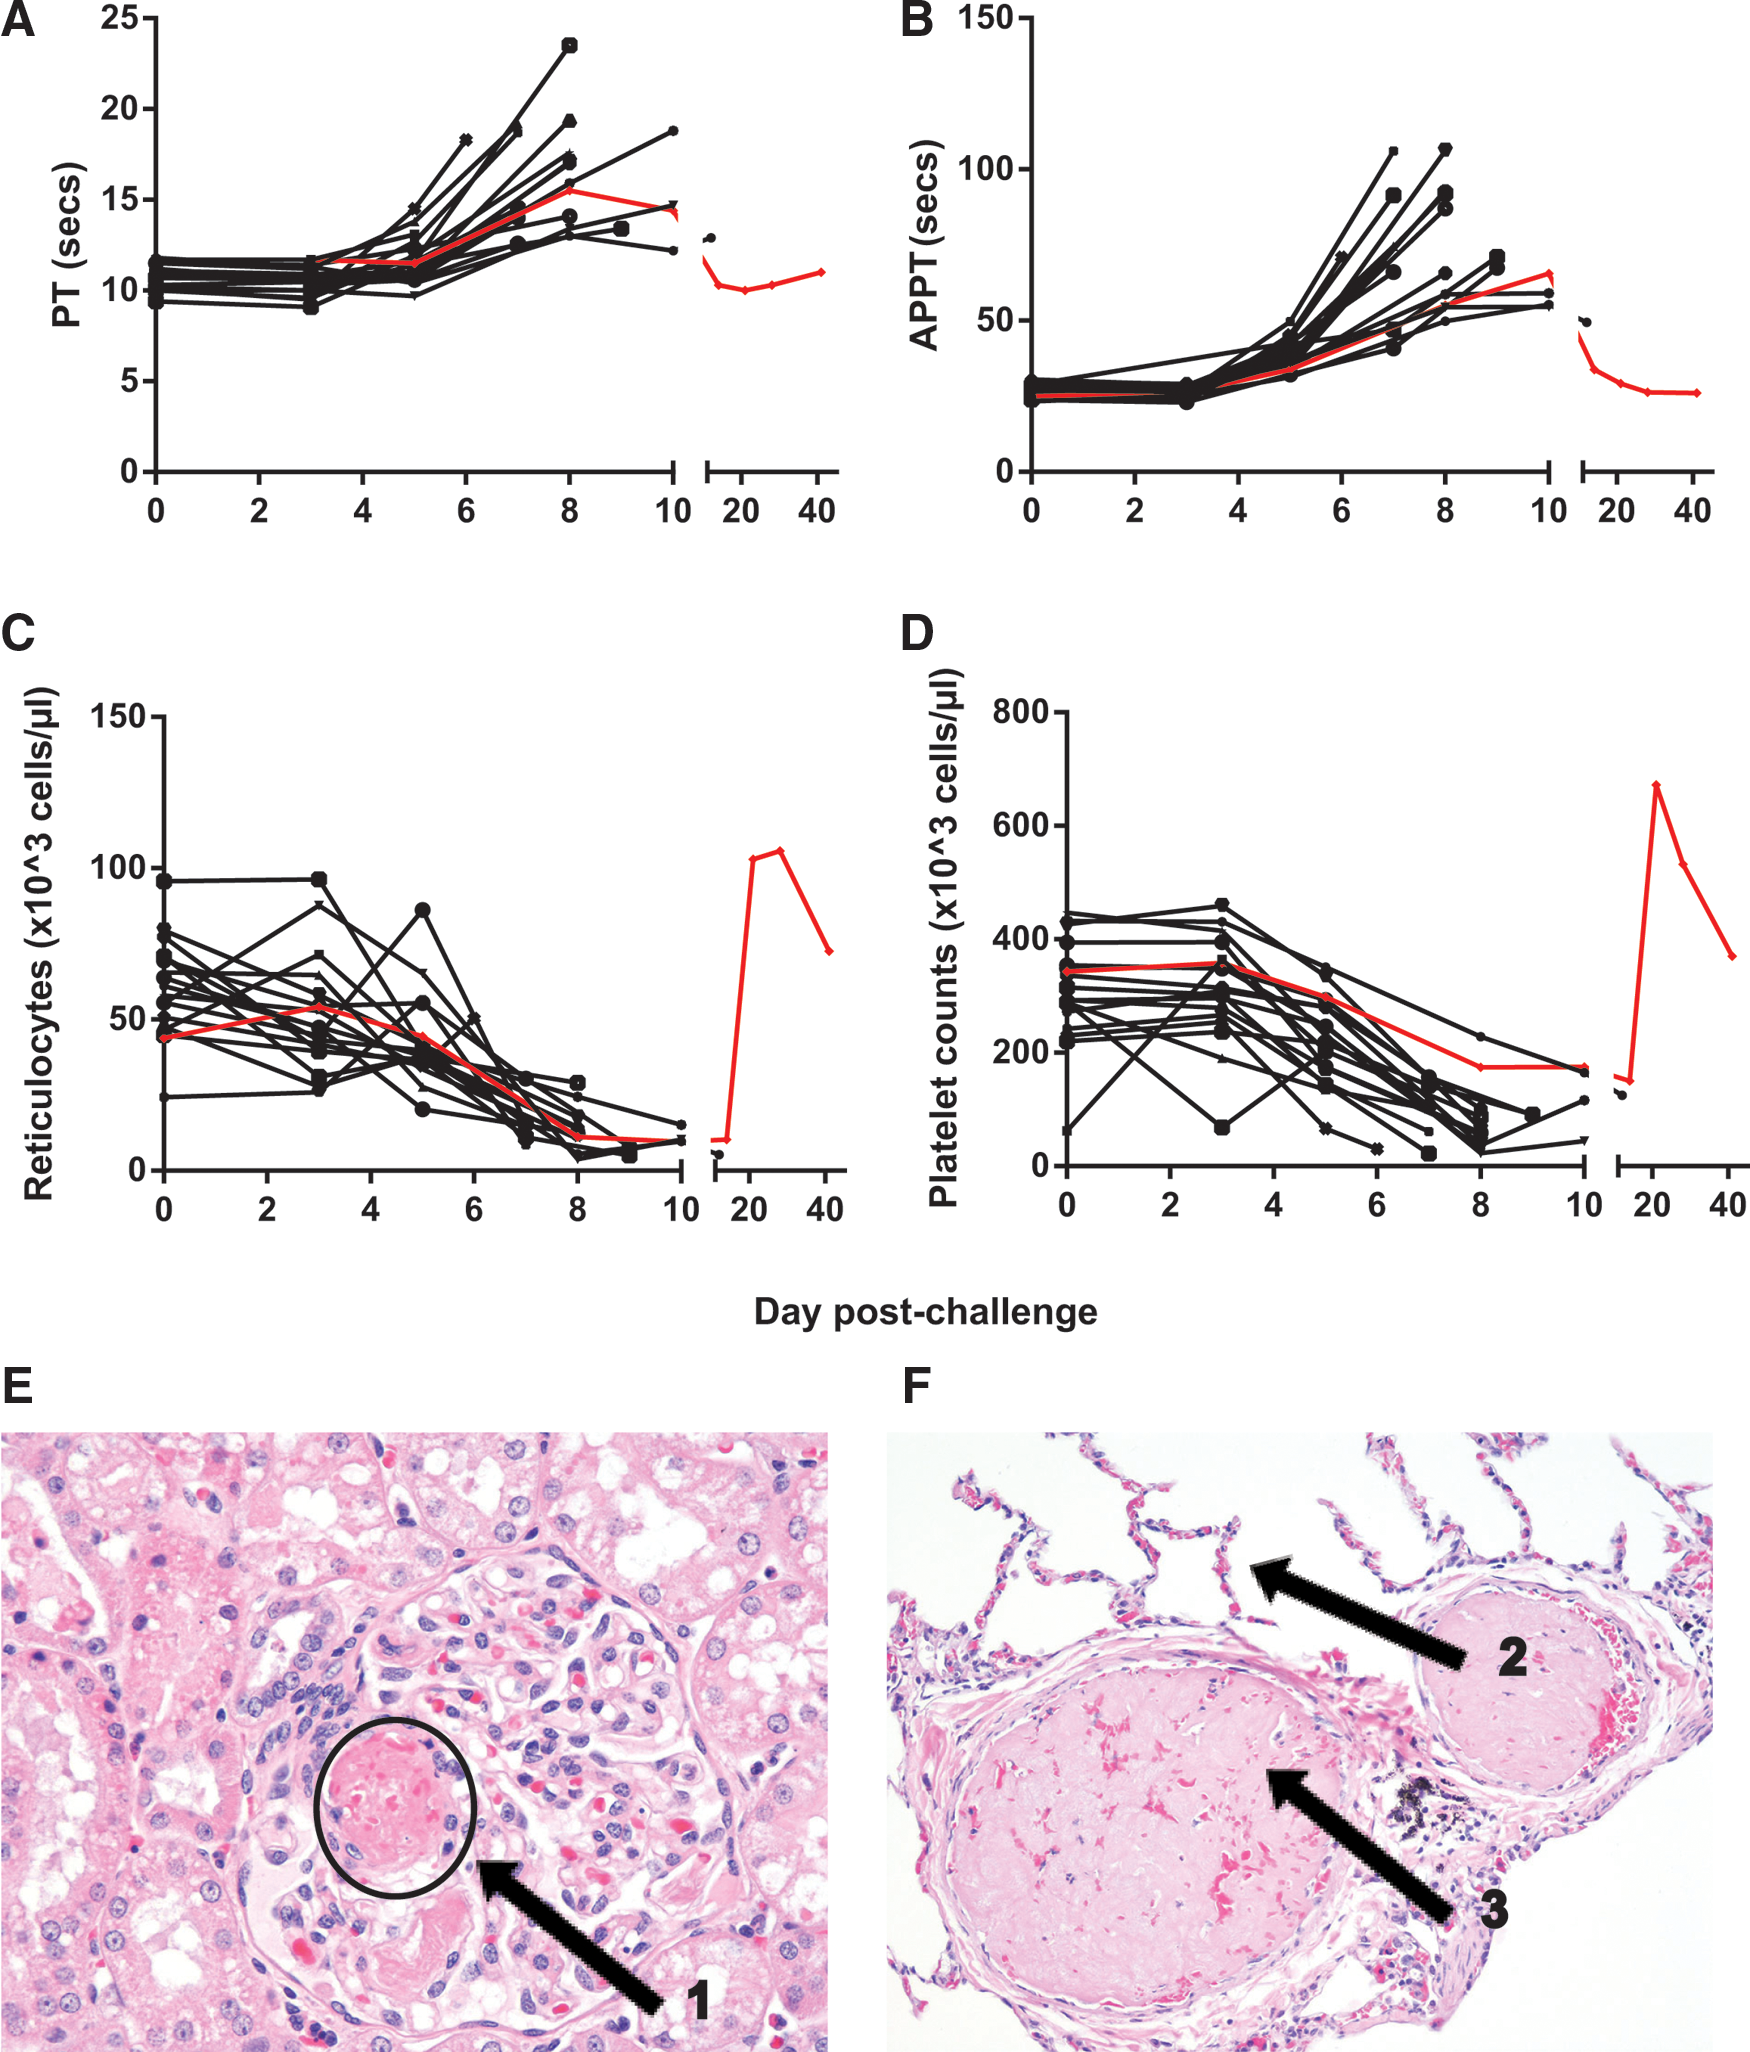
EBOV-infected animals exhibit coagulation abnormalities and changes in platelets and reticulocytes. Blood was collected from EBOV-infected rhesus macaques at various time points after challenge. Changes in coagulation were evaluated using the Prothrombin Time (PT) test
Hematology
Changes in platelet counts and reticulocytes are typical of filoviral disease, and are generally concurrent with bleeding disorder. Animals presented with a decrease in platelets and reticulocytes during peak infection (Fig. 2C and D). Both of these cell counts rebounded in the animal that survived challenge, with values 1.5- to twofold higher than baseline on days 21 and 28 post-challenge.
In general, changes in WBC and RBC counts as well as hematocrit were unremarkable, with some animals experiencing an increase in WBC counts during early and peak infection (data not shown). Data from previous reports have been conflicting on the changes in WBC during infection, with studies finding both increases and decreases after challenge (11,24).
Chemistries
Changes in AST levels and ALT levels were observed as early as day 3 or 5 in some animals (Fig. 3A and B). ALT and AST levels peaked on the day prior to death in most animals. One animal, which succumbed on day 12, experienced a slight decrease in both ALT and AST on day 12 compared to day 10 post-infection. A second animal also experienced a decrease in AST between days 5 and 8, when it succumbed to infection. ALT and AST levels for the animal that survived challenge peaked on days 8 and 10 respectively.
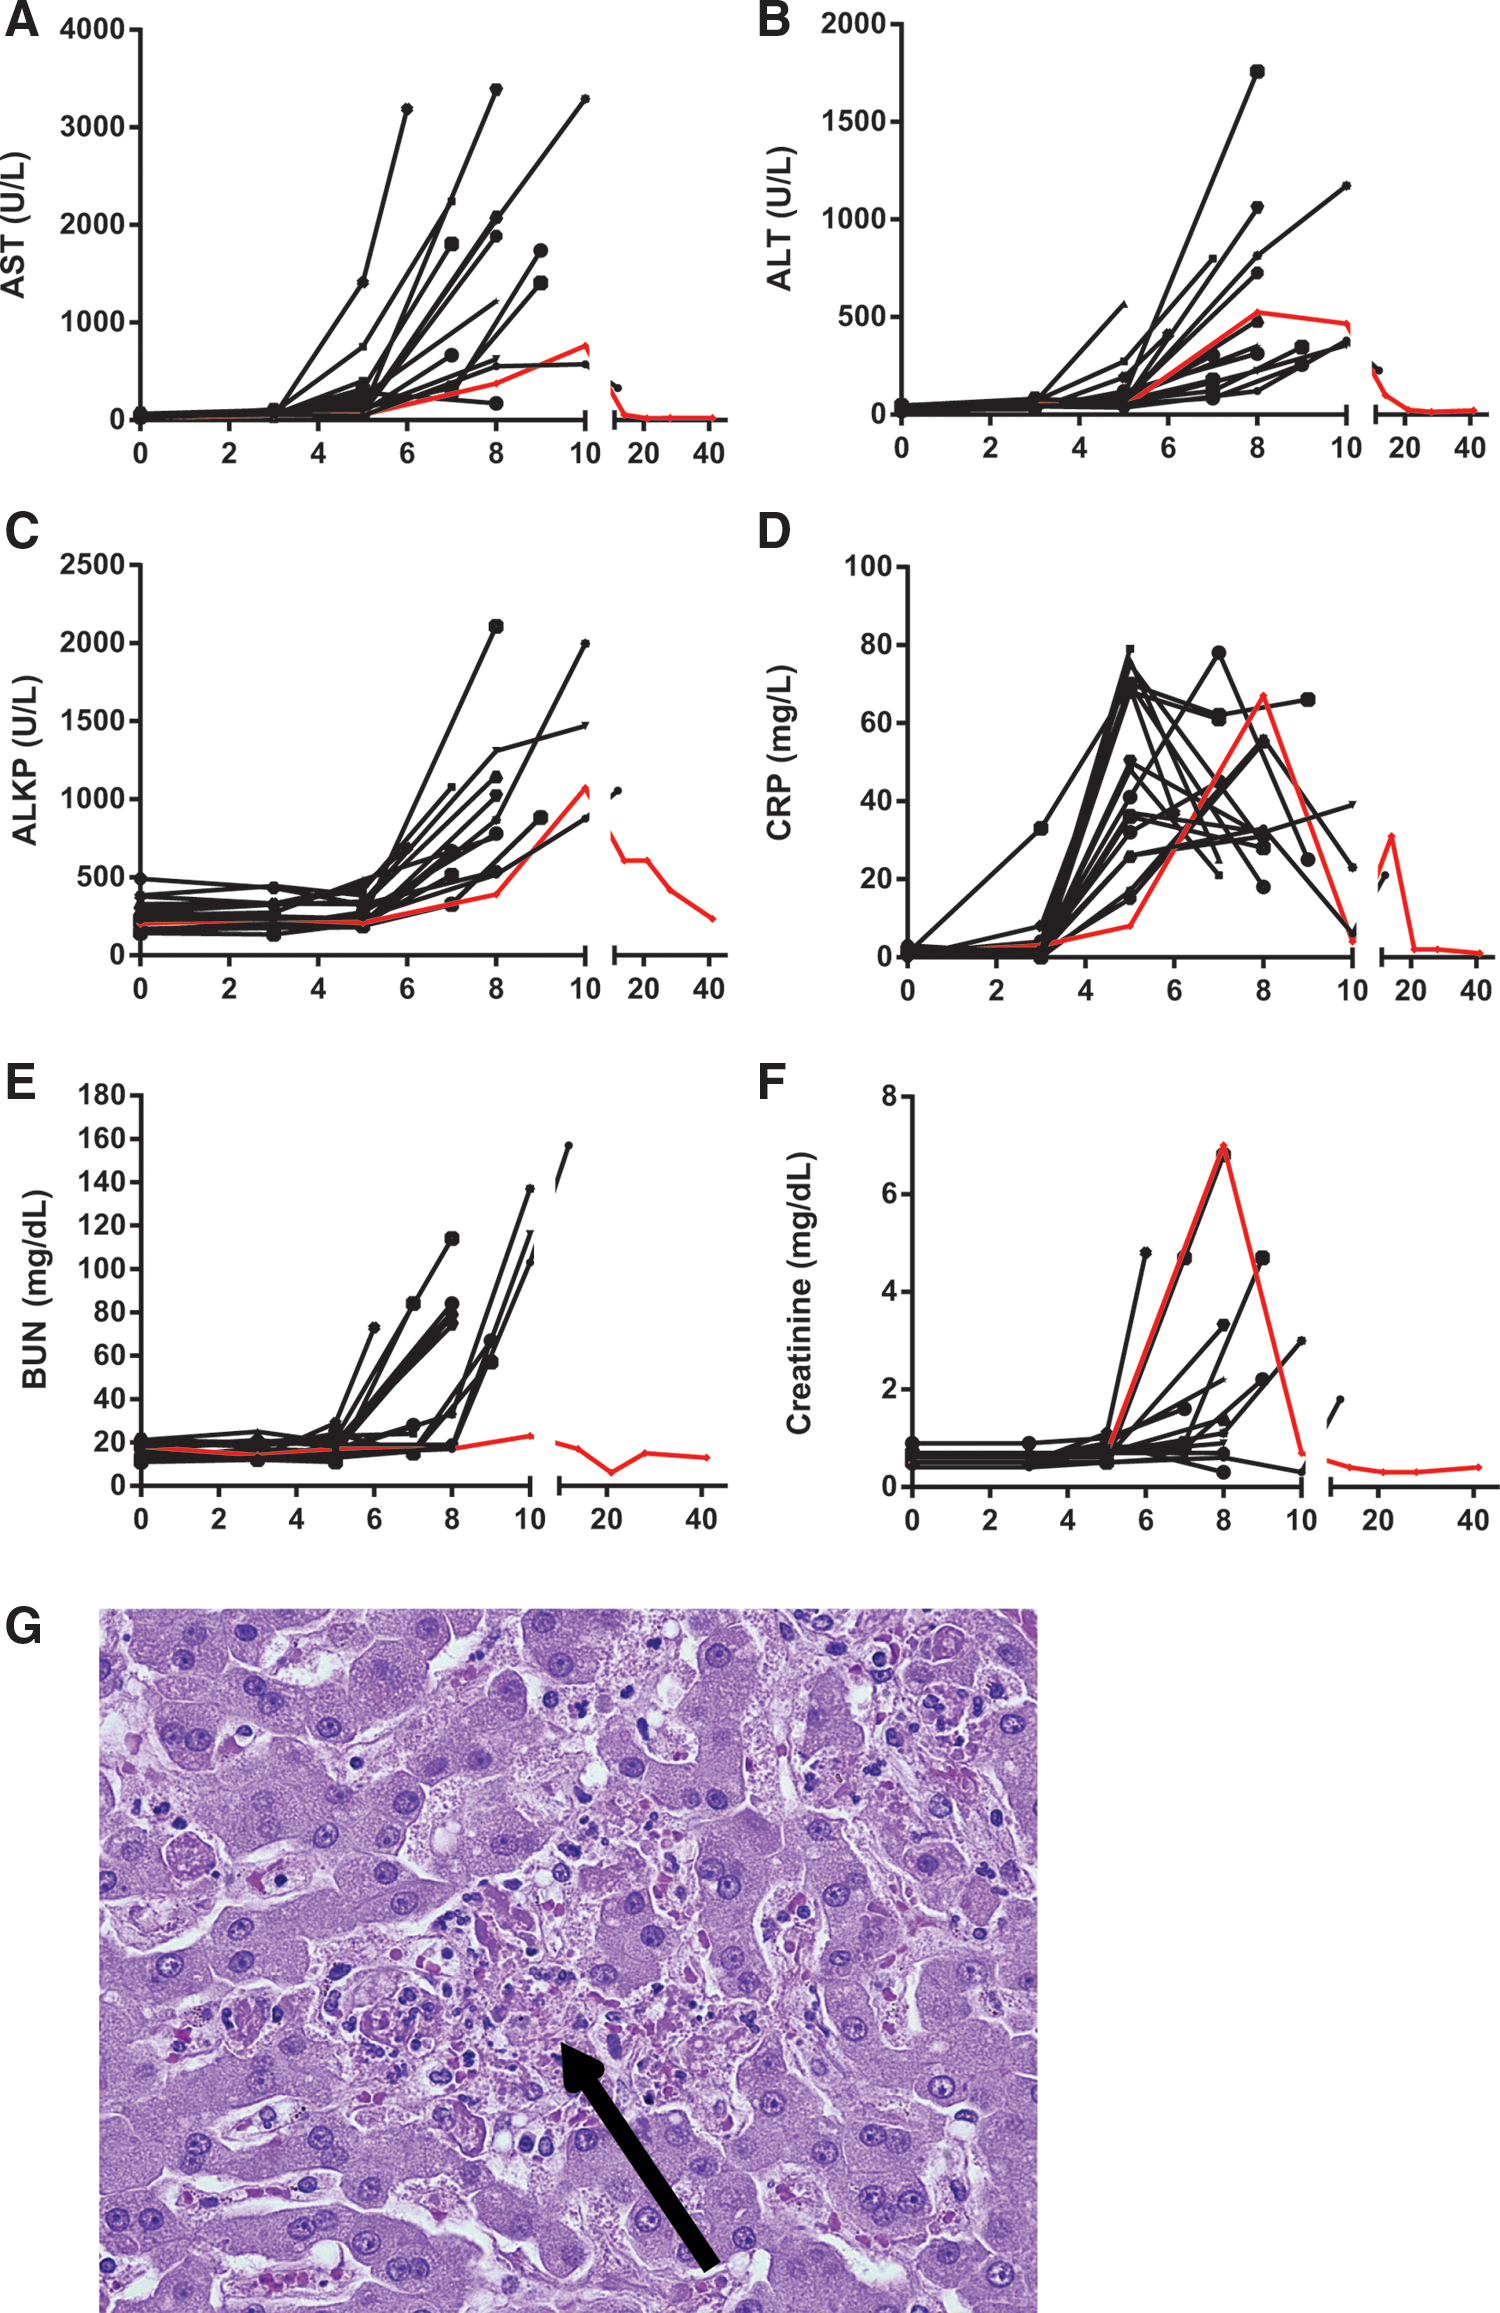
EBOV-infected animals exhibit symptoms of liver and renal damage. Blood was collected from EBOV-infected rhesus macaques at various time points after challenge. Changes in aspartate aminotransferase (AST) levels
Other indicators of liver damage were evaluated, including alkaline phosphatase (ALKP), cholesterol, and triglycerides. ALKP levels peaked on the final blood collection day of animals that succumbed to infection (Fig. 3C). The animal that survived challenge experienced peak ALKP on day 10, and levels were comparable to those of the animals that succumbed to infection. Changes in cholesterol were negligible (less than twofold), but triglyceride levels increased by at least fivefold in 12 of the 18 animals, generally peaking on the final bleed date (data not shown). The animal that survived challenge experienced a 3.7-fold increase in triglycerides over baseline on day 10, which returned to baseline by day 14 (data not shown). Characteristic histologic findings consistent with filoviral disease within the liver were present in all macaques that succumbed in this study, and these findings coincide with clinical chemistry perturbations. Hepatic changes included hepatocellular degeneration and necrosis with fibrin deposition with cellular necrotic/apoptotic-like debris (Fig. 3G).
As a measure of inflammation, CRP levels were assessed (Fig. 3D). Peak levels of CRP were observed between days 5 and 8 in most animals and, unlike AST, ALT, or ALKP levels, tended to decline on the final day or days of sampling. The animal that survived challenge experienced peak CRP levels on day 8, and levels were comparable to animals that did not survive challenge.
Twelve of the 17 animals that succumbed to infection experienced at least a twofold increase in BUN on the final sample day, and 10 of the 17 animals experienced at least a twofold increase in serum CREAT at this time as well (Fig. 3E and F). These changes are suggestive of kidney dysfunction toward the peak of infection. On day 8 of the study, the animal that survived challenge had the highest CREAT levels of any sample in the study. Interestingly, this animal did not experience a change in BUN. Histologically, early signs of renal tubular degeneration and necrosis from vascular compromise are a common finding in filoviral-challenged macaques and were observed here (Fig. 2E).
Cytokine and chemokine profile
Animals exhibited characteristic inflammatory cytokine, chemokine, and growth factor profiles prior to succumbing to infection. In keeping with what has been observed in human infection (27), levels of Eotaxin, IP-10, MCP-1, and IL-6 were particularly elevated (Fig. 4). One animal experienced high levels of Eotaxin from the start of the study, which essentially remained constant.

Eotaxin, IL-6, IP-10, and MCP-1 increased during EBOV infection. Serum was collected at various time points after challenge and evaluated for a panel of cytokines, chemokines, and growth factors. Eotaxin
The animal that survived challenge, as indicated by the red data points, also presented with an inflammatory cytokine, chemokine, and growth factor response. However, the inflammatory response resolved by day 21, with levels of all analytes returning to baseline (Fig. 5A). Figure 5 displays the average analyte levels for the animals that did not survive challenge (Fig. 5C) and the levels for the surviving animal (Fig. 5B). The surviving animal had a delayed and transient amplification of the inflammatory response, with most markers not increasing until day 8 post-infection. In contrast, the other animals generally presented with elevated cytokine and chemokine levels in the serum by day 5.
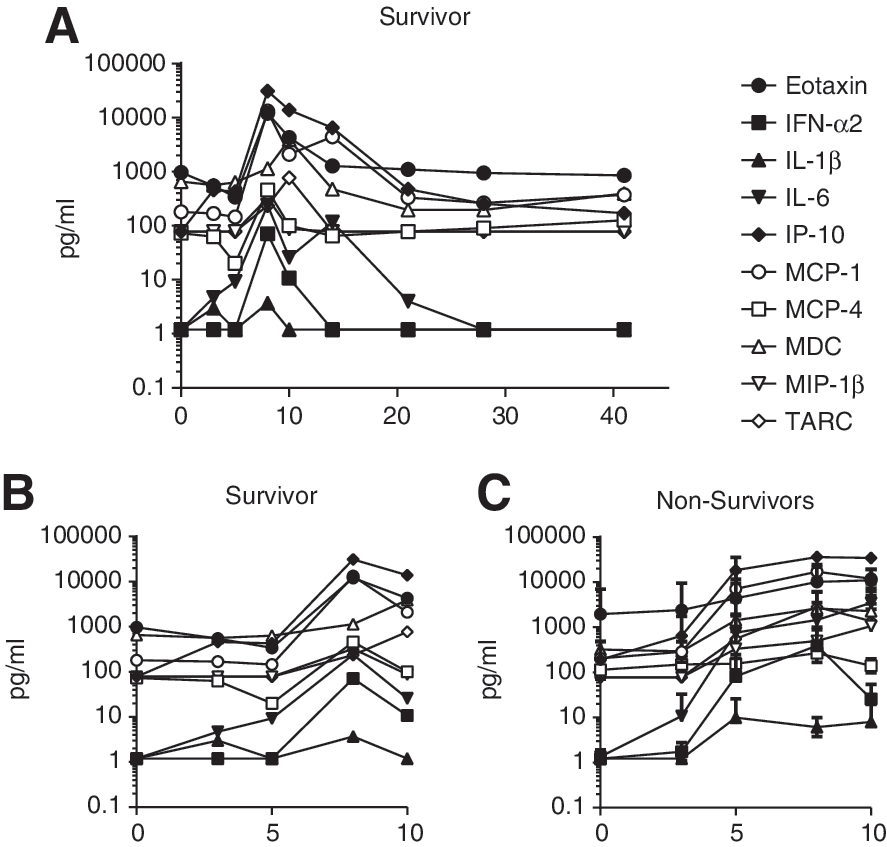
EBOV-challenge survivor presented with delayed induction of inflammatory cytokines and chemokines. Serum was collected at various time points after challenge and evaluated for a panel of cytokines, chemokines, and growth factors. Analytes that were detectable in the animal that survived infection are shown
Viral RNA was not detected in the animal that survived challenge until day 8 post-infection, and this coincided with the elevation in serum cytokine and chemokine levels. It seems unlikely, therefore, that an early systemic inflammatory response was responsible for suppressing viremia, resulting in the animal's survival. More likely, the substantial inflammatory cytokine and chemokine production in the animals that succumbed to infection contributed to their demise (19). While a systemic inflammatory response did not correlate with survival in this animal, the evaluation of circulating cytokine and chemokine levels may not fully convey the localized immune activation after infection. Localized innate immune activation in the lymphoid tissues of the survivor may have contributed to control of viremia and subsequent survival.
Considering the significant elevation in serum cytokine levels of animals that succumbed to infection, the average analyte levels on day 5 post-challenge was compared for animals that succumbed on days 6, 7, 8, 9, 10, and 12. As shown in Figure 6, higher inflammatory markers on day 5 appear to correlate with earlier demise. Of note, animals that succumbed to infection on a given day are grouped with animals that were euthanized. It is possible that euthanized animals would have succumbed naturally on the following day, and the data should be considered with this caveat.

Levels of inflammatory analytes on day 5 after infection in relation to time to death. Serum cytokine, chemokine, and growth factor levels were averaged for animals that succumbed to infection on the same day. Average analyte levels for animals that succumbed on days 6, 7, 8, 9, 10, and 12 are shown. Values below the LLOD were defined as half the LLOD; values exceeding the ULOD were defined as the ULOD. Average and standard deviation are shown; the number of animals that succumbed to infection on each day is indicated by “n.”
The relationship between inflammatory cytokine and chemokine responses and time to death is in keeping with the data observed in human infection, thereby supporting the relevance of the rhesus macaque model for EBOV infection (27). Induction of IP-10, MCP-1, IL-6, IL-1β, and other inflammatory cytokines and growth factors was observed in human patients that succumbed to infection (27). Exceptions to this are IL-10 and IFN-γ, which have also been associated with a fatal outcome in human EBOV infection; IL-10 may play a role in pathogenesis in mice as well (1,20,25). IL-10 was evaluated in this assay but was only detectable in four animals. In three of the animals, levels were <20 pg/mL, and IL-10 was only detected on the final sample point before death. In one animal, IL-10 was detected on the final two sample points, and reached 285 pg/mL. Eight of the animals in this study had elevated IFN-γ levels on the last day of sampling before the animal succumbed. Thus, while IL-10 and IFN-γ were detected in animals that succumbed to infection, they were not clear predictors of fatality in this model. Neither IL-10 nor IFN-γ were detected in the serum of the animal that survived challenge, on the days tested.
Peripheral lymphocyte analysis
Lymphopenia has been previously described during the course of EBOV infection, though the mechanisms that result in the loss of the lymphocyte compartment are not fully understood (6,11). Several lines of evidence in both murine and NHP studies support involvement of the Fas/FasL and Trail induced apoptotic pathways (27). To measure lymphopenia of peripheral immune subsets following EBOV challenge, the relative frequencies of circulating CD20+ B-cells and CD3+ T-cell subsets were determined during the in-life phase of infection using flow cytometry. In most animals, an approximate two- to threefold decrease of CD3+ T-cells was observed, which began between days 3 and 5, reaching a nadir by day 8 (Fig. 7B). Within the CD3 T-cell population, CD3+ CD8+ T-cells were preferentially lost compared to CD3+CD4+T-cells (Fig. 7D and E). Interestingly, animals that survived past day 8 began to re-establish the T-cell compartment, and in some instances reached pre-infection T-cell frequencies despite having high levels of both viremia and systemic cytokines/chemokines.
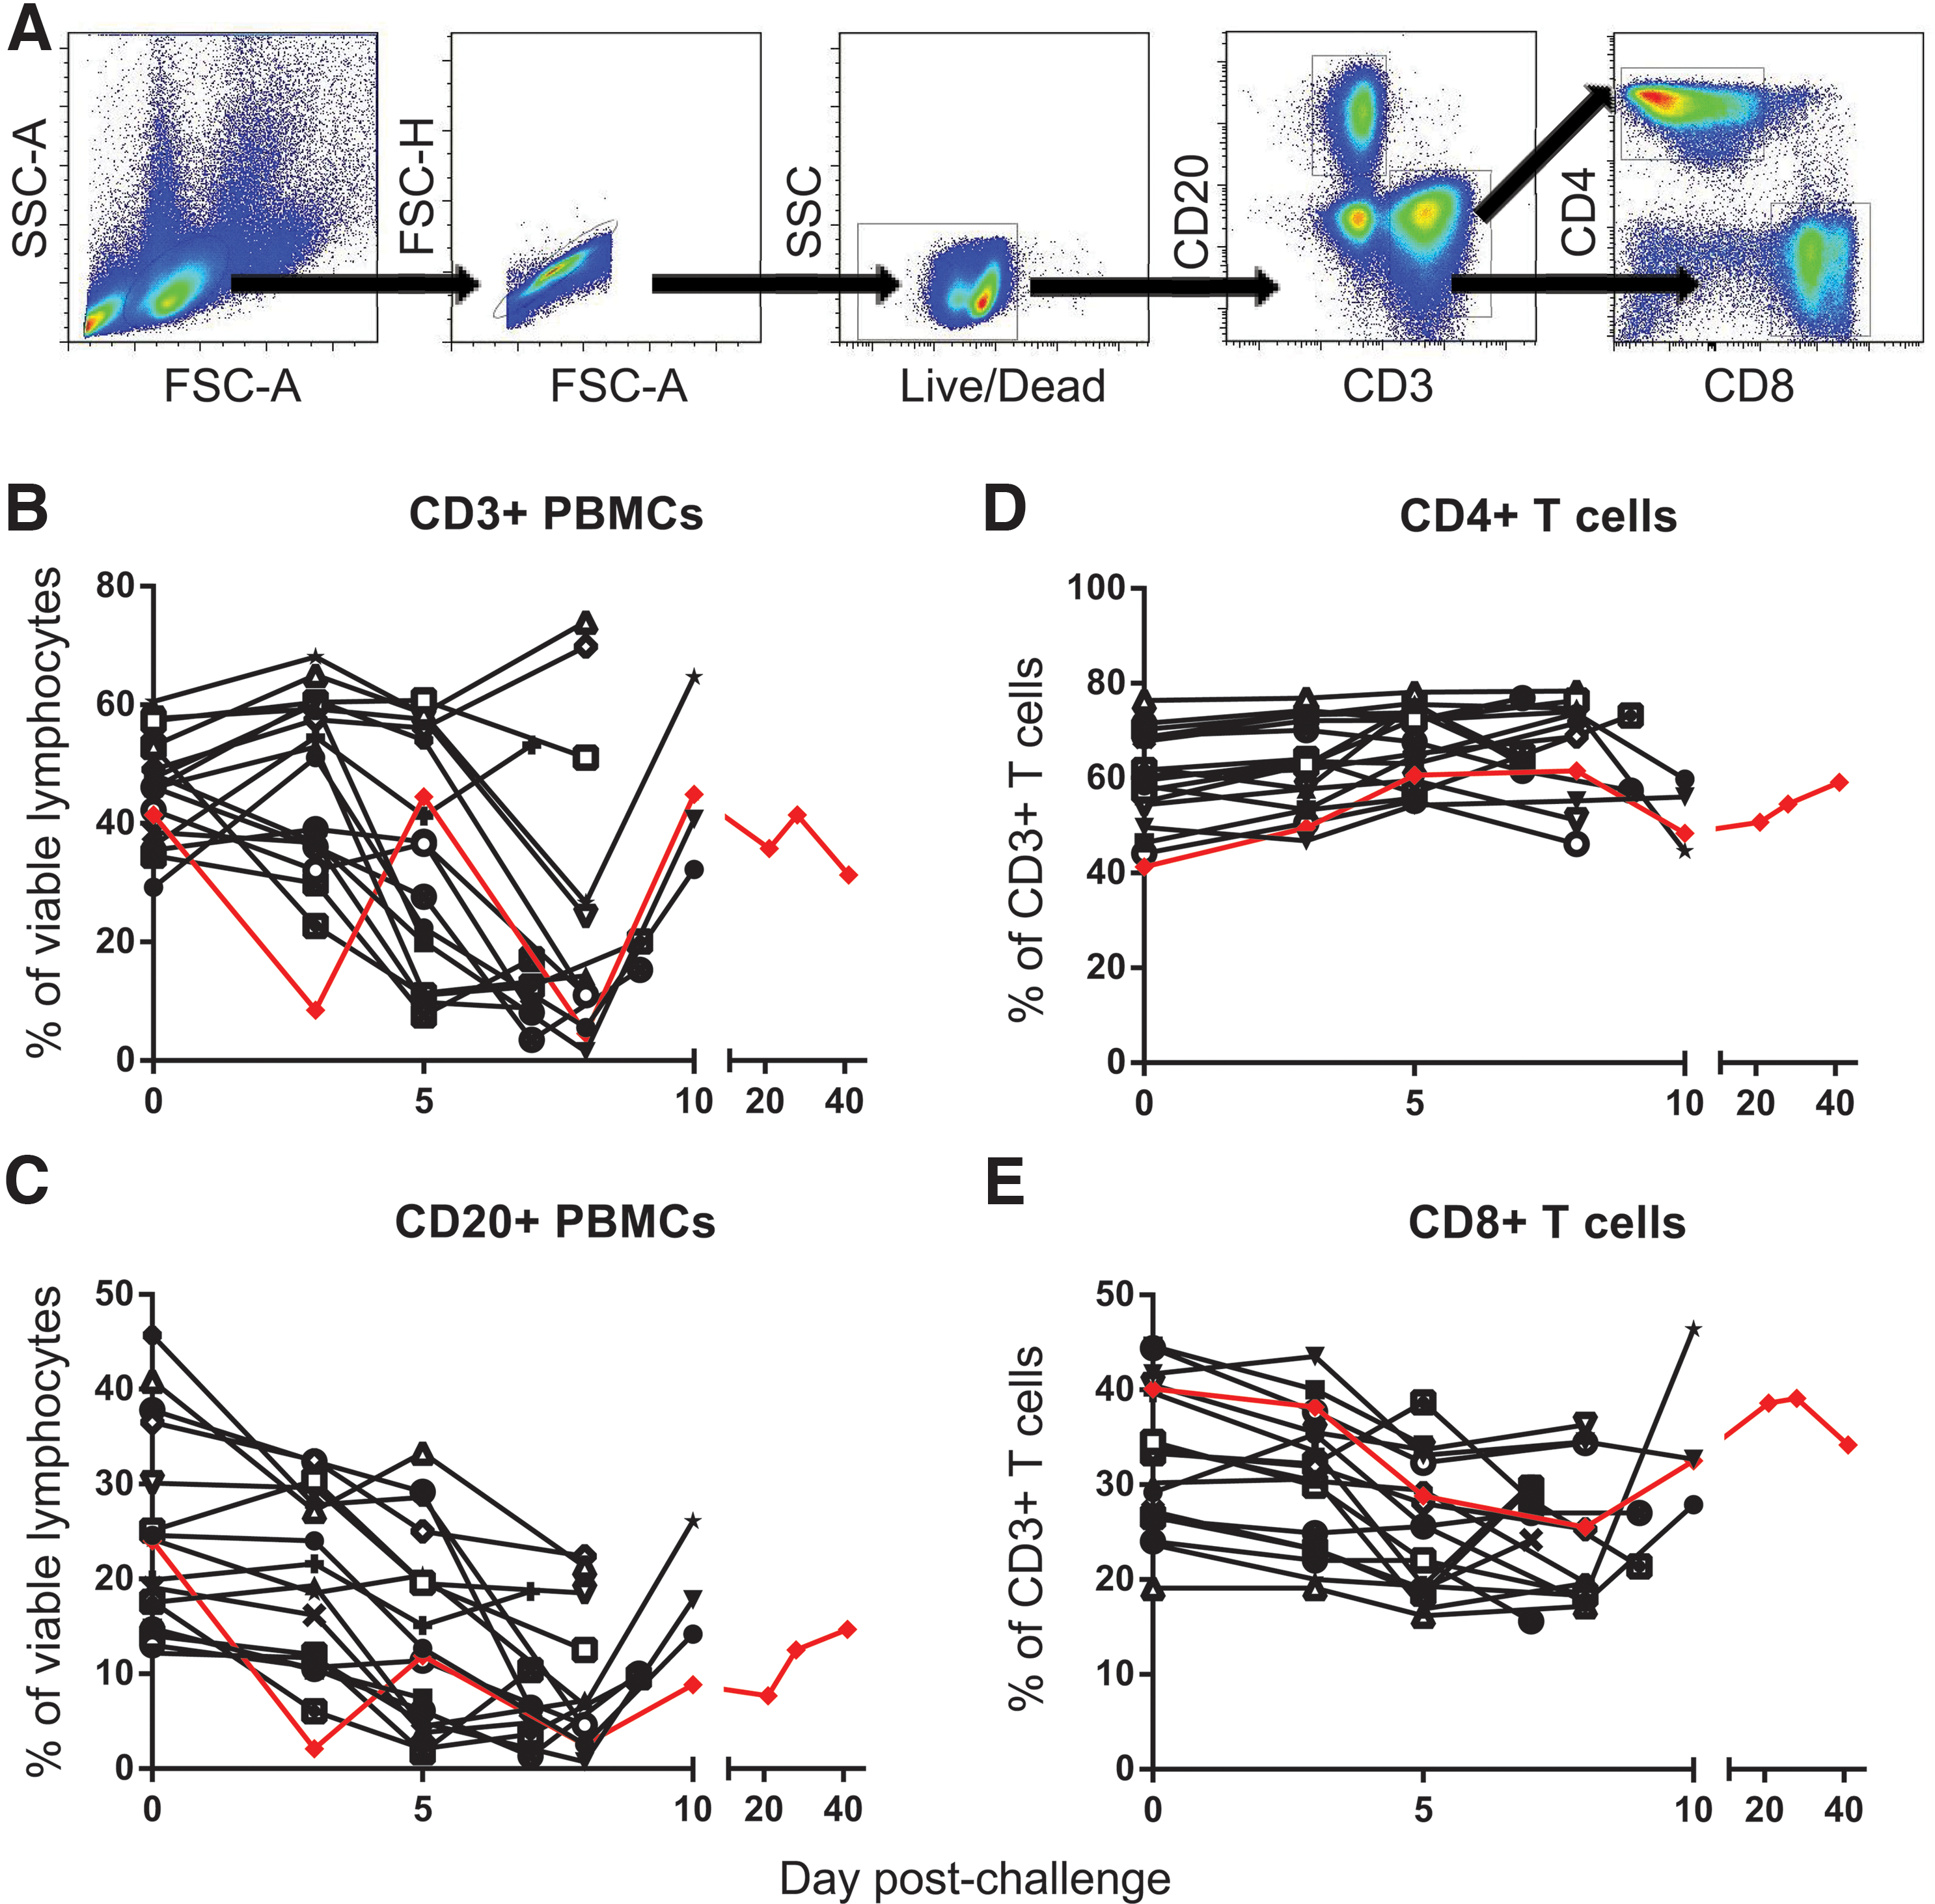
Evaluation of lymphocyte populations during EBOV infection. Peripheral blood mononuclear cells were collected from EBOV-infected animals at various time points post-infection. B-cell (CD20) and T-cell (CD3, CD4, CD8) markers were used to track changes in the lymphocyte population. Gating strategy is shown
Though several reports have demonstrated a loss of T-cell subsets in mice, NHP, and humans, few reports have described substantial changes in the B-cell compartment following EBOV infection (12,21). As seen with CD3+ T-cells, a steady decline in CD20+ B-cells was observed beginning by days 3 and 5, with the largest decrease of approximately two- to threefold noted by day 7 or 8. In the animals that survived past day 8, a slight increase in the B-cell compartment was seen, but not as significant as that of the CD3 T-cell subsets.
In accordance with reported EBOV-specific B-cell responses, both IgM and IgG antibodies specific to Ebola glycoprotein were detectable in two of the four animals that survived past day 9, though only the surviving animal reached above 2-log titers (Supplementary Fig. S1). This highlights the fact that an effective immune response against EBOV can be developed with time. In parallel, previous murine studies have shown that the CD8 T-cells that do survive during an EBOV infection are functionally capable of providing protection to naïve animals upon transfer (5). Therapeutics that can slow the progress of filoviral disease may delay infection sufficiently to allow the emergence of these effective immune responses.
Conclusions
In this report, immunological and pathological changes are described that characterize EBOV infection of rhesus macaques. A thorough analysis of the macaque model of infection will help support the advanced development of filovirus countermeasures through the regulatory path, paving the way for potential human therapies. In addition, a decline in the CD20+ lymphocyte population during infection is documented, in addition to previously documented CD3+ T-cell declines. These data suggest that EBOV infection may cause depletion of the B-cell compartment as well as the T-cell compartment. Finally, the profile of a naïve macaque that survived challenge is considered in the context of 17 animals that succumbed to infection. The animal that survived presented with a delayed elevation in serum viral RNA, concurrent with a delayed inflammatory cytokine and chemokine response. Potentially, this delay may have contributed to the ability of the animal to control and eliminate the infection, suggesting that early intervention with, for example, antibody therapies that can delay the expansion of infection might be of utility. Further evaluation of animals that survive EBOV infection without medical intervention may help us better understand what distinguishes human survivors from nonsurvivors.
Footnotes
Acknowledgments
We would like to acknowledge the hard work and dedication of the veterinary and pathology staffs of USAMRIID, as well as the entire Bavari team. We would also like to acknowledge funding from the Department of Defense, Defense Threat Reduction Agency, Joint Science and Technology Office.
Opinions, interpretations, conclusions, and recommendations are those of the authors and are not necessarily endorsed by the U.S. Army.
Author Disclosure Statement
No competing financial interests exist.
References
Supplementary Material
Please find the following supplemental material available below.
For Open Access articles published under a Creative Commons License, all supplemental material carries the same license as the article it is associated with.
For non-Open Access articles published, all supplemental material carries a non-exclusive license, and permission requests for re-use of supplemental material or any part of supplemental material shall be sent directly to the copyright owner as specified in the copyright notice associated with the article.