
Abstract
Chickens from two inbred lines selected for high (L10H) or low (L10L) mannose-binding lectin (MBL) serum concentrations were infected with infectious bronchitis virus (IBV), and innate as well as adaptive immunological parameters were measured throughout the experimental period. Chickens with high MBL serum concentrations were found to have less viral load in the trachea than chickens with low MBL serum concentrations indicating that these chickens were less severely affected by the infection. This study is the first to show that MBL expression is present in the lungs of healthy chickens and that the expression is upregulated at days 3 postinfection (p.i.) in L10H chickens. Furthermore, in the liver of infected chickens, the MBL expression was upregulated at day 7 p.i., despite the fact that the MBL serum concentrations were decreased below baseline at that time point. The number of TCRγδ+CD8α+ cells in the blood of noninfected chickens increased from week 0 to 3 p.i. However, the number of cells was higher in L10H chickens than in L10L chickens throughout the experiment. No increase was observed in the number of TCRγδ+CD8α+ cells in the blood of the infected L10H and L10L chickens. The numbers of B cells at week 3 p.i. were higher for noninfected L10L chickens than for the other chickens. No differences were observed between the infected and noninfected L10H chickens or between the infected L10H and L10L chickens. Furthermore, at week 3 p.i., the number of monocytes was higher in infected and noninfected L10H chickens than in the infected and noninfected L10L chickens. Thus, these results indicate that MBL is produced locally and may be involved in the regulation of the cellular immune response after an IBV infection. However, MBL did not appear to influence the humoral immune response after IBV infection in this study.
Introduction
I
IB is common in areas with intensive poultry productions. Because of this and the highly infectious nature of IBV, the ideal management in the poultry industry requires strict quarantine measures, but attempts to keep flocks IBV-clear have not been successful. This has necessitated the use of vaccines to reduce the production losses. Live-attenuated vaccines have been used as far back as in the 1940s, and today, both live-attenuated and inactivated virus vaccines are used (12,16,26). Some of the vaccines may offer cross-protection between different IBV strains, but this is not true for all vaccines (10,39). However, combined administration of different attenuated IBV strains may improve cross-protection (58).
During a primary infection, innate immune responses are induced in the mucosal lining of trachea as the binding of IBV virions to receptors on epithelia cells initiates the infection. Recent studies suggest that the binding is sialic acid dependent and that chicken homologues of the human receptors, DC-SIGN or L-SIGN, are part of an IBV receptor complex (1,59,61). Receptors such as the toll-like receptor (TLR) 3, TLR7, and TLR2/6 may initiate the local trachea innate immune response upon IBV recognition (21,57). Since mannose-binding lectin (MBL) binds to IBV (36), early events in the immune response to IBV infection may involve MBL by opsonization of free virions, by complement activation at mucosal sites, or by inhibition of the virus entry through sialic acid-dependent receptors (21,31,32,47,63). In mammals, the complement system has been suggested to be important in T-cell activation together with the production of types I and II interferons (IFNs) and other mediators, which trigger the antiviral state of neighboring cells and the influx of T cells to the local tissue (35). Hence, IBV infection induces broad immune responses in chickens, but the extent of the immune response varies depending on the IBV strain, the infection route, and the infected tissues. Furthermore, although all chicks are susceptible to IBV, both field and experimental studies show that the outcome of the infection differs between genetically different lines (4,33,46). Several studies have shown that major histocompatibility complex (MHC) haplotypes influence the susceptibility to IBV infection (3,4,7,15).
In both humans and chickens, large variations in serum levels of MBL between individuals are found. MBL deficiency in humans and the influence on the susceptibility to different types of infections have been subject to extensive studies, as reviewed in Heitzeneder et al. (24), Mayilyan (42), and Takahashi (56). Studies have shown that MBL may participate in the protection of the human host against viral infections, such as infections with influenza A virus (13), hepatitis C virus (6), Ebola virus (44), and severe acute respiratory syndrome (SARS) coronavirus (28,63). In chickens, MBL serum concentrations have also been associated with the severity of a variety of diseases, such as infections caused by IBV (32), Escherichia coli (48), Pasteurella multocida (52), and Ascaridia galli (unpublished data).
Selective breeding of chickens for low or high MBL serum concentrations has been practiced for numerous generations at our department as published by Juul-Madsen et al. (32). This has resulted in two separate chicken lines designated high (L10H) or low (L10L) with mean MBL serum concentrations of 33.4 μg/mL serum (L10H) and 7.6 μg/mL serum (L10L) in the 14th generation (unpublished data). The average MBL serum concentration for 14 different chicken strains representing both broilers and layers is approximately 6 μg/mL and varies from 0.4 to 37.8 μg/mL in 308 apparently normal chickens (38). Studies using the L10 chicken sublines as well as the outbred chickens have shown an inverse relationship between the MBL serum concentrations and the pathogen-specific Ig antibody response (32,52). Also, studies in mice have shown that MBL deficiency may result in a higher pathogen-specific IgG antibody response after both fungal infection (45) and bacterial vaccination (22). The adaptive immune system relies on inflammatory signaling, and MBL has been suggested to play a role in the regulation of this signaling by upregulating tumor necrosis factor-α, interleukin (IL)-6 responses, and other proinflammatory cytokines and chemokines, such as IL-1α, IL-β, and IFN-γ in mice (29,40,55). The elucidation of the role of MBL in the development of adaptive immunity during an IBV infection may lead to a better understanding of how MBL may influence the outcome of infection. Thus, the aim of this study was to characterize the cellular and humoral immune response after IBV infection in the two chicken lines, L10H and L10L, varying in MBL serum concentrations. Innate as well as adaptive immunological parameters were measured throughout the experimental period.
Materials and Methods
Animal material and experimental design
Generation 14 from the two AU inbred lines L10H and L10L (32) was used in the study (n=96). Chickens from L10H and L10L consist of 66.5% UM-B19 and 33.5% White Cornish (38). The offspring was reared together in a biosecured IBV-free environment until they were 3 weeks of age and then allocated into two different groups with 24 birds from each line in each group. The chickens were transferred to biosafety level 2 facilities and randomly allocated into four groups and placed into four isolators. Two isolators contained noninfected chickens (group 1 and 2) and two isolators contained infected chickens (group 3 and 4). The isolators with group 1 and 3 contained 15 chickens, whereas isolators with group 2 and 4 contained 30 chickens. The virulent IBV-M41 (a kind gift from Dr. med. vet. Hans-C. Philipp at the Lohmann Animal Health GmbH, Cuxhaven, Germany) was obtained as freeze-dried vials containing 108.2 EID50/1.5 mL/vial. The virus had been passaged twice in specific pathogen-free embryonated eggs. All IBV inocula were prepared in phosphate-buffered saline (PBS) just before use and contained at least 105.2 EID50/100 μL of IBV-M41 virus. The first and second groups (the noninfected groups) were treated with 200 μL PBS per bird as a mock challenge. The third and fourth groups (the infected groups) were treated with 200 μL PBS per bird containing IBV-M41. The solutions were given half nasally and half orally to mimic the natural occurring inoculation routes of IBV in the chicken. The chickens were fed diets that met or exceeded the National Research Council requirements. Feed and water were provided ad libitum.
The experimental procedures were conducted under the protocols approved by the Danish Animal Experiments Inspectorate and complied with the Danish Ministry of Justice Law no. 382 (June 10, 1987) and Acts 739 (December 6, 1988) and 333 (May 19, 1990) concerning animal experimentation and care of experimental animals. The license to conduct the animal experiment was obtained by Helle R. Juul-Madsen. The experiment was conducted according to the ethical guidelines.
Sample collection
Blood samples were taken from the jugular vein of the chickens from groups 1 and 3 on days 0, 6, 14, and 21 postinfection (p.i.) and from groups 3 and 4 on days 0 and 7 p.i. Unstabilized blood for serum was collected from all the blood sampling time points, and EDTA-stabilized blood for immunophenotyping was collected on days 0, 6, 14, and 21 p.i. EDTA-stabilized blood was also collected on day 7 p.i. (groups 2 and 4) and day 21 p.i. (groups 1 and 3) for MBL and MHC genotyping. Tracheal swab samples were collected from group 1 on days 0 and 21 p.i., from group 2 on days 0 and 7 p.i., from group 3 on days 0, 2, 4, 6, 8, 14, and 21 p.i., and from group 4 on days 0, 1, 3, 5, and 7 p.i. Swab samples were kept in 0.5 mL virus media (20.4% Gibco® Penicillin–Streptomycin [Life Technologies Europe BV, Nærum, Denmark; cat. no. 15140-122]; 74% BioWhittaker® PBS [Lonza, Verviers, Belgium; cat. no. BE17-517Q]; 5% BioWhittaker fetal bovine serum [Lonza; cat. no. DE14-801F]; and 0.01‰ phenol red [Merck, Darmstadt, Germany; cat. no. 1072410005]) at −20°C until tested for viral load by real-time quantitative reverse transcription–polymerase chain reaction (qRT-PCR) after the termination of the experiment. The liver, lung, larynx, and trachea were collected from noninfected and infected chickens at days 3 and 7 p.i. (n=3 from each subline each day).
RNA and DNA isolation
For total RNA extraction from the liver, lung, larynx, and trachea, Tri Reagent® (Sigma-Aldrich, St. Louis, MO; cat. no. 93289) was used according to the manufacturer's instructions. Ten to 20 mg of tissue was used for RNA isolation. After the extraction, the RNA qualities were controlled on a 1% agarose gel, and the RNA concentration was measured using the Nanodrop® ND1000 Spectrophotometer (Saveen & Werner Danmark Aps, Jyllinge, Denmark). The samples were stored at −80°C if the RNA was not to be used immediately.
Genomic DNA used for MBL and MHC genotype determination was isolated from frozen blood samples using the NucleoSpin® 96 blood kit from Macherey-Nagel (Düren, Germany; cat. no. 740665) according to the manufacturer's instructions for vacuum processing. The DNA samples were stored at −20°C until use.
MBL and MHC genotype determination
MBL genotypes were determined by means of the Kompetitive Allele-Specific PCR (KASP) genotyping technology (LGC Genomics, Hoddesdon, United Kingdom). Using the LGC Genomics KASP assay design service, two assays were developed to distinguish between the CG and TA alleles of SNP1 and the GGGG and AGGA alleles of SNP2 in the MBL promoter region (37). The KASP genotyping technology is based on fluorescently labeled allele-specific PCR primers. Primers for both SNP markers were designed based on flanking regions in the chicken genomic MBL promoter sequences (Table 1). A total of 5 μL reaction volume containing 25 ng of DNA was prepared according to the manufacturer's instructions and applied to 384-well PCR plates. The following PCR cycling conditions were used: 94°C for 15 min (hot-start activation) followed by 10 cycles of touchdown PCR denaturing at 94°C for 20 sec and annealing/elongation at 65–57°C for 1 min dropping 0.8°C per cycle. Final elongation was performed with 35 cycles of denaturation at 94°C for 10 sec and annealing and extension at 57°C for 1 min. Endpoint fluorescence reading was performed using the Tecan Infinite® 200 PRO plate reader (Tecan Group Ltd., Männedorf, Switzerland). Allele discrimination was performed using two allele-specific fluorescent dyes: FAM (485 nm excitation, 520 nm emission) and HEX (535 nm excitation, 556 nm emission) with ROX used as an internal reference fluorescent dye (575 nm excitation, 610 nm emission). Finally, genotyping data were analyzed by use of the KlusterCaller software 2.24.0.11 (LGC Genomics).
The design is based on the flanking regions of SNP1 and SNP2 in the chicken genomic MBL promoter sequences. The SNPs are marked with a forward slash (/) and surrounded by square brackets.
NC_006093.3.
MBL, mannose-binding lectin.
Putative MHC genotypes of the chickens were determined using the LEI0258 microsatellite locus (43) by a PCR-based fragment analysis (20), as previously described (18).
Real-time qRT-PCR of IBV load
The viral load was determined using a method previously described (36). Briefly, three swab samples from each subline, treatment group and day, were pooled; thus, three pools per subline were analyzed for each time point. RNA purification was performed using the QIAamp® Viral RNA Mini kit (Qiagen, Copenhagen, Denmark; cat. no. 52904) according to the manufacturer's instructions. The RT-PCR was carried out using the High-Capacity cDNA Archive kit (Applied Biosystems™ by Life Technologies™, Nærum, Denmark; cat. no. 436881) according to the manufacturer's instructions with 25 μL of RNA. The qRT-PCR was performed with the forward primer IBV5′GU391 (5′-GCTTTTGAGCCTAGCGTT-3′), the reverse primer IBV5′GL533 (5′-GCCATGTTGTCACTGTCTATTG-3′), and the dual-labeled probe IBV5′G probe (5′-FAM-CACCACCAGAACCTGTCACCTC-BHQ1-3′) as previously described by Callison et al. (8). The total reaction volume was 20 μL containing 11 μL TaqMan® Universal PCR Master Mix (Applied Biosystems, Life Technologies Europe BV; cat. no. 4304437), 0.9 μM primers, 0.125 μM probe, and 0.9 μL cDNA as template. The reaction was performed in the ViiA™ 7 system at 50°C for 2 min, 95°C for 10 min with optic off; 40 cycles of 95°C for 15 sec followed by 60°C for 1 min with optics on. Standard curves were included in each qRT-PCR run and were generated from dilutions of cDNA originating from purified RNA from the live-attenuated Nobilis IB Ma5 Vet. The standard curves were made as fivefold dilutions starting at one dose, corresponding to minimum 103 EID50 according to the manufacturer's instructions. Results are expressed as viral load according to the standard curve. Each qRT-PCR experiment contained triplicate no-template controls, test samples, and dilution series.
ELISA
The MBL serum concentration was measured by ELISA as previously described (31,49). The IBV-specific Ig antibody titers in serum were measured as previously described (33) using the ProFLOK® IBV Antibody Test Kit from Synbiotics Corporation (San Diego, CA; cat. no. 96-6506) according to the manufacturer's instructions.
Real-time RT-PCR: MBL expression
The MBL expression was measured in the liver, larynx, and lung tissues at days 3 and 7 p.i. using a two-step real-time RT-PCR method. Real-time RT-PCR was performed on total RNA titration for the assessment of the optimal total RNA concentration. Based on this, the concentration of total RNA was adjusted to 10 ng/μL to ensure that differences in endogenous control genes and MBL gene expression were not because of variability in RNA concentrations. The total RNA was reverse transcribed using the High-Capacity cDNA Archive kit (Applied Biosystems by Life Technologies; cat. no. 436881) according to the manufacturer's instructions. The resulting cDNA was used as template for real-time RT-PCR. Assessment of the variability between tissues and between noninfected and infected chickens of endogenous control genes (Supplementary Table S1 for names of genes and their TaqMan Gene Expression Assay ID; Supplementary Data are available online at
Flow cytometry
The absolute numbers of different T-cell subsets in peripheral blood were determined at weeks 0, 1, and 3 p.i. using a no-lyse no-wash flow cytometric method as previously described (36) with a few modifications. Fifty microliters of 25 times diluted EDTA-stabilized blood was mixed with 50 μL antibody solution containing anti-TCRγδ-FITC (clone TCR1), anti-CD4-R-PE (clone CT-4), and anti-CD8α-CY5 (clone 3-298) in FACS buffer (0.2% BSA, 0.2% sodium azide and 0.05% normal horse serum in PBS). All monoclonal antibodies were obtained from Southern Biotech (Birmingham, AL). The samples were incubated at room temperature for 20 min in darkness, and immediately before acquisition, 400 μL FACS-buffer and 25 μL Flow-Count™ Fluorospheres (Beckman Coulter, Mervue, Galway, Ireland; cat. no. 7547053) were added.
The numbers of B cells and monocytes were determined only at week 3 p.i. The protocol was as described above except for the use of 50 μL antibody solution containing anti-Monocyte/Macrophage-R-PE (clone KUL01) and anti-Bu-1-FITC (clone AV20) in FACS buffer.
All flow cytometric analyses were performed using the BD FACSCanto™ (BD Biosciences, San Jose, CA) equipped with a 488 nm blue laser and a 633 nm red laser. Single-stained compensation controls as well as negative fluorescence minus one controls were included. Titration of all antibodies was performed before the experiment to determine the optimal staining concentrations. The numbers of cells in the samples were calculated according to the manufacturer's instructions as follows: cells/μL=(total number of cells counted×dilution factor×μL fluorospheres added×assayed concentration of fluorospheres)/(total number of fluorospheres counted×total volume).
Statistics
All data, except for the viral load measured by qRT-PCR, were found to be normally distributed.
The viral loads were, due to pooled samples (only three pools per group), only tested for subline differences on day 3 p.i. by the Student t-test.
The model used to test for effect of infection, day of infection, and line on the MBL serum concentration measured by ELISA was yikjl=μ+Ii+Dj+Lk+DLjk+ILik+IDLikj+eikjl , where μ was the overall mean, Ii was the effect of infection or not, Dj was the effect of day j p.i., Lk was the effect of line k. The various interaction effects and yijk and eijk were expected to be normally distributed.
The model used to test for effect of infection, day of infection, and line on the MBL expression measured by real-time RT-PCR was yijk=μ+Li+Ij+Dk+LIDikj+eijk , where μ was the overall mean, Li was the effect of line i, Ij was the effect of infection or not, and Dk was the effect of day k p.i. The y was expected to be normal distributed within the sublines, and the residual error (eijk ) and the interaction term are expected to be normal distributed.
The model used for the IBV-specific Ig antibody titer measured by ELISA was yijkl=μ+Ii+Dj+Lk+IDLikj+eijkl , where μ was the overall mean, Ii was the effect of infection or not, Dj was the effect of day j p.i., and Lk was the effect of line k. The various interaction effects and yijk and eijk were expected to be normally distributed.
The model used for the absolute counts of TCRγδ −and TCRγδ +cells measured by flow cytometry was yijkl=μ+Ii+Wj+Lk+LWjk+ILik+TWLikj+eijkl , where μ was the overall mean, Ii was the effect of infection or not, Wj was the effect of week j p.i., and Lk was the effect of line k. The various interaction effects and yijk and eijk were expected to be normally distributed.
The model used for the absolute counts of B cells and monocytes measured by flow cytometry was yijl=μ+Ii+Lj+ILij+eijl , where μ was the overall mean, Ii was the effect of infection or not, and Lj was the effect of line j. The various interaction effects and yij and eij were expected to be normally distributed.
The analysis of the variance was performed by the GLM procedure of the SAS software (27).
Results
Determination of MBL and MHC genotypes
MBL genotypes were determined by the use of the KASP SNP genotyping technique (data not shown). All L10L chickens were homozygous for the A1 allele, and all L10H chickens were homozygous for the A3 allele (37). The marker alleles for the MHC genotypes were determined by the use of LEI0258 genotyping, and chickens were homozygous 194 bp (BW3-like haplotype) and heterozygous 194 bp/243 bp (BW3/B6-like haplotype) with the two genotypes being randomly distributed in the experimental groups.
Viral load
An IBV-specific qRT-PCR was used for monitoring the presence of IBV genomes in the tracheal swabs sampled from day 0 to 21 p.i. (Fig. 1). Three swab samples from each subline were pooled based on the treatment group and day. As expected, no virus was observed in the noninfected chickens at any time point throughout the experiment (data not shown). The viral load for the infected chickens peaked at day 3 p.i. followed by a decrease in viral loads reaching 0 at day 14 p.i. for both L10 sublines. The viral load was significantly higher for L10L chickens than for L10H chickens at day 3 p.i. (p<0.03).
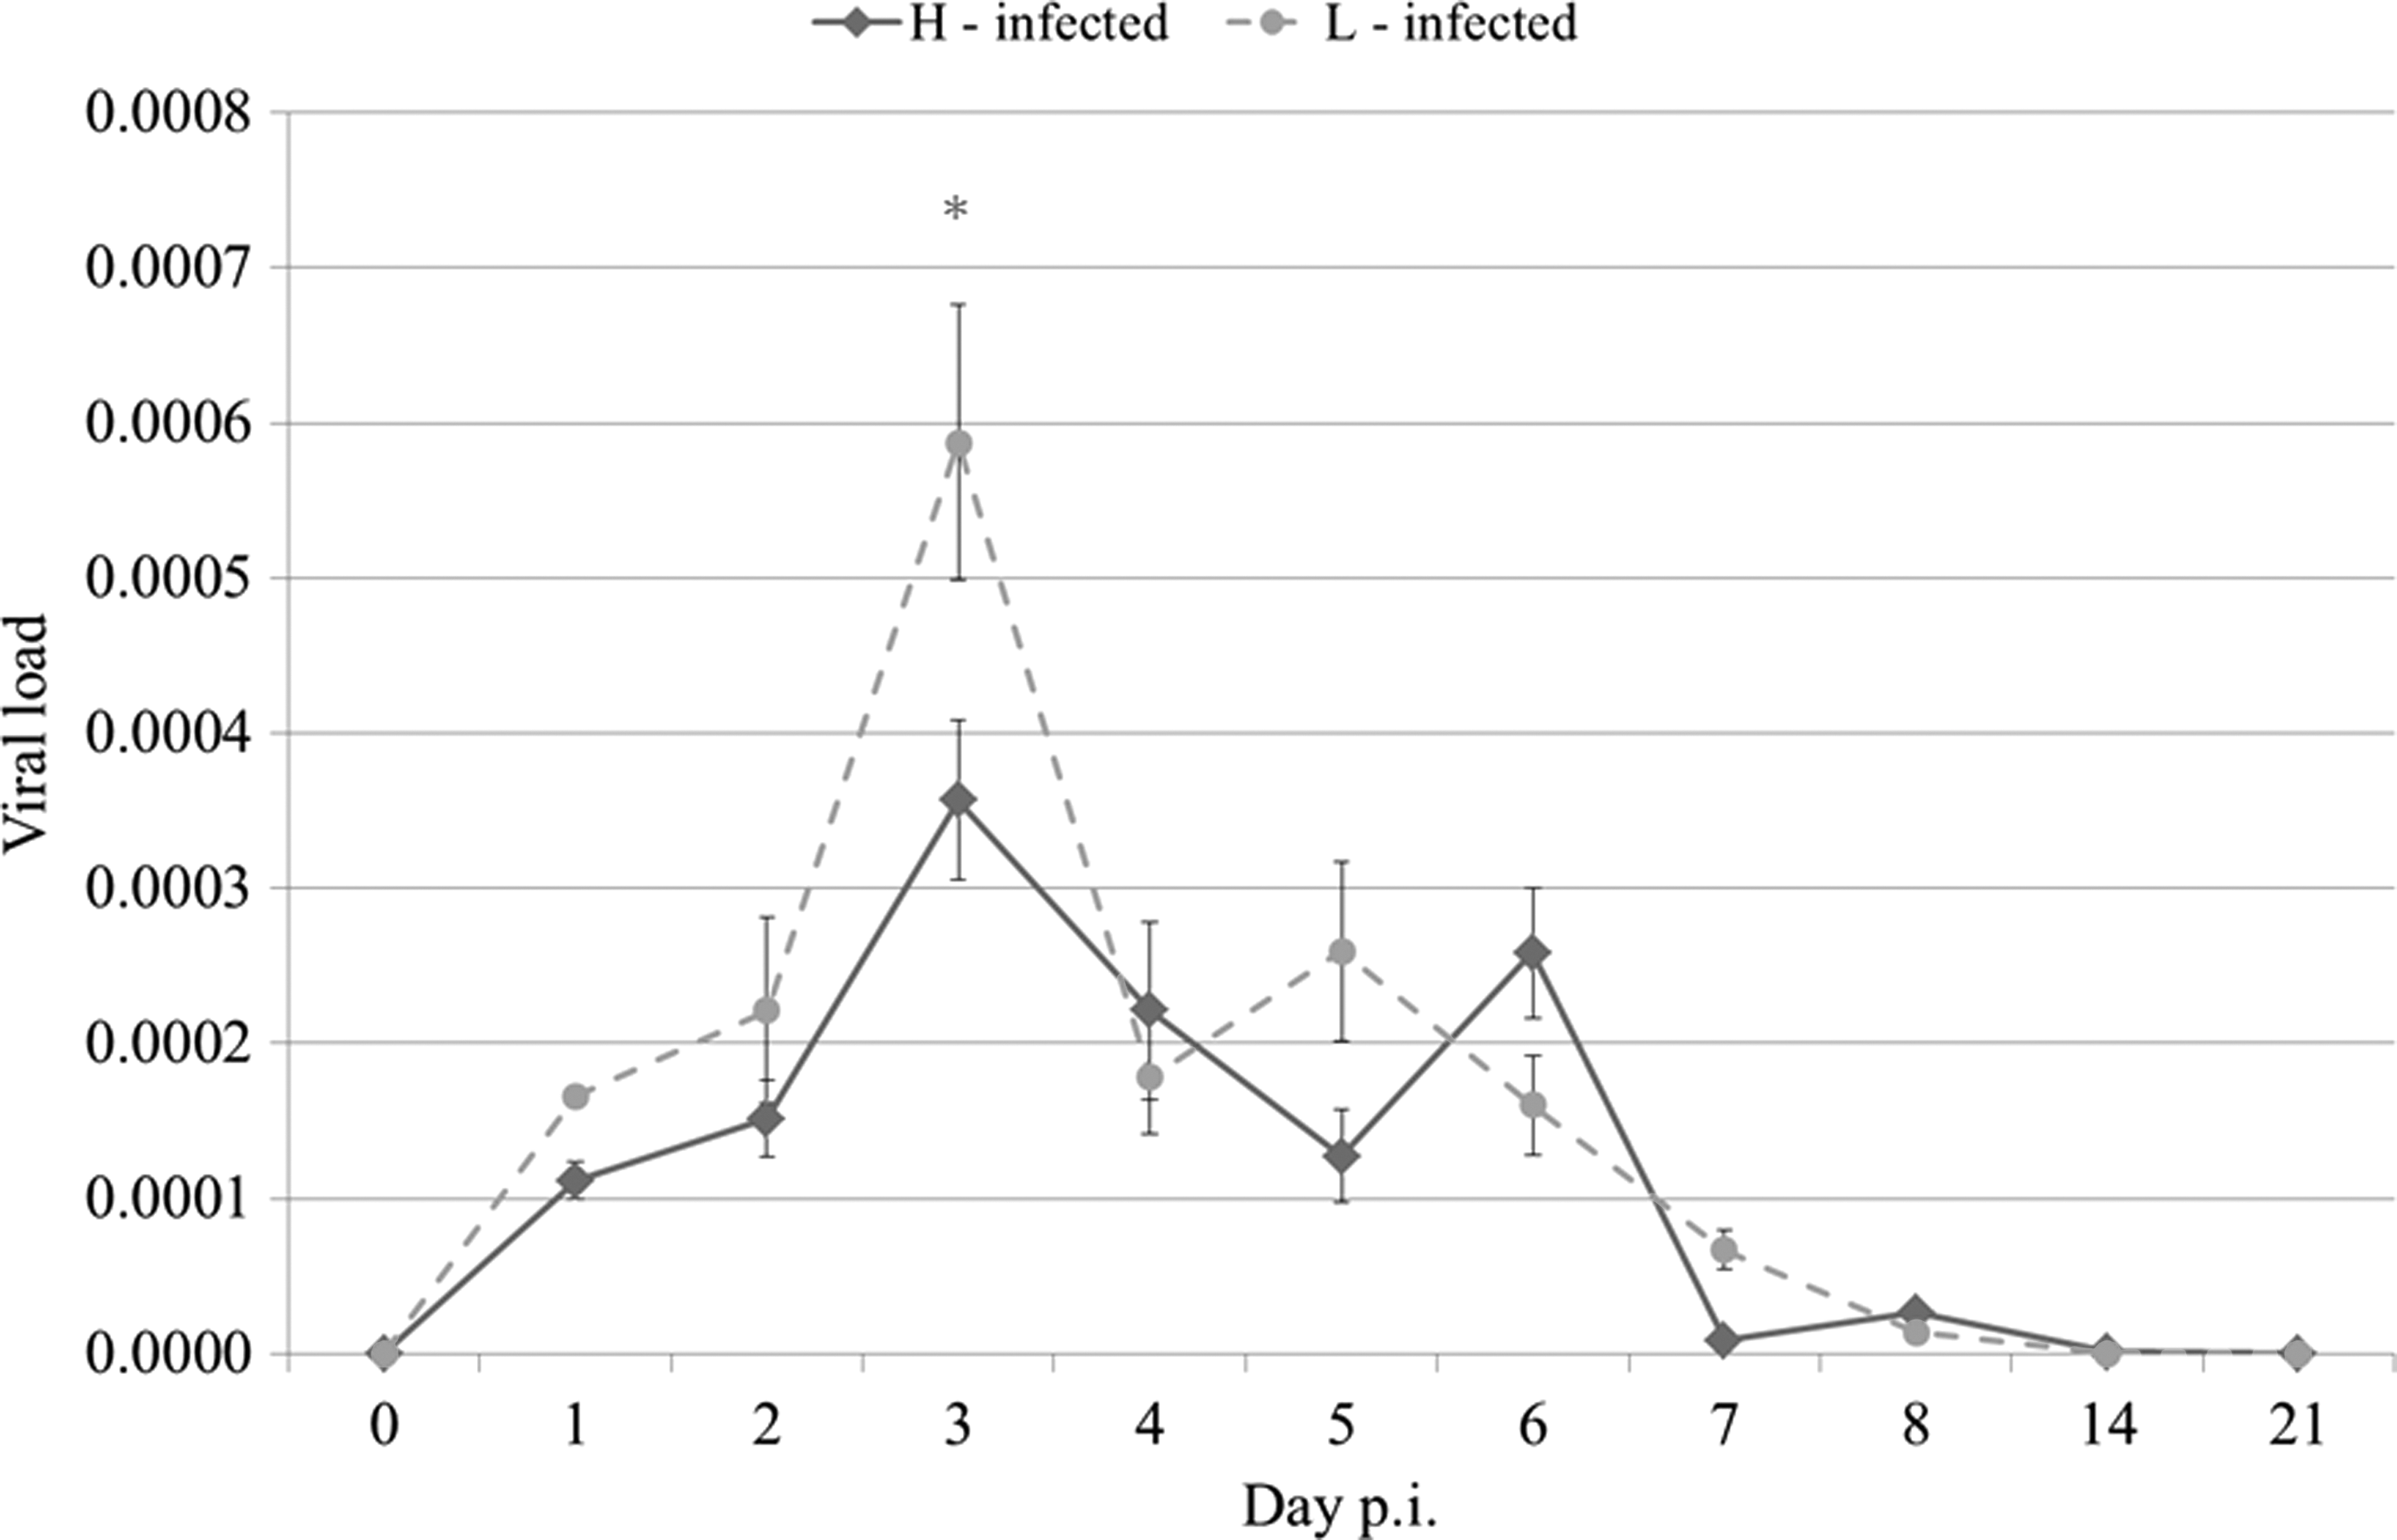
Viral load in the tracheal swabs sampled from day 0 to 21 postinfection (p.i.) as measured by infectious bronchitis virus (IBV)-specific quantitative reverse transcription–polymerase chain reaction (qRT-PCR). Results are shown as mean±SEM. The asterisk indicates a statistically significant difference (p<0.03) between infected L10H and L10L chickens. H or L indicates the sublines with high or low mannose-binding lectin (MBL) serum concentrations, respectively.
The MBL serum concentrations
The MBL concentration during the experimental period was measured in serum samples (Fig. 2). A distinct difference in the MBL serum concentrations between L10H and L10L chickens at week 0 p.i. (p<0.01) was observed. A weak acute phase response was observed in both sublines after infection peaking at day 3 p.i. followed by a decrease in the MBL serum concentrations below the baseline until day 7 p.i. and subsequently increasing to the level of baseline (L10L) or above (L10H, p<0.01). When comparing the MBL serum concentrations between noninfected chickens and infected chickens within days, a 1.5-fold increase for the infected L10H chickens and a 2.2-fold increase for the infected L10L chickens were observed at day 3 p.i., a 4.3-fold decrease for the infected L10H and a 14.1-fold decrease for the infected L10L chickens were observed at day 7 p.i., and at day 21 p.i., a 1.4-fold increase was observed for the infected L10H chickens, whereas the MBL serum concentration for the infected L10L reached the same MBL level as the noninfected L10L chickens.
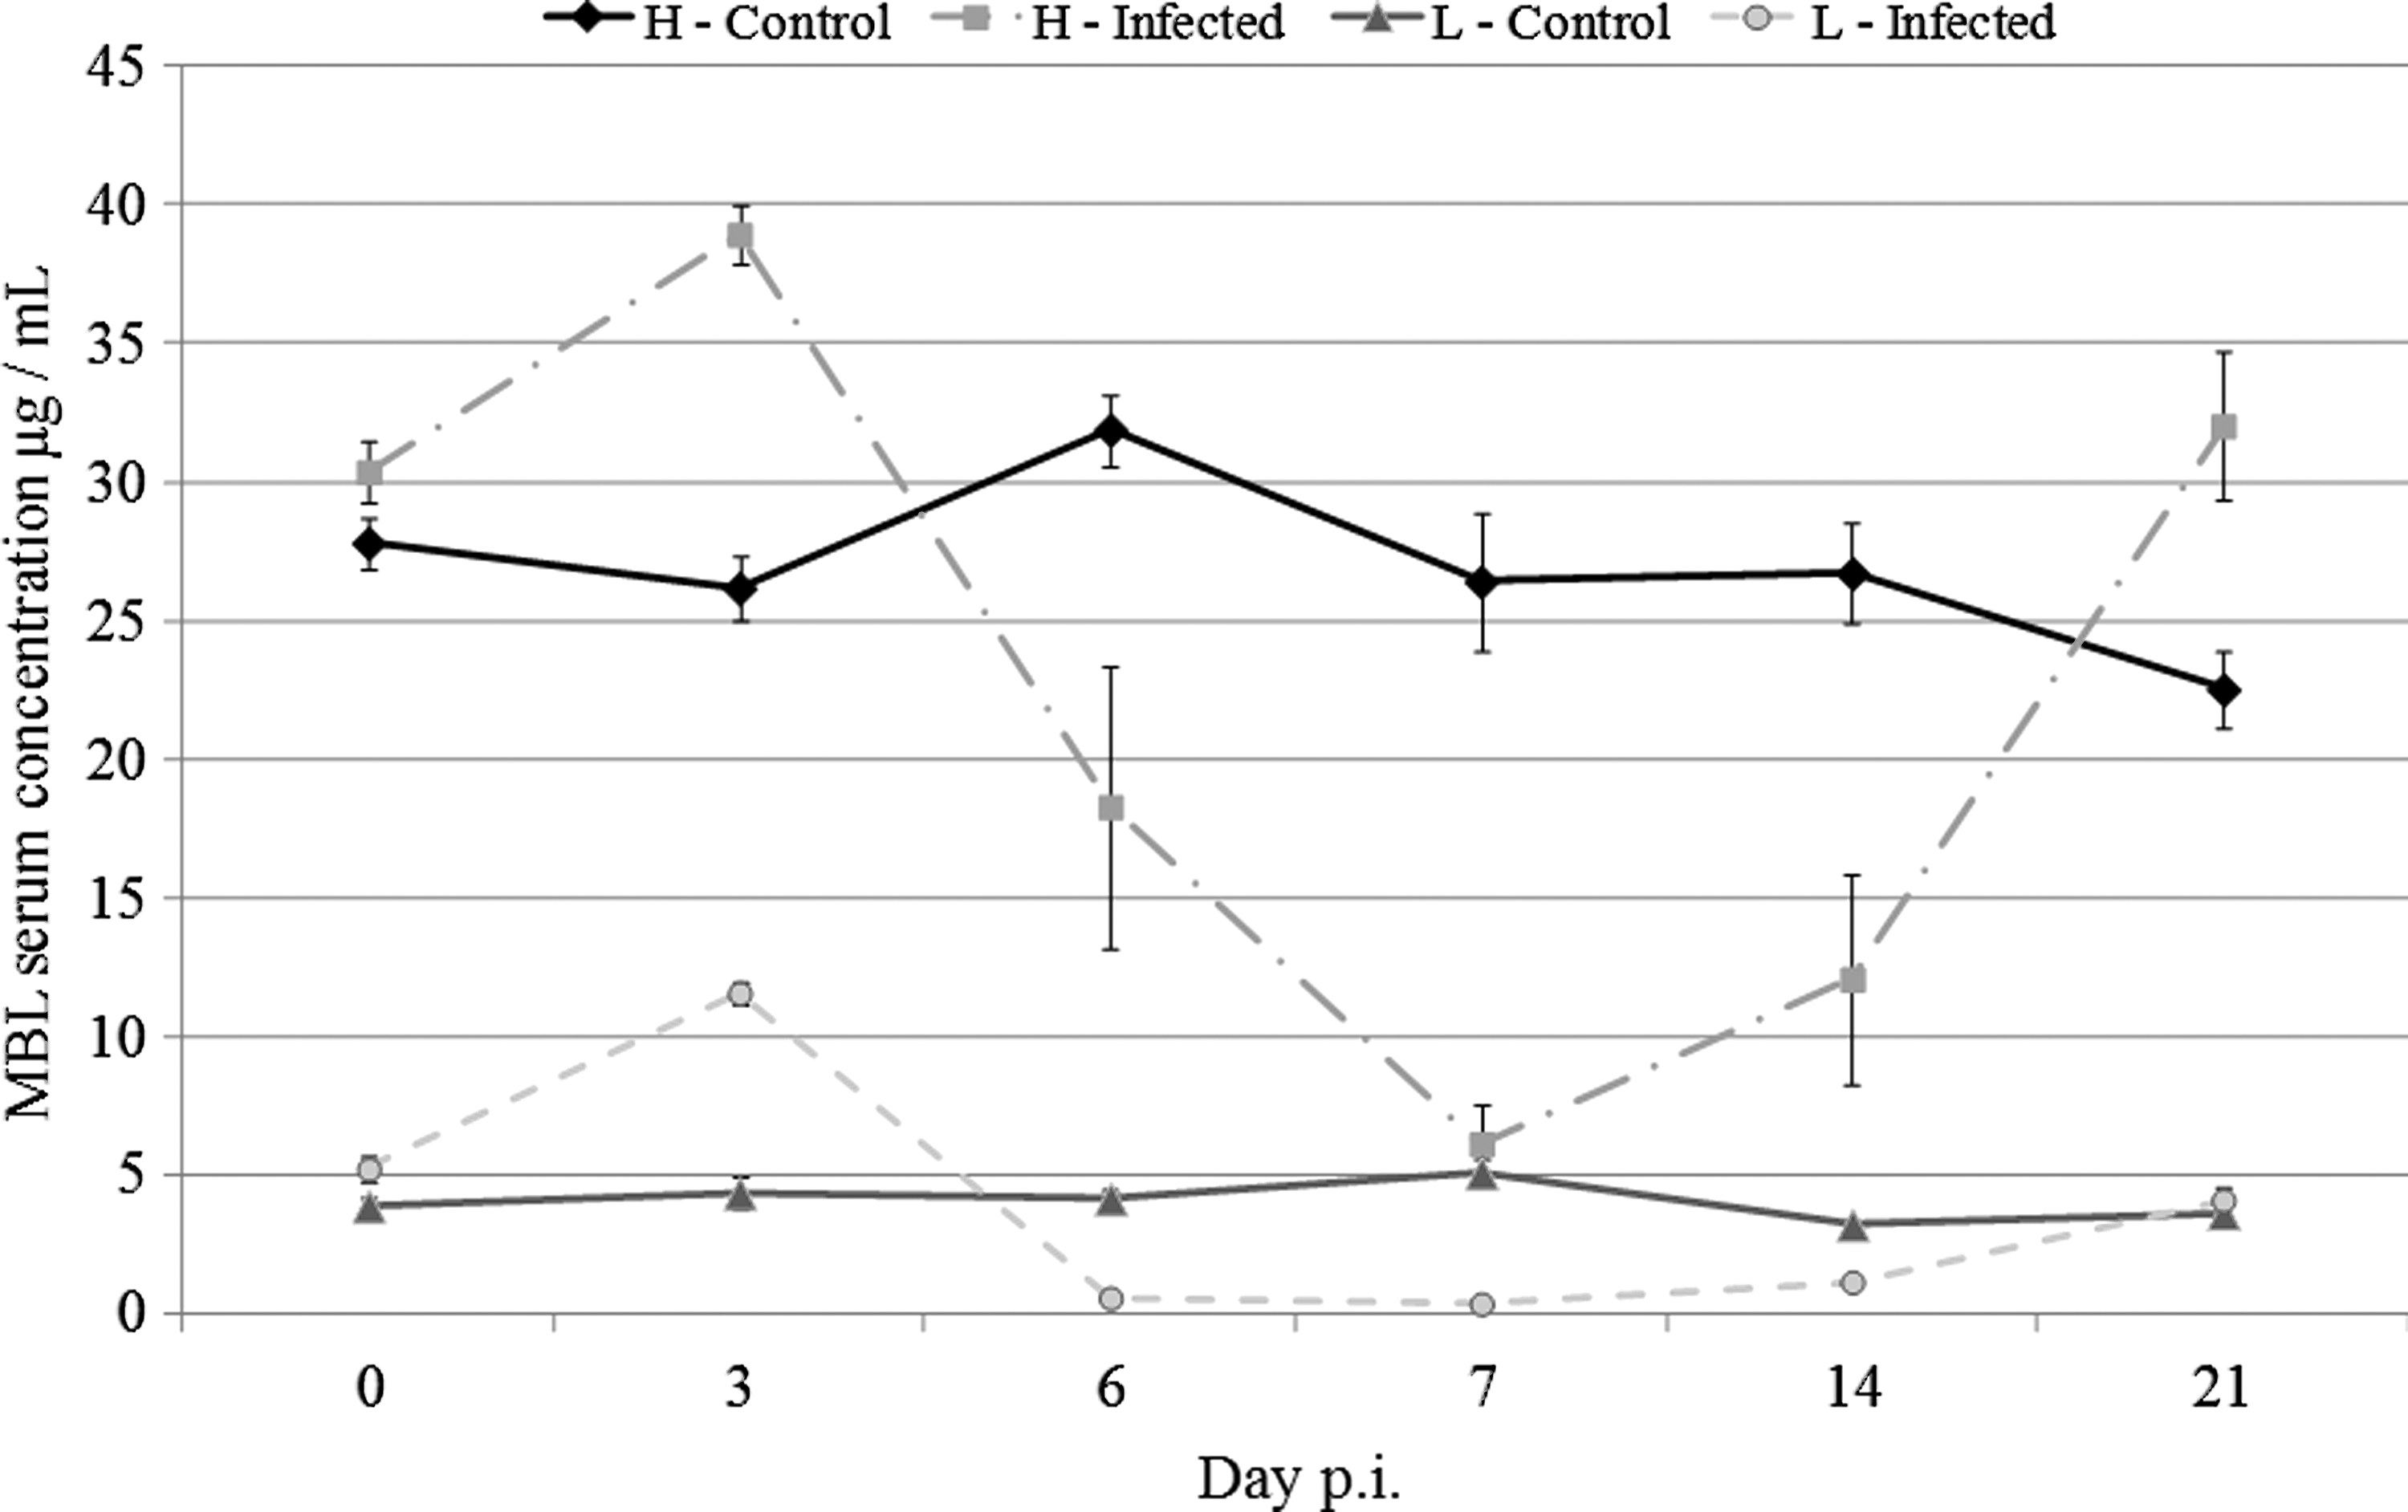
MBL serum concentration from day 0 to 21 p.i. as measured by ELISA. Results are shown as mean±SEM. H or L indicates the sublines with high or low MBL serum concentrations, respectively.
MBL mRNA expression
The MBL expression was measured in the liver, lung, and larynx tissues from six noninfected and six infected chickens on both days 3 and 7 p.i. and calculated as fold change compared to MBL expression in the lungs of noninfected L10L chickens on day 3 p.i. (Fig. 3).
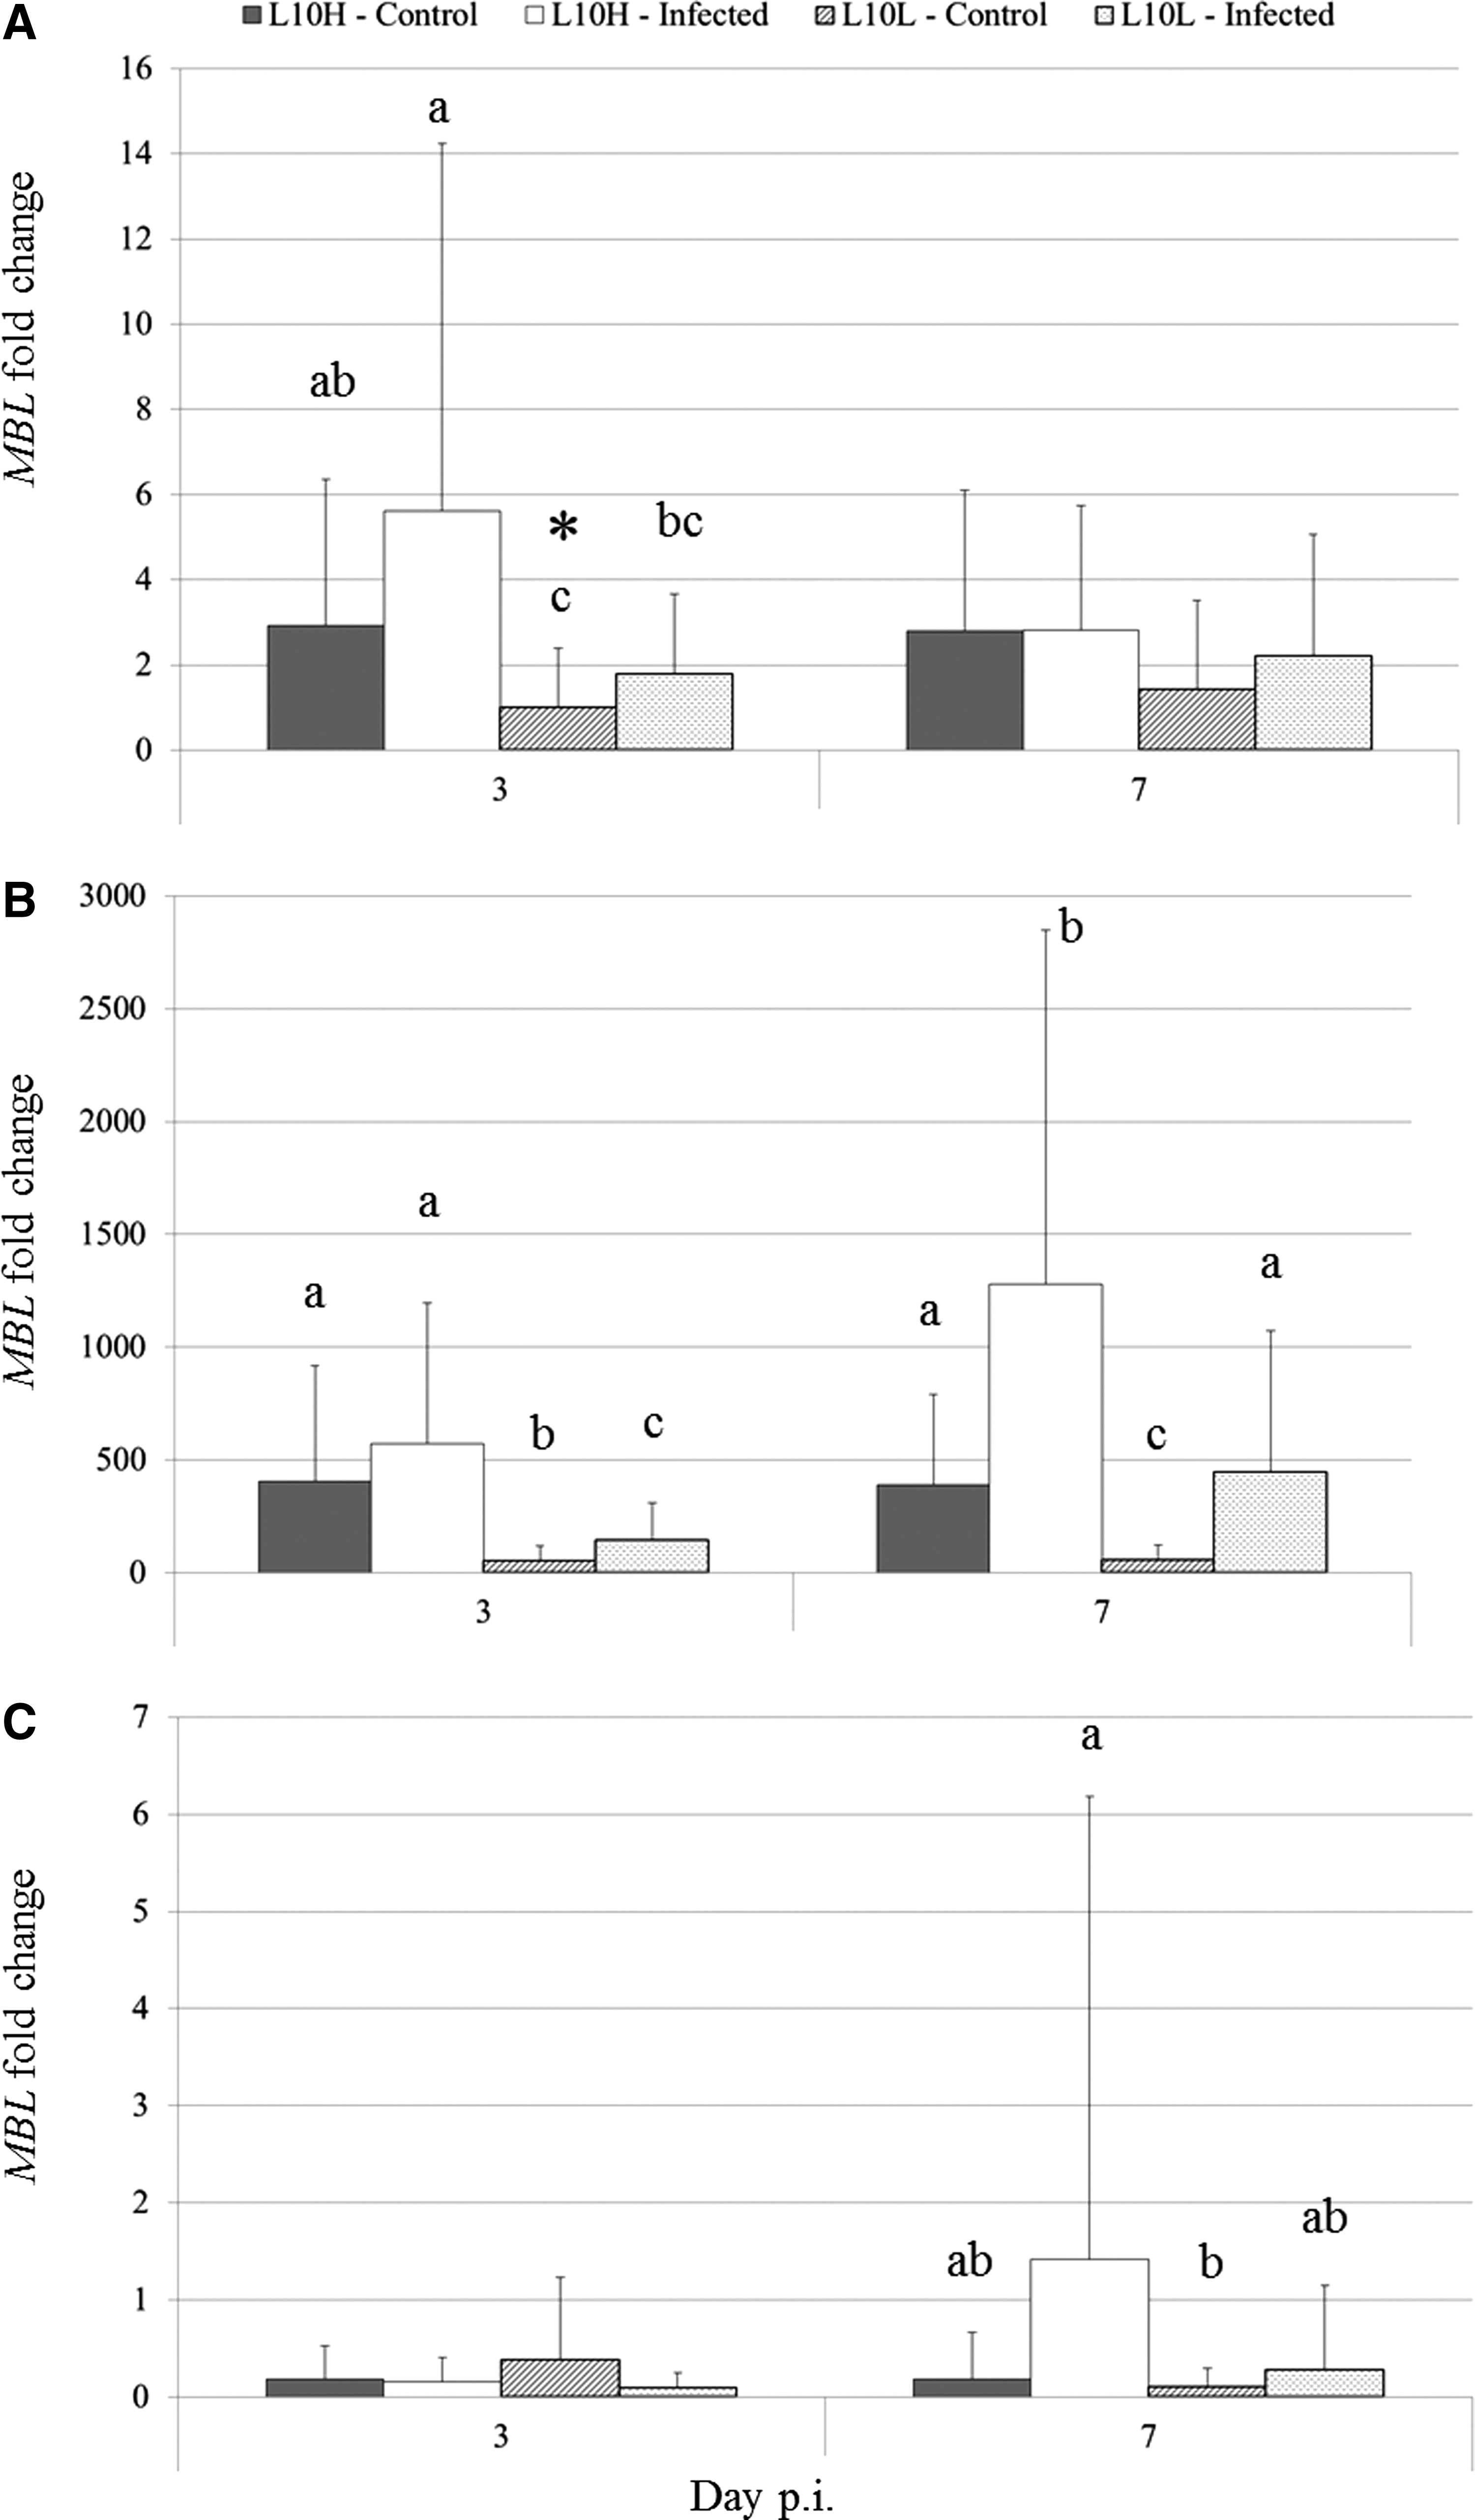
MBL expression at days 3 and 7 p.i. as measured by real-time RT-PCR. Results are shown as the mean MBL fold change in respective tissues compared to the MBL expression in the lung of noninfected L10L chickens day 3 p.i. (marked with asterisk)±SEM.
At day 3 p.i., the MBL fold change in the lung of noninfected L10H chickens was significantly higher than that of noninfected L10L chickens (p<0.05). A tendency for a different between MBL expression in infected and noninfected L10H chickens was observed (p=0 0.1) The MBL fold change in infected L10H chickens was three times higher than that of infected L10L chickens (p<0.01).
At day 3 p.i., the MBL fold change in the liver was 7.5 times higher in the noninfected L10H chickens than in the noninfected L10L chickens. The MBL fold change in infected L10L chickens was 2.7 times higher than that of the noninfected L10L chickens, but it did not reach the level of L10H chickens. The MBL fold change difference between noninfected and infected L10L chickens (7.7) was higher than observed for the L10H chickens (3.3). Furthermore, the MBL fold change in infected L10H chickens increased 2.2 times and 3 times in infected L10L chickens from days 3 to 7 p.i. All differences were statistically significant (p<0.01).
At days 3 and 7 p.i., no significant difference of interest between the MBL fold changes in the larynx of the chickens were observed.
The IBV-specific Ig antibody titer
IBV-specific Ig antibody titers were measured by ELISA (Fig. 4). As expected, the noninfected chickens were seronegative throughout the experiment. For both the infected L10H and L10L chickens, an increase in IBV-specific antibodies was observed from day 14 p.i. and onward with the titers being significantly higher than the titers for the noninfected chickens (p<0.01). However, no differences in antibody titers were observed between the infected L10H and L10L chickens.
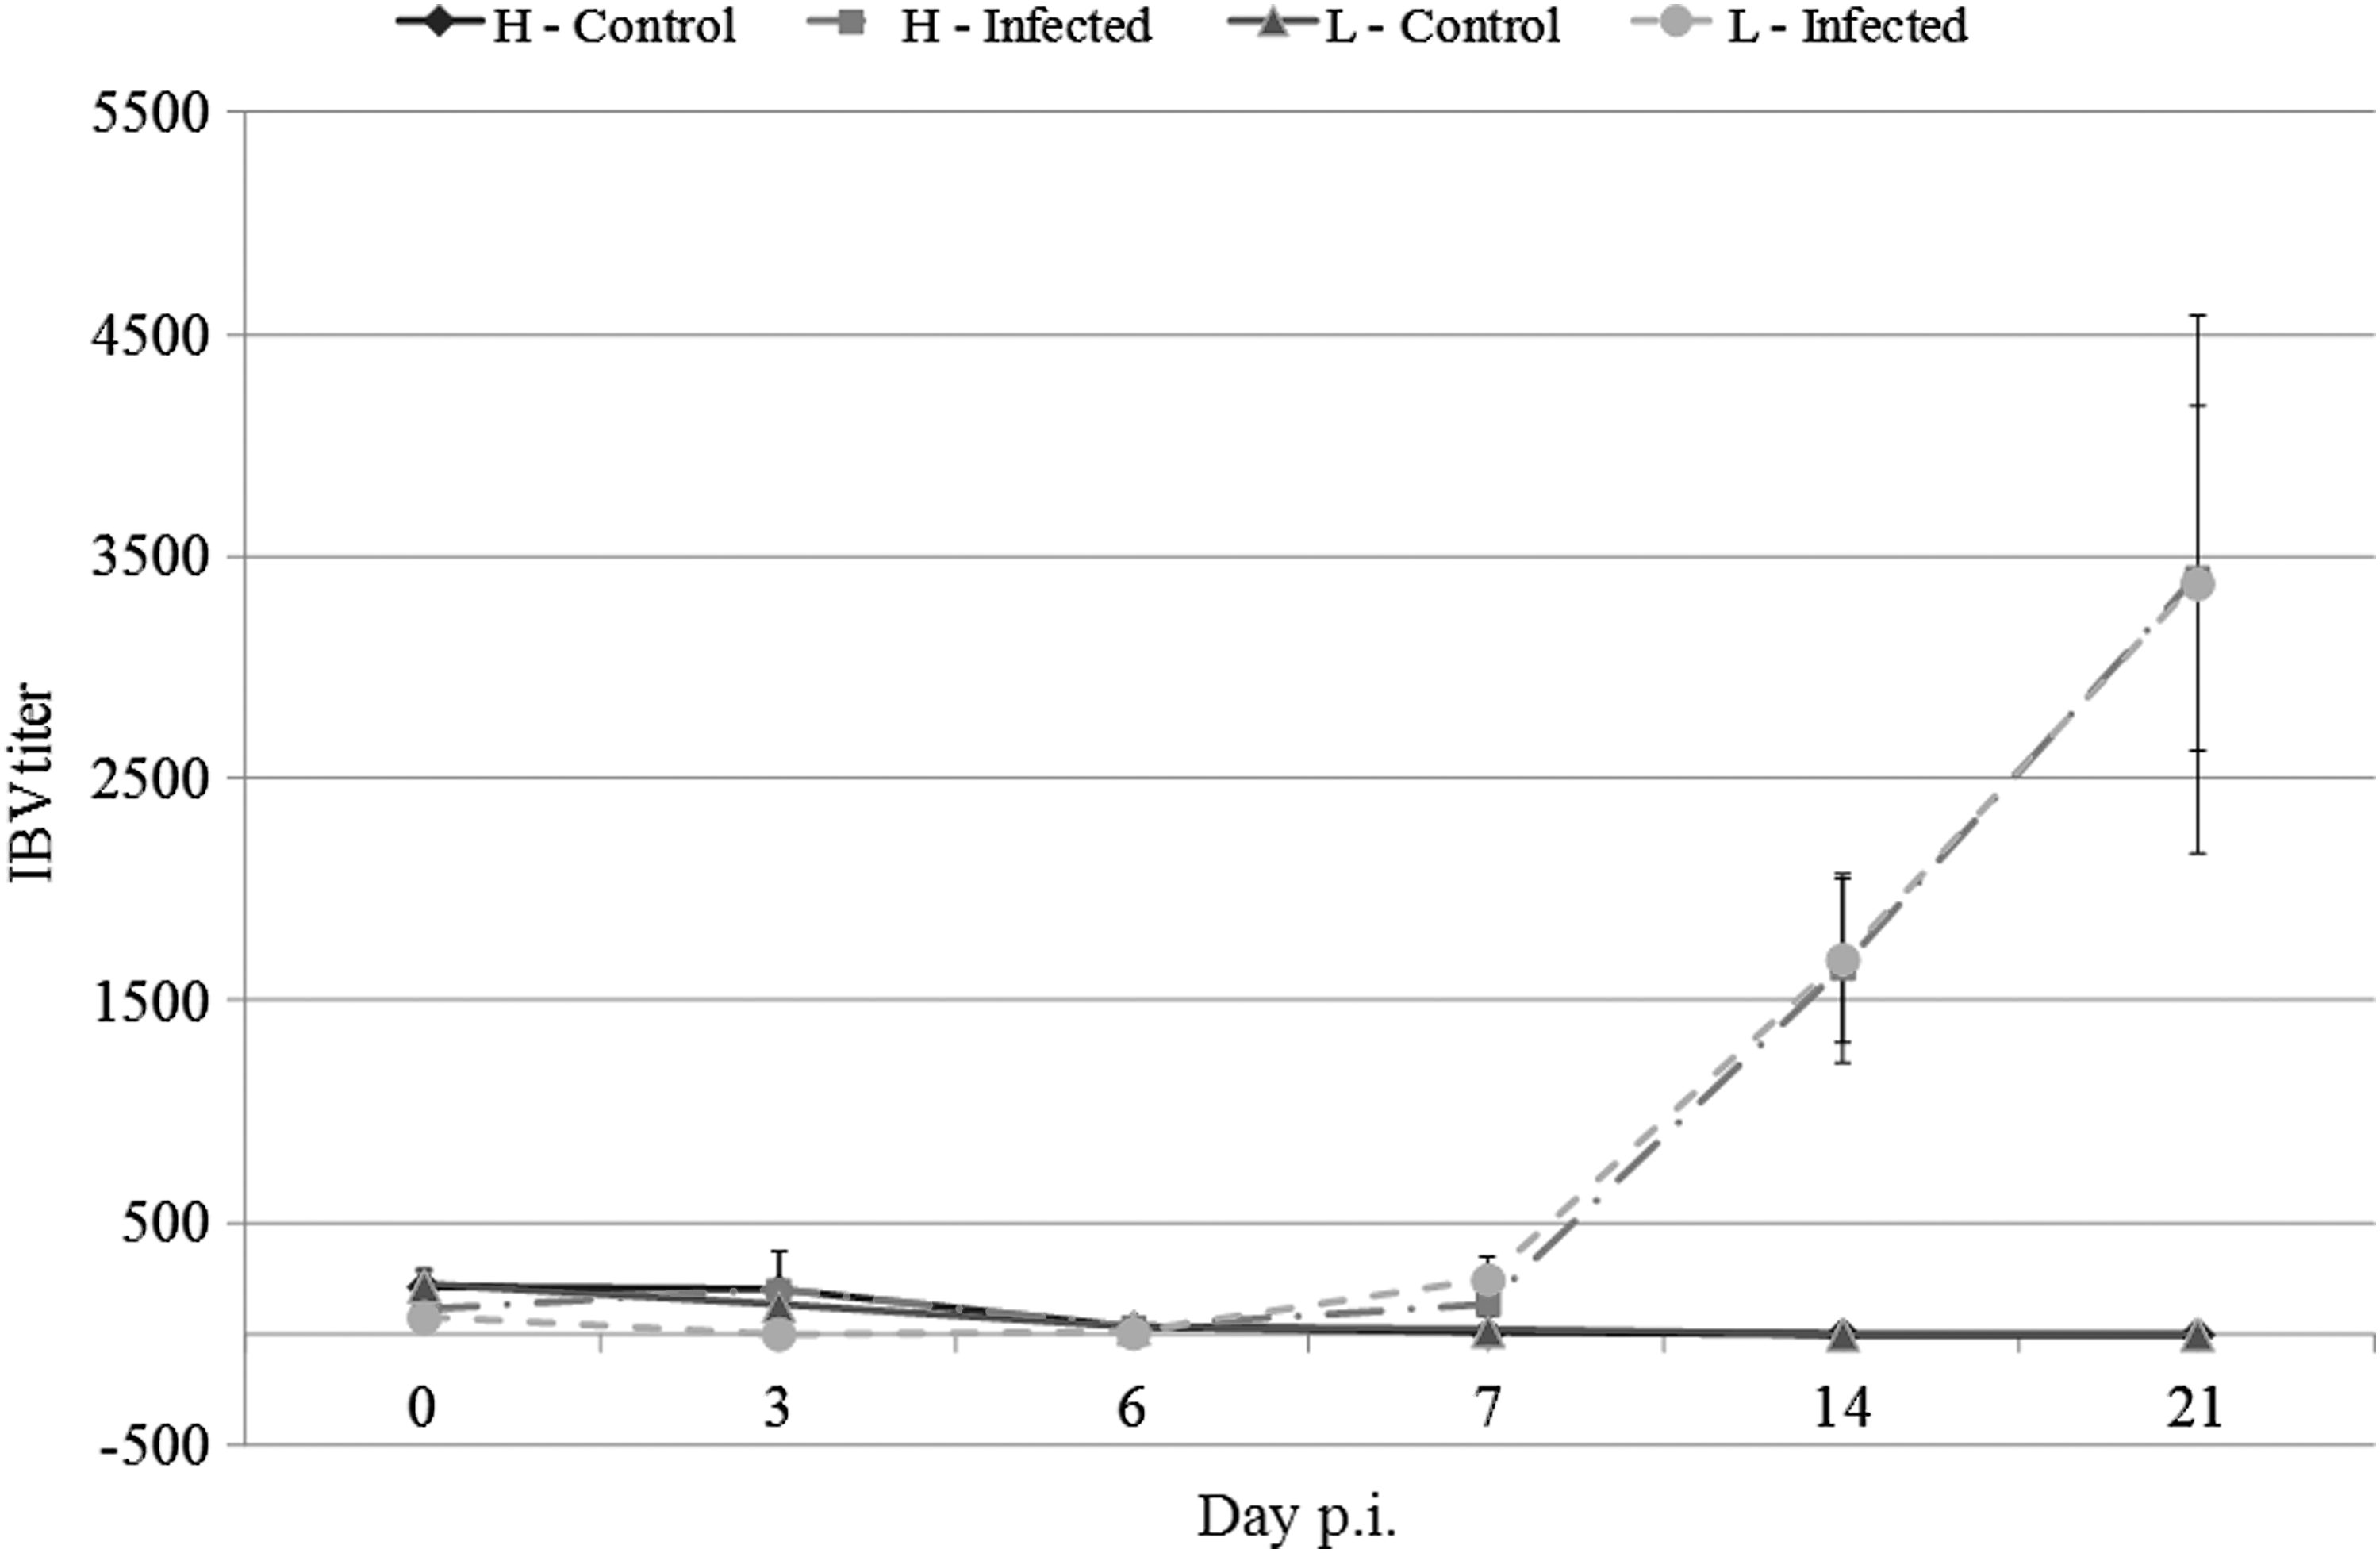
IBV-specific Ig antibody titers from 0 to 21 p.i. as measured by ELISA. Results are shown as mean±SEM. H or L indicates the sublines with high or low MBL serum concentrations, respectively.
Flow cytometric assessment of lymphocyte subsets
An absolute count flow cytometric protocol using a no-lyse no-wash method, as described by Seliger et al. (53), was used for quantifying T-cell subsets in peripheral blood. The T-cell subsets were identified as shown in Figure 5A. TCRγδ−CD4+CD8α+ and TCRγδ−CD4+CD8α− cells were combined as total TCRγδ−CD4+ cells due to individual differences in the counts of TCRγδ−CD4+CD8α+ cells between chickens that have an heritable origin (23). The results are presented in Figure 6.
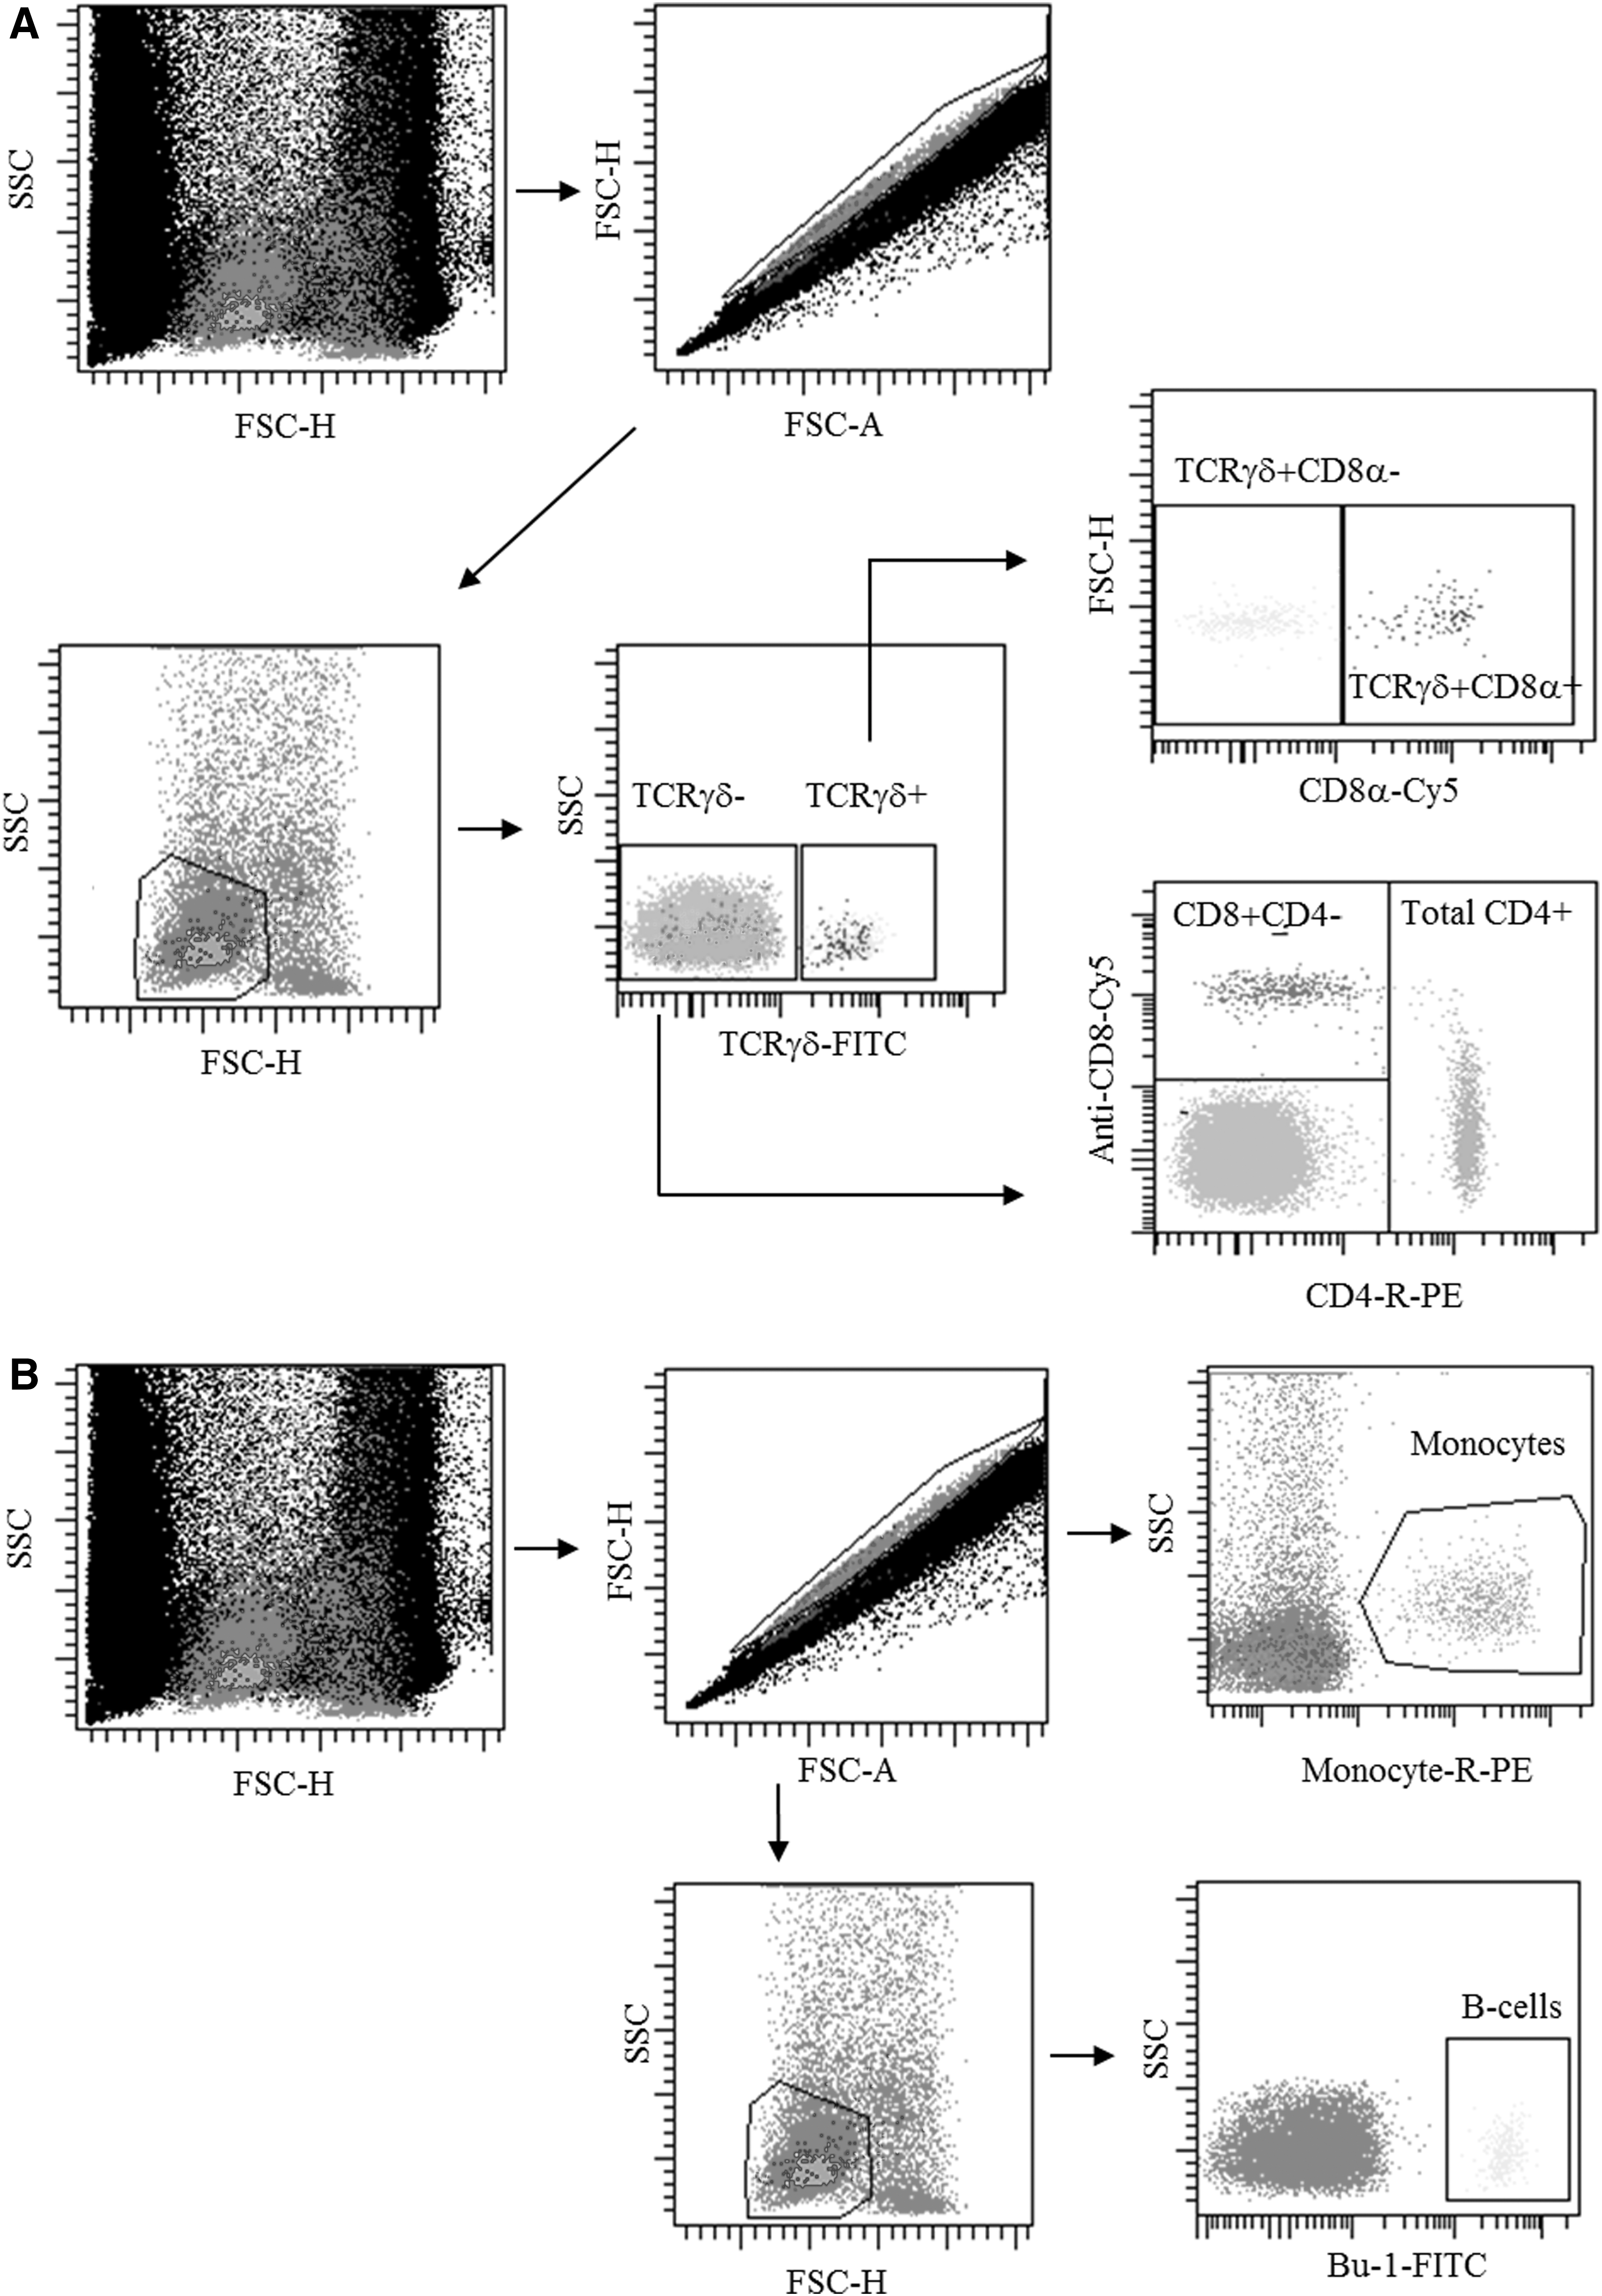
Detection of lymphocytes in whole blood using the no-lyse no-wash flow cytometry procedure.
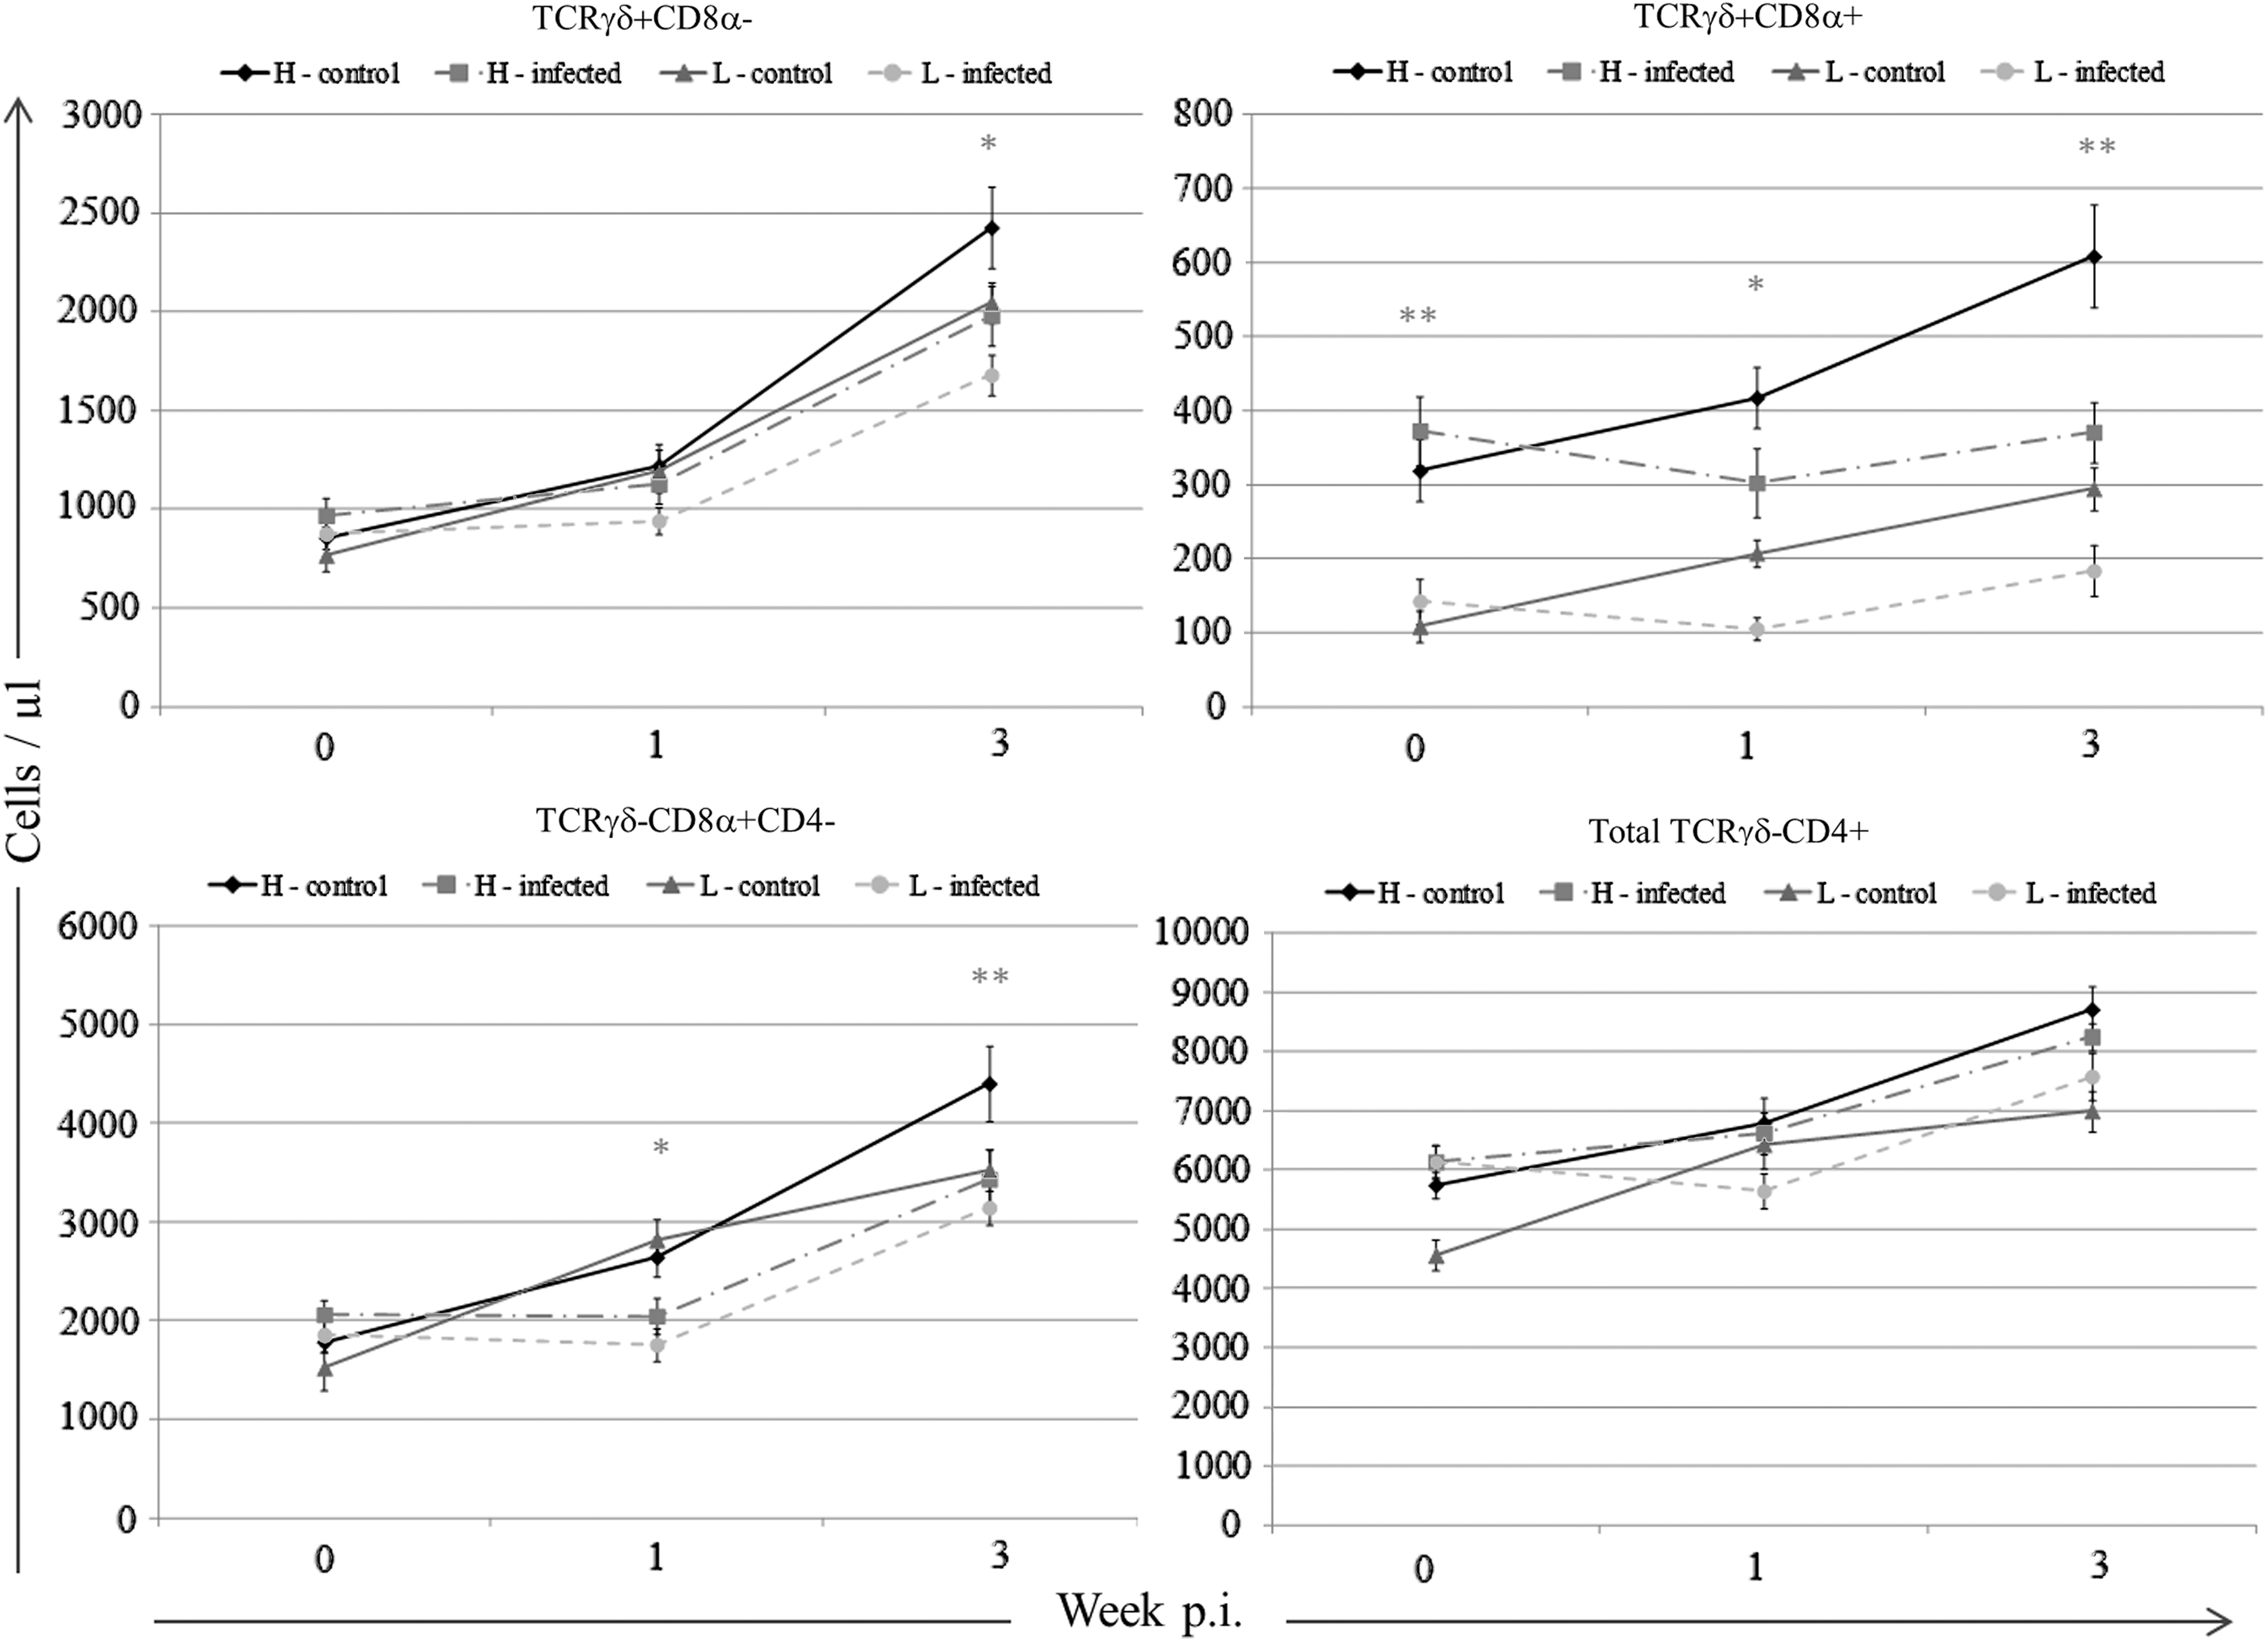
Effect of sublines and treatments on T-cell subsets from 0 to 21 p.i. Staining and gating of cell populations were performed according to Figure 5A. The absolute counts of TCRγδ+ cells are shown in the upper panel. The absolute counts of TCRγδ+CD8α− cells are shown in the left column, and the absolute counts of TCRγδ+CD8α+ cells are shown in the right column. The absolute counts of TCRγδ −cells are shown in the lower panel. The absolute counts of TCRγδ−CD8+CD4− cells are shown in the left column, and the absolute counts of total TCRγδ−CD4+ cells are shown in the right column. H or L indicates the sublines with high or low MBL serum concentrations, respectively. Results are shown as mean±SEM (n=8). The single asterisks indicate statistically significant differences (p<0.05) between the groups. The double asterisks indicate statistically significant differences (p<0.01) between the groups.
The comparison of counts for TCRγδ +cells between treatment groups and sublines (L10H and L10L) is presented in the upper panels in Figure 6. The numbers of TCRγδ+CD8− cells were the same for all groups at week 0 p.i. after which an increase was seen for all the four groups. However, the increase was less pronounced for the noninfected L10L chickens compared to the noninfected L10H chickens (p<0.03). Furthermore, the infection seemed to influence the number of TCRγδ+CD8− cells since the infected L10H and L10L chickens had less TCRγδ+CD8− cells than their corresponding noninfected subline (p<0.01). The numbers of TCRγδ+CD8+ cells differed between L10H and L10L chickens already at week 0 p.i. corresponding to 3 weeks of age. A similar increase in the number of cells was observed for the noninfected L10H and L10L chickens from week 0 to 3 p.i. (p<0.01), whereas the number of cells remained the same for the infected L10H and L10L chickens throughout the experiment resulting in a significant difference between the infected and the noninfected L10H chickens (p<0.01), whereas no significant difference was observed between the infected and the noninfected L10L chickens (p<0.0593).
The comparison of counts for TCRγδ −cells between treatment groups and sublines (L10H and L10L) is presented in the lower panels in Figure 6. The numbers of TCRγδ−CD8α+CD4− cells were the same for all groups at week 0 p.i. after which an increase was seen for the noninfected chickens. At week 3 p.i., the numbers of TCRγδ−CD8α+CD4− cells were significantly higher in the noninfected L10H chickens than in the noninfected L10L chickens (p<0.01). The numbers of TCRγδ−CD8α+CD4− cells in the infected chickens did not increase until after week 1 p.i. and did not reach the same level as the corresponding noninfected subline (p<0.01 at week 3 p.i.). The numbers of total TCRγδ−CD4+ cells increased during the experiment for all groups, and a significant difference was observed between noninfected L10H and L10L chickens at weeks 0 and 3 p.i. However, no differences were observed between noninfected and infected chickens within corresponding sublines.
The numbers of B cells and monocytes in whole peripheral blood at week 3 p.i. were identified as shown in Figure 5B. Results are shown in Table 2. The numbers of B cells were significantly higher for noninfected L10L chickens than for the other chickens (p<0.01). No significant differences were observed between the infected and noninfected L10H chickens or between the infected L10H and L10L chickens. The numbers of monocytes were significantly higher for L10H chickens than for L10L chickens (p<0.03), but no significant differences were observed for the numbers of monocytes between noninfected and infected L10H chickens. However, a tendency (p=0.08) for a difference was observed between the number of monocytes in noninfected and infected L10L chickens.
Staining and gating of cell populations were performed according to Figure 5B. Results are shown as mean±SEM (n=8). Single asterisk indicates that parameters marked with the letters a and b within rows are statistically significantly different (p<0.01). Double asterisks indicate that parameters marked with the letters a and b within rows are statistically significantly different (p<0.03).
Discussion
The main purpose of this study was to characterize cellular and humoral immune responses after IBV infection in the two chicken lines, L10H and L10L, varying in MBL serum concentrations. This was done to gain a better understanding of how MBL influences the course of an IBV infection.
Following an IBV infection, the presence of viral genomes was observed in the trachea of all the infected chickens. The viral load was higher in L10L chickens than in L10H chickens at day 3 p.i. (Fig. 1) as previously observed for an IBV vaccine virus (36). This indicates that the chickens with high MBL serum concentrations may be less severely affected by the infection. In the present study, the viral load peaks at day 3, which is inconsistent with the finding of other studies that the amount of viral genomes in the tracheal swabs peaked at day 5 p.i. regardless of the virus dose given (8,33). This difference may be explained by the different age of the chickens, infection routes, and the use of different IBV strains.
As in resemblance to previous results (32,33), an increase was observed for MBL serum concentrations after the IBV infection followed by a decrease to below the baseline level for both L10H and L10L chickens (Fig. 2). However, in the previous studies (32,33), the decrease in the MBL serum concentration in L10H chickens after day 3 p.i. was less pronounced as the decrease observed in the present study where the MBL serum concentration in L10H chickens reached the level of the L10L baseline at day 7 p.i. Thus, when determining the baseline of MBL serum concentrations in chickens, it is importance to know the immune status of the chickens or else the MBL serum concentrations may be misguiding if the measurements are performed during an immunosuppressed period by either infection or vaccination.
To the best of our knowledge, the current study is the first to show by real-time RT-PCR that MBL is expressed in the chicken lung as well as to show an increased MBL expression in the chicken lung after infection (Fig. 3). At day 3 p.i., a tendency for an increase of the MBL expression was observed in the lungs of infected L10H chickens. MBL mRNA expression has previously been detected in the trachea–larynx, abdominal air sac, infundibulum, and thymus of healthy chickens (25) but not in the lungs of healthy chicks as the current study shows. This inconsistence may be a result of different sampling location within the lung. A low expression of the pig MBL1 has also been detected in the lungs of healthy pigs (50). Furthermore, MBL expression has been observed in mouse macrophages during atherosclerosis (41) and in the human monocytic cell line THP-1 after LPS stimulation (54). Thus, the increased MBL expression observed in the lungs in the current study may be caused by an increased MBL expression in the macrophages in the lungs since no separation of cells in the lung tissues was made before RNA extraction in the current study. The highest MBL expression in the present study was observed in the lungs of infected chickens at day 3 p.i., which is consistent with the viral load being highest at day 3 p.i. However, the climaxing of viral load in the trachea and lung may not necessary be the same at the same time point since Asasi et al. (2) found that the amount of viral genomes in the lungs of IBV-infected chickens was higher at day 7 p.i. compared to day 3 p.i. The tendency of increased MBL expression during infection in the lungs found in the current study suggests that MBL may play a role locally after an IBV infection.
In the liver of the infected L10H chickens, a significant increase in MBL fold change was observed at day 3 p.i. for the L10L chickens but not for the L10H chickens. The nonobserved increase in MBL fold change for infected L10H chickens is in disagreement with the elevated MBL serum concentrations observed at the same day. However, a significant increase in the MBL fold change was observed for infected chickens at day 7 p.i. for both sublines (p<0.01). This is inconsistent with the low MBL serum concentration observed at day 7 p.i. and questions the suggestion by Juul-Madsen et al. (33) that the decrease in the MBL serum concentration after an IBV infection to below the baseline level may be due to a negative feedback mechanism occurring at the MBL transcriptional level. However, it supports the other theories suggested by Juul-Madsen et al. that MBL may be transferred from the blood to infected tissues or that MBL has been used for opsonization and thus engulfed by phagocytic cells.
The present study confirms the results by Hogenkamp et al. (25) that low MBL expression is found in the larynx. However, the results vary and some uncertainty is attached to the results since no separation of cells in the larynx was made before RNA extraction in the current study as mentioned above for the lung. Based on this, it is unfeasible to make final assumptions about MBL expression in the larynx during IBV infection.
Previous studies have shown a negative correlation between the MBL serum concentration and the ability to produce pathogen-specific antibodies after an infection (32,52). However, in the current study and in the study by Juul-Madsen et al. (33), no differences were found between the IBV-specific antibody in the infected nonvaccinated L10H and L10L chickens. In both cases, this may be explained by the use of different IBV doses and different ages of the chickens, as the chickens in the 2007 study were 3 weeks older when challenged than the chickens in the current study.
Flow cytometry was used to identify immunophenotypic differences between the infected and the noninfected chicken sublines. Phenotyping of four circulation T-cell populations, TCRγδ+CD8α+ and TCRγδ+CD8α− cells as well as TCRγδ−CD4−CD8α+ and total TCRγδ−CD4+ cells, were performed during the present experiment (Fig. 6). The function of chicken γδ T cells is still not identified in detail, but studies have indicated that γδ T cells respond to pathogens and provide a protective immune response after immunization with both live-attenuated and nonattenuated Salmonella strains (5). Besides, γδ T cells may contribute with up to 60% of the circulating T cells in a healthy adult chickens (17) supporting the hypothesis that they play an important role in the chicken immune system. In the current study, the numbers of TCRγδ+CD8α− cells differed between L10H and L10L and both infected L10H and L10L chickens had lower number of TCRγδ+CD8α− cells than the corresponding noninfected chicken line. Thus, the infection resulted in the same kinetics in L10H and L10L. The infected resulted in the same kinetics for the TCRγδ+CD8α+ cells in L10H and L10L chickens, but overall, L10L chickens had significantly lower numbers of TCRγδ+CD8α+ cells than L10H chickens. Hence, there was no line effect but only an effect of the infection. The absence of an increased number of TCRγδ+CD8α+ cells in the blood may indicate that the cells have migrated from the blood to the infected tissues or to the germinal centers to support the B cells in mounting a germinal center response, as seen for mice lacking αβ T cells (62). Hence, further studies should include the examination of the presence of T-cell subsets in infected tissues to verify this argument.
TCRγδ−CD8α+CD4− cells are mostly cytotoxic T lymphocytes (CTL) and have been shown to be crucial for the elimination of the virus from local infection sites (14,21,33). In the current study, an increase in the number of TCRγδ−CD8α+CD4− cells in infected chickens was first observed after week 1 p.i., but not at the level seen in noninfected chickens. This indicates that IBV affects the number of TCRγδ−CD8α+CD4− cells during infection.
The number of B cells was higher in noninfected L10L chickens than in noninfected L10H chickens (Table 2), contradicting the suggestion from a previous study that the difference observed in the number of B cells between vaccinated L10H and L10L chickens could be caused by the given vaccine (36). This age difference in the number of B cells has also been observed to develop in chickens under conventional growing conditions as no difference was observed at the time of hatching (34).
Both infected and noninfected L10H chickens had a higher number of monocytes than infected and noninfected L10L chickens (Table 2). Monocytes migrate into the infected tissues and differentiate into phagocytic macrophages. Hence, the high number of monocytes in combination with a higher MBL level may be beneficial during infection since another study has shown that MBL has the ability to opsonize virus for uptake in the human monocytic THP cells. This indicates that MBL may amplify the clearance of the virus in vivo and mediate the uptake by macrophages in the tissues (60).
In conclusion, chickens with low MBL serum concentrations had a higher viral load in the trachea than chickens with high MBL serum concentrations. Following an IBV infection, the MBL serum concentrations increase and subsequently decrease to below basic level. This decrease is not caused be a negative regulation at the MBL transcription level since an upregulation of the MBL expression was observed in the liver in infected L10H and L10L chickens at day 7 p.i. Furthermore, this study shows that the MBL expression is present in the lungs of healthy chickens and that the expression is upregulated after an IBV infection. The MBL serum level has no influence on the IBV-specific Ig titer after IBV infection despite the difference in the amount of B cells between L10H and L10L chickens. The number of TCRγδ+CD8α+ cells differed between both noninfected and infected L10H and L10L chickens. These cells may play a role in the immune response after an IBV infection since the number of TCRγδ+CD8α+ cells was higher in the infected L10H chickens than in the L10L chickens. The number of monocytes was also higher in L10H chickens than in L10L chickens, which may have influenced the decreased viral load in the trachea. Thus, these results indicate that MBL is produced locally and may be involved in the regulation of the cellular immune response after an IBV infection. However, MBL did not appear to influence the humoral immune response after an IBV infection in the current study.
Footnotes
Acknowledgments
The authors thank L.R. Dal and H. Handll for technical assistance and K.V. Østergaard for critical reading of the article. The research leading to these results has received funding from the Graduate School of Science and Technology at the Aarhus University and from the project “Development of genetic selection technology for polyvalent resistance to infectious diseases” (POLY-REID) (grant number 10-093534) granted by Danish Council for Strategic Research, Danish Poultry Council, The Hatchery Hellevad, and Cobb-Vantress.
Author Disclosure Statement
No competing financial interests exist.
References
Supplementary Material
Please find the following supplemental material available below.
For Open Access articles published under a Creative Commons License, all supplemental material carries the same license as the article it is associated with.
For non-Open Access articles published, all supplemental material carries a non-exclusive license, and permission requests for re-use of supplemental material or any part of supplemental material shall be sent directly to the copyright owner as specified in the copyright notice associated with the article.