




Abstract
Marek's disease virus (MDV), a highly cell-associated oncogenic α-herpesvirus, is the causative agent of T cell lymphoma and neuropathic disease called Marek's disease. The skin is the only anatomical site where infectious enveloped cell-free virions are produced and shed into the environment. Studies have demonstrated that MDV infection induces immunological responses within the skin, including the release of cytokines and the recruitment of T lymphocytes. The host immune response, however, is not sufficient to block replication and shedding of the virus particles from the skin. In this study, we examined the gene expression profiling in the skin tissues of MDV-infected chickens to identify viral-induced alterations in the host gene expression pattern. To identify these genes in an unbiased and comprehensive manner, we performed RNA-seq on skin samples of MDV-infected chickens at 10, 20, and 30 days postinfection (dpi). We identified 820, 1,333, and 1,571 upregulated genes in the skin of MDV-infected chickens at 10, 20, and 30 dpi, respectively. In addition, we identified 461, 878, and 1,751 downregulated genes corresponding to the same time points, respectively. Analysis of the upregulated genes resulted in the identification of multiple gene ontology (GO) categories, with most falling under the host immune response. Searching these immune related GO categories, we identified six genes, gga-let-7d, interleukin 22 receptor subunit alpha 2, tumor necrosis factor receptor superfamily member 21, Proline-serine-threonine phosphatase-interacting protein 2, Suppressor of cytokine signaling (SOCS)1, and SOCS3, with known immunosuppressive properties that are upregulated in the skin of MDV-infected chickens.
Introduction
M
Currently little is known about the host immune responses to MDV infection in the skin. Previous studies have demonstrated that MDV infection in vivo induces immunological responses within the FFE characterized by increases in the expression of interferon (IFN)-γ and infiltration of CD4+/CD8+ T lymphocytes and CD8+ cytotoxic T lymphocytes peaking between 7 and 14 dpi (1). The host immune responses, however, are not adequate to block viral replication and shedding in the FFE (4,19). Although MDV vaccination prevents lymphoma formation and induces a significant reduction in virus replication in the FFE, it does not induce sterile immunity, and consequently, infectious virus particles remain in the host and are released into the environment to infect other birds (3,8,15,22,43). We hypothesized that the inability of the host to effectively block MDV replication, virion formation, and shedding in FFE is due to alterations in the expression of host immune related genes. To test this hypothesis in an unbiased and comprehensive manner, we performed RNA-seq on the skin tissue samples of MDV-infected susceptible birds at 10, 20, and 30 days after infection. Gene expression profiling in the skin of MDV-infected chickens is presented in this article, and MDV gene expression analysis is ongoing and will be prepared as a separate document at a later date.
Materials and Methods
Experimental chickens
The specific pathogen-free chickens in this study were from the highly inbred MD-susceptible line 72 (2). These birds were from unvaccinated breeder hens and carried no maternal antibodies to MDV or herpesvirus of turkeys and were not vaccinated posthatch. The chicks were hatched at the Avian Disease and Oncology Laboratory (ADOL) poultry facility and housed in modified Horsfall-Bauer isolation units for the duration of the experiment. All animal experiments were approved and carried out in accordance to the guidelines set forth by the ADOL Institutional Animal Care and Use Committee and the Guidelines for Care and Use of Laboratory Animals published by Institute for Laboratory Animal Research (ILAR Guide) in 1996. a
Virus
A very virulent BAC-cloned strain of MDV, rMd5, which is propagated and maintained at ADOL, was used in this experiment (30).
RNA isolation
Total RNA was isolated from the homogenized skin tissues of four birds of each group (see section “Experimental design”) at 10, 20, and 30 dpi using TRI Reagent RT (Molecular Research Center, Cincinnati, OH) according to the manufacturer's instructions. The RNA samples isolated from each individual bird were processed and analyzed separately and were not pooled (four biological replications). The feathers from collected skin samples were clipped at the base with tips remaining in the skin.
RNA sequencing
RNA sequencing was performed at the Research Technology and Support Facility (RTSF) of Michigan State University in East Lansing, Michigan. All standard libraries were created using Illumina TruSeq Stranded mRNA Kit and reagents following the manufacturer's protocols. In brief, polyA mRNA was isolated from 1 μg total RNA, chemically fragmented, and then reverse transcribed to form double-stranded cDNA. The cDNA was then end repaired, A-tailed, adapter ligated, and amplified to create the final library. All libraries were then quantified on a Qubit Fluorometer (Life Technologies, Carlsbad, CA), and an Agilent BioAnalyzer was used to determine final size distribution and purity of the library. Final concentration was then determined by quantitative polymerase chain reaction (qPCR) using the KAPA Illumina Library Quantification Kit (KAPA Biosystems, Wilmington, MA). Libraries were appropriately diluted and loaded onto the flow cell for sequencing on the Illumina HiSeq2500 following the manufacturer's protocols.
Real-time PCR
cDNA synthesis was produced from 4 μg RNA samples from each of the individual chickens separately using SuperScript III First-Strand Synthesis System for Reverse Transcriptase PCR (Invitrogen, Carlsbad, CA) following the manufacturer's directions. Real-Time PCR reactions were performed in triplicate with Power SYBR Green PCR Master Mix (Applied Biosystems, Foster City, CA) following the manufacturer's directions and using 100 ng of cDNA and 0.5 μM each of forward and reverse primers per reaction. Real-time PCR analysis of relative quantification of gene expression was performed at the RTSF. The amplification program was as follows: 50°C for 2 min, 95°C for 10 min, 40 cycles at 95°C for 15 sec, and followed by 57°C for 1 min. All of the reactions were run in triplicate in a 7900HT Sequence Detection System (Thermo Fisher Scientific, Grand Island, NY). The primers for chicken genes were designed using Primer-BLAST (NIH, Bethesda, MD). All the primers were synthesized by Eurofins MWG Operon LLC (Huntsville, AL). The primer sequences are listed in Table 1. Relative quantification of the chicken genes was determined using 2−ΔΔCT method (25). The levels of gene expression in the skin tissues of age-matched control birds were used as a reference or baseline for calculation of fold changes in gene expression in MDV-inoculated chickens. The expression of each gene was normalized to the expression level of the housekeeping genes, β-actin or GAPDH.
CD3E, CD3 antigen, epsilon polypeptide; TNFSF13B, tumor necrosis factor superfamily member 13b; PAH, phenylalanine hydroxylase; SCD, stearoyl-CoA desaturase; TNNC1, Troponin C type 1.
Bioinformatics analysis
The obtained Illumina reads were trimmed using CLC Genomics Workbench version 8.0 (CLC Bio, Cambridge, MA) using the trim sequences algorithm (Parameters: Minimum base pairs 75, Quality limit 0.05, Ambiguity limit 2, Adapter screen yes). Trimmed reads were then used in a batch RNA-seq experiment using CLC Genomics Workbench version 8.0.2 (CLC Bio) to the Gallus gallus reference genome, Galgal4 (GCA_000002315.2) (Parameters: Similarity 0.8; Length fraction 0.8; Insertion cost 3; Deletion cost 3; Mismatch cost 2). The generated RNA-seq mapping resulted in per library reads per kilobase per million (RPKM) and read counts for the genes in the reference genome.
Differential expression was determined using the numbers of mapped reads overlapped with annotated Gallus gallus genes as inputs to EdgeR (32), using the empirical analysis of the DGE algorithm in CLC Genomics Workbench version 8.0.3 (CLC Bio) with default parameters. Association of the genes with gene products, Gene ontology (GO) terms, and associated annotation information was done with the Gene Association file downloaded from UniProt (gene_association.goa_chicken), using the add annotations algorithm from CLC Genomics Workbench version 8.0.3 (CLC Bio). Genes were regarded as differentially expressed if they had twofold or greater change between samples and 5% or less false discovery rate.
Genomic DNA isolation
Genomic DNA was isolated using the Gentra Puregene Kit (Qiagen, Hilden, Germany) following manufacturer's directions. Briefly, sections of skin tissue stored in RNAlater (Thermo Fisher Scientific) were washed in phosphate-buffered saline and blot-dried. Approximately 100 mg of dried skin tissue was homogenized and mixed with 400 μL of cell lysis solution with Proteinase K (100 μg/μL, final concentration). Tissue lysates were incubated overnight in a shaking heat block at 60°C and 900 rpm. The next day tissue lysates were incubated with RNase A for 30 min at 37°C followed by the addition of protein precipitation solution and centrifugation. Supernatants were transferred to a clean microcentrifuge tube to which 400 μL isopropanol was added. Samples were inverted and centrifuged again, and the resultant DNA pellet was washed in 70% ethanol and air-dried. DNA pellets were rehydrated in TE buffer. To guard against possible lipid contamination, all DNA solutions were mixed with chloroform:isoamyl alcohol, centrifuged, and the aqueous layer was removed for further analysis. DNA concentrations of samples were quantified using a NanoDrop 8000 (Thermo Fisher Scientific).
MDV genome copy number assay
Quantitative real-time PCR (qPCR) for MDV genome copy number was performed as previously described (9). Testing of genomic DNA from each skin sample was performed in triplicate on a single 96-well plate. qPCR assays were performed with a 7500 Real-Time PCR System (Applied Biosystems). Primers to MDV gB and chicken GAPDH were each used at 0.5 μM to amplify their respective genes. Probes to MDV gB and chicken GAPDH were used at 0.2 μM. MDV loads were shown as the copy number of MDV gB divided by the copy number chicken GAPDH. Statistical analysis was performed with the aid of GraphPad software (GraphPad, La Jolla, CA) using an unpaired t-test.
GO and pathway enrichment of differentially expressed genes
Differentially expressed genes were analyzed at 10, 20, and 30 dpi and were broken into either up- or downregulated gene lists and analyzed separately. GO classifications were utilized to ascribe functions to individual genes for molecular function and biological process using The Protein Analysis Through Evolutionary Relationships (PANTHER) Classification System version 10 with the default settings for the database (26). The Database for Annotation, Visualization and Integrated Discovery (DAVID) v6.7 was used to define biological pathways and processes using the Functional Annotation Cluster using the default settings in the database (14).
Experimental design
One-day-old chicks of Line 72 were randomly distributed into two groups of 17 each in separate isolators. Birds from one group were inoculated intraperitoneally with 2,000 plaque-forming unit (pfu) of rMd5 at 12 days posthatch. The second group served as the uninoculated negative control. Seventeen birds were designated per group to ensure the desired replicate number (4) per sample interval, as some mortality is expected posthatch and/or from MDV-induced complications. At 10, 20, and 30 dpi, four birds from each group were euthanized by CO2 inhalation and necropsied for tissue collection. Skin tissues with clipped feathers were stored in RNAlater (Thermo Fisher Scientific) to prevent RNA degradation. Samples were kept at −20°C until used for RNA isolation and gene expression profiling.
Results
MDV genome load in the skin of MDV-infected chickens
The skin is the site of the productive cytolytic phase of the MDV life cycle and, thus, the source of cell-free infectious viral particles (8,29,42). To confirm the MDV status of our samples, we isolated DNA from skin samples of uninfected control and MDV-infected chickens at 10, 20, and 30 dpi. We performed qPCR on these samples using primers specific to MDV gB and host GAPDH to determine relative viral genome copy number in the skin of these chickens. The uninfected controls did not have any detectable viral DNA, while the infected chickens had significant numbers of MDV genome for each time point postinfection (Fig. 1).

MDV genome copy number from the skin of MDV-infected and uninfected control chickens. Quantitative real-time polymerase chain reaction analysis for MDV genome copy number was performed on DNA isolated from skin tissue samples of infected and uninfected birds. Chickens were infected at 12 days posthatch and skin samples harvested at the indicated time points. Probes corresponding to MDV gB and host GAPDH were used to quantify each gene. Each result is representative of four chickens that were individually evaluated. Viral loads were conveyed as the copy number of MDV gB divided by that of the host GAPDH. Statistical analysis was performed using an unpaired t-test and all data points had a p-value <0.05. MDV, Marek's disease virus.
Summary of the RNA-seq data set
We performed RNA-seq analysis to identify differentially regulated host genes that may be involved in the immune response of the skin to the replicating MDV. We divided the birds into two groups and infected half with MDV strain rMd5 at 2,000 pfu and then collected skin samples from four biological replicates per treatment group at 10, 20, and 30 dpi. We then isolated RNA from each individual skin sample for independent sequencing. We used high-throughput sequencing to generate 19,435,174 to 66,996,560 raw reads per sample. We then mapped between 88% and 90% of the total reads from each sample to the chicken reference genome using CLC Genomics Workbench version 8.0 software. Of these mapped reads, 57–67% were uniquely mapped to a gene (Table 2). We detected 12,099 genes at 10 dpi, 12,654 genes at 20 dpi, and 12,018 genes at 30 dpi. We then compared these genes to uninfected control to identify differentially expressed genes (fold change ≥2 or ≤2) resulting in 820 upregulated and 461 downregulated genes, 1,333 upregulated and 878 downregulated genes, and 1,571 upregulated and 1,751 downregulated genes at 10, 20, and 30 dpi, respectively (Table 2). Using the Venn Diagram Generator software,
b
we searched for genes that were either up- or downregulated across multiple time points. We identified 301 genes upregulated across all three time points, 49 genes upregulated between 10 and 20 dpi, 78 genes upregulated between 10 and 30 dpi, while 513 genes were upregulated between 20 and 30 dpi (Fig. 2a). Results for differentially downregulated genes identified 51 genes shared across all three time points, 46 genes between 10 and 20 dpi, 73 genes between 20 and 30 dpi, while 414 genes were downregulated between 20 and 30 dpi (Fig. 2b). List of all the genes differentially regulated across multiple time points can be found in Supplementary Tables S1–S3 (Supplementary Data are available online at
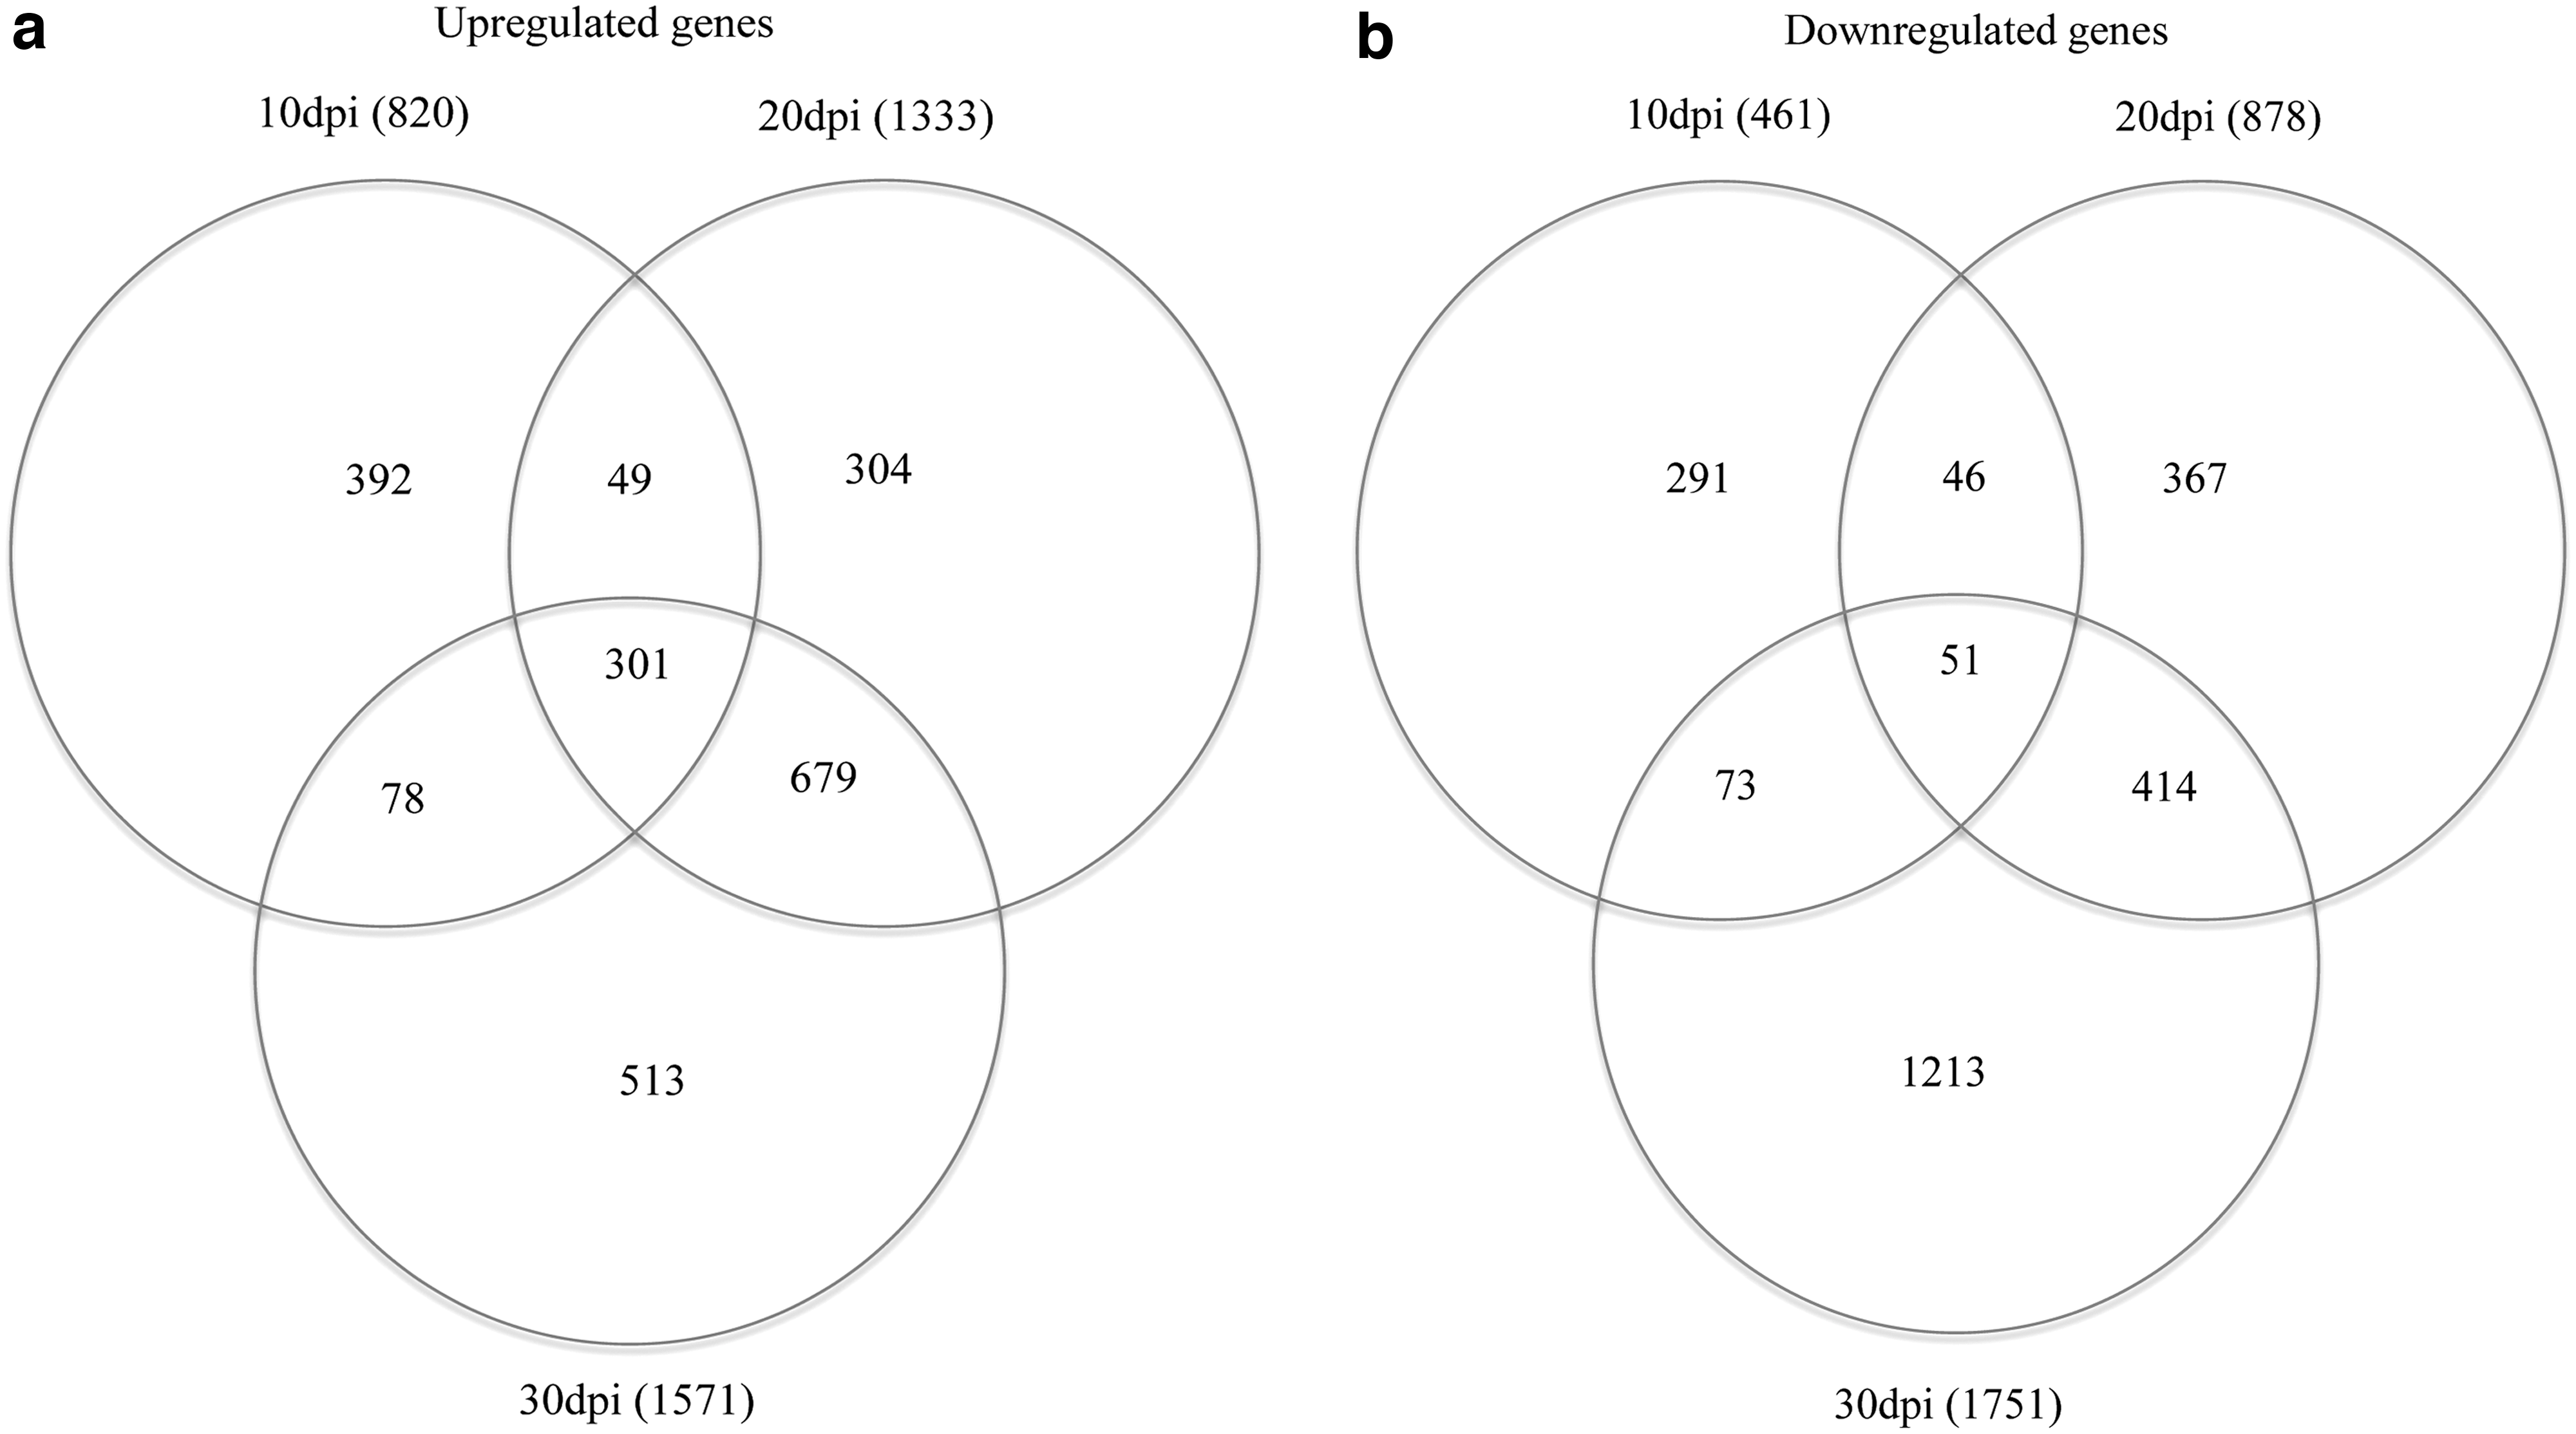
Shared differentially expressed genes between time points. Lists of upregulated
dpi, days postinfection.
p-value ≤0.05.
Functional analysis of immune response genes within the infected skin
We next sought to form a comprehensive view of the host biological processes and pathways altered by MDV infection of the skin. For each time point, a list of either up- or downregulated genes was independently analyzed using multiple online databases. We first analyzed the differentially expressed genes using PANTHER Classification System to categorize these genes according to biological processes (Table 4) and molecular function (Table 5) (26). Generally, the biological processes and molecular functions that were upregulated during viral infection of the skin were associated with immune responses and cell death, while downregulated categories were mostly of basal or general cellular functions.
Fold change ≥2.0, p-value ≤0.05.
Fold change ≥2.0, p-value ≤0.05.
Several biological processes were significantly enriched in our differentially expressed genes. Upregulated genes at 10 dpi were enriched for biological processes of the immune system such as antigen processing, macrophage activation, and immune response. At 20 and 30 dpi, the biological processes enriched in upregulated genes included hemopoiesis, apoptosis, and immune response. Enrichment for downregulated biological process occurred mainly at 30 dpi and mostly fell under the category of tissue development. We identified multiple molecular functions relevant to host immune responses to be significantly enriched in the differentially expressed genes. Of interest, the upregulated genes were significantly enriched for chemokine activity at 10 dpi and tumor necrosis factor-activated receptor activity and cytokine receptor activity at 20 dpi. At 30 dpi, upregulated molecular functions included cytokine receptor activity, cytokine activity, and receptor activity, while downregulated molecular function included receptor binding (Table 5).
Given that we identified multiple immune, chemokine, and cytokine categories, we sought to identify cell pathway related host immune response that was enriched in the skin of infected chickens. To achieve this, we used the DAVID functional annotation chart to identify Kyoto Encyclopedia of Genes and Genomes (KEGG) pathways that are overrepresented in our differentially expressed genes (18). Pathways that were upregulated across all three times were cell adhesion molecules and cytokine–cytokine receptor interaction. In addition, both 10 and 20 dpi were enriched for intestinal immune network for immunoglobulin A production, while 10 and 30 dpi were enriched for the Toll-like receptor signaling pathway. Other noteworthy upregulated pathways included JAK-STAT and the p53 signaling pathway at 20 dpi and apoptosis and natural killer cell-mediated cytotoxicity at 30 dpi. Downregulated pathways included peroxisome proliferator-activated receptor signaling at 10 dpi and the Hedgehog and Wnt signaling pathway at 30 dpi.
Differentially expressed immune response related genes of the skin
The skin of infected birds plays a unique and vital role in the MDV life cycle as it is the only tissue where MDV is able to produce infectious enveloped virions (8,29,42). We sought to identify differentially expressed genes that may alter host immune response of the skin, thus possibly aid in ability of the skin to permit viral replication and virion production. Previous reports using microarrays of spleen and thymus tissues have identified immune response related genes that are differentially regulated between MD-susceptible (72) and MD-resistant (63) chicken lines after infection with MDV. These genes have been proposed by others to contribute to MD susceptibility and the viral life cycle (36). We cross-referenced these proposed candidate genes for MD susceptibility with our list of differentially expressed genes of the skin. This led to the identification of four candidate suitability genes, ART1, IRG1, Mx1, and SOCS1 in our data (Fig. 3a). As was previously reported for thymus and spleen tissues, we found these genes to be upregulated in the skin of MD-susceptible chickens infected with MDV.
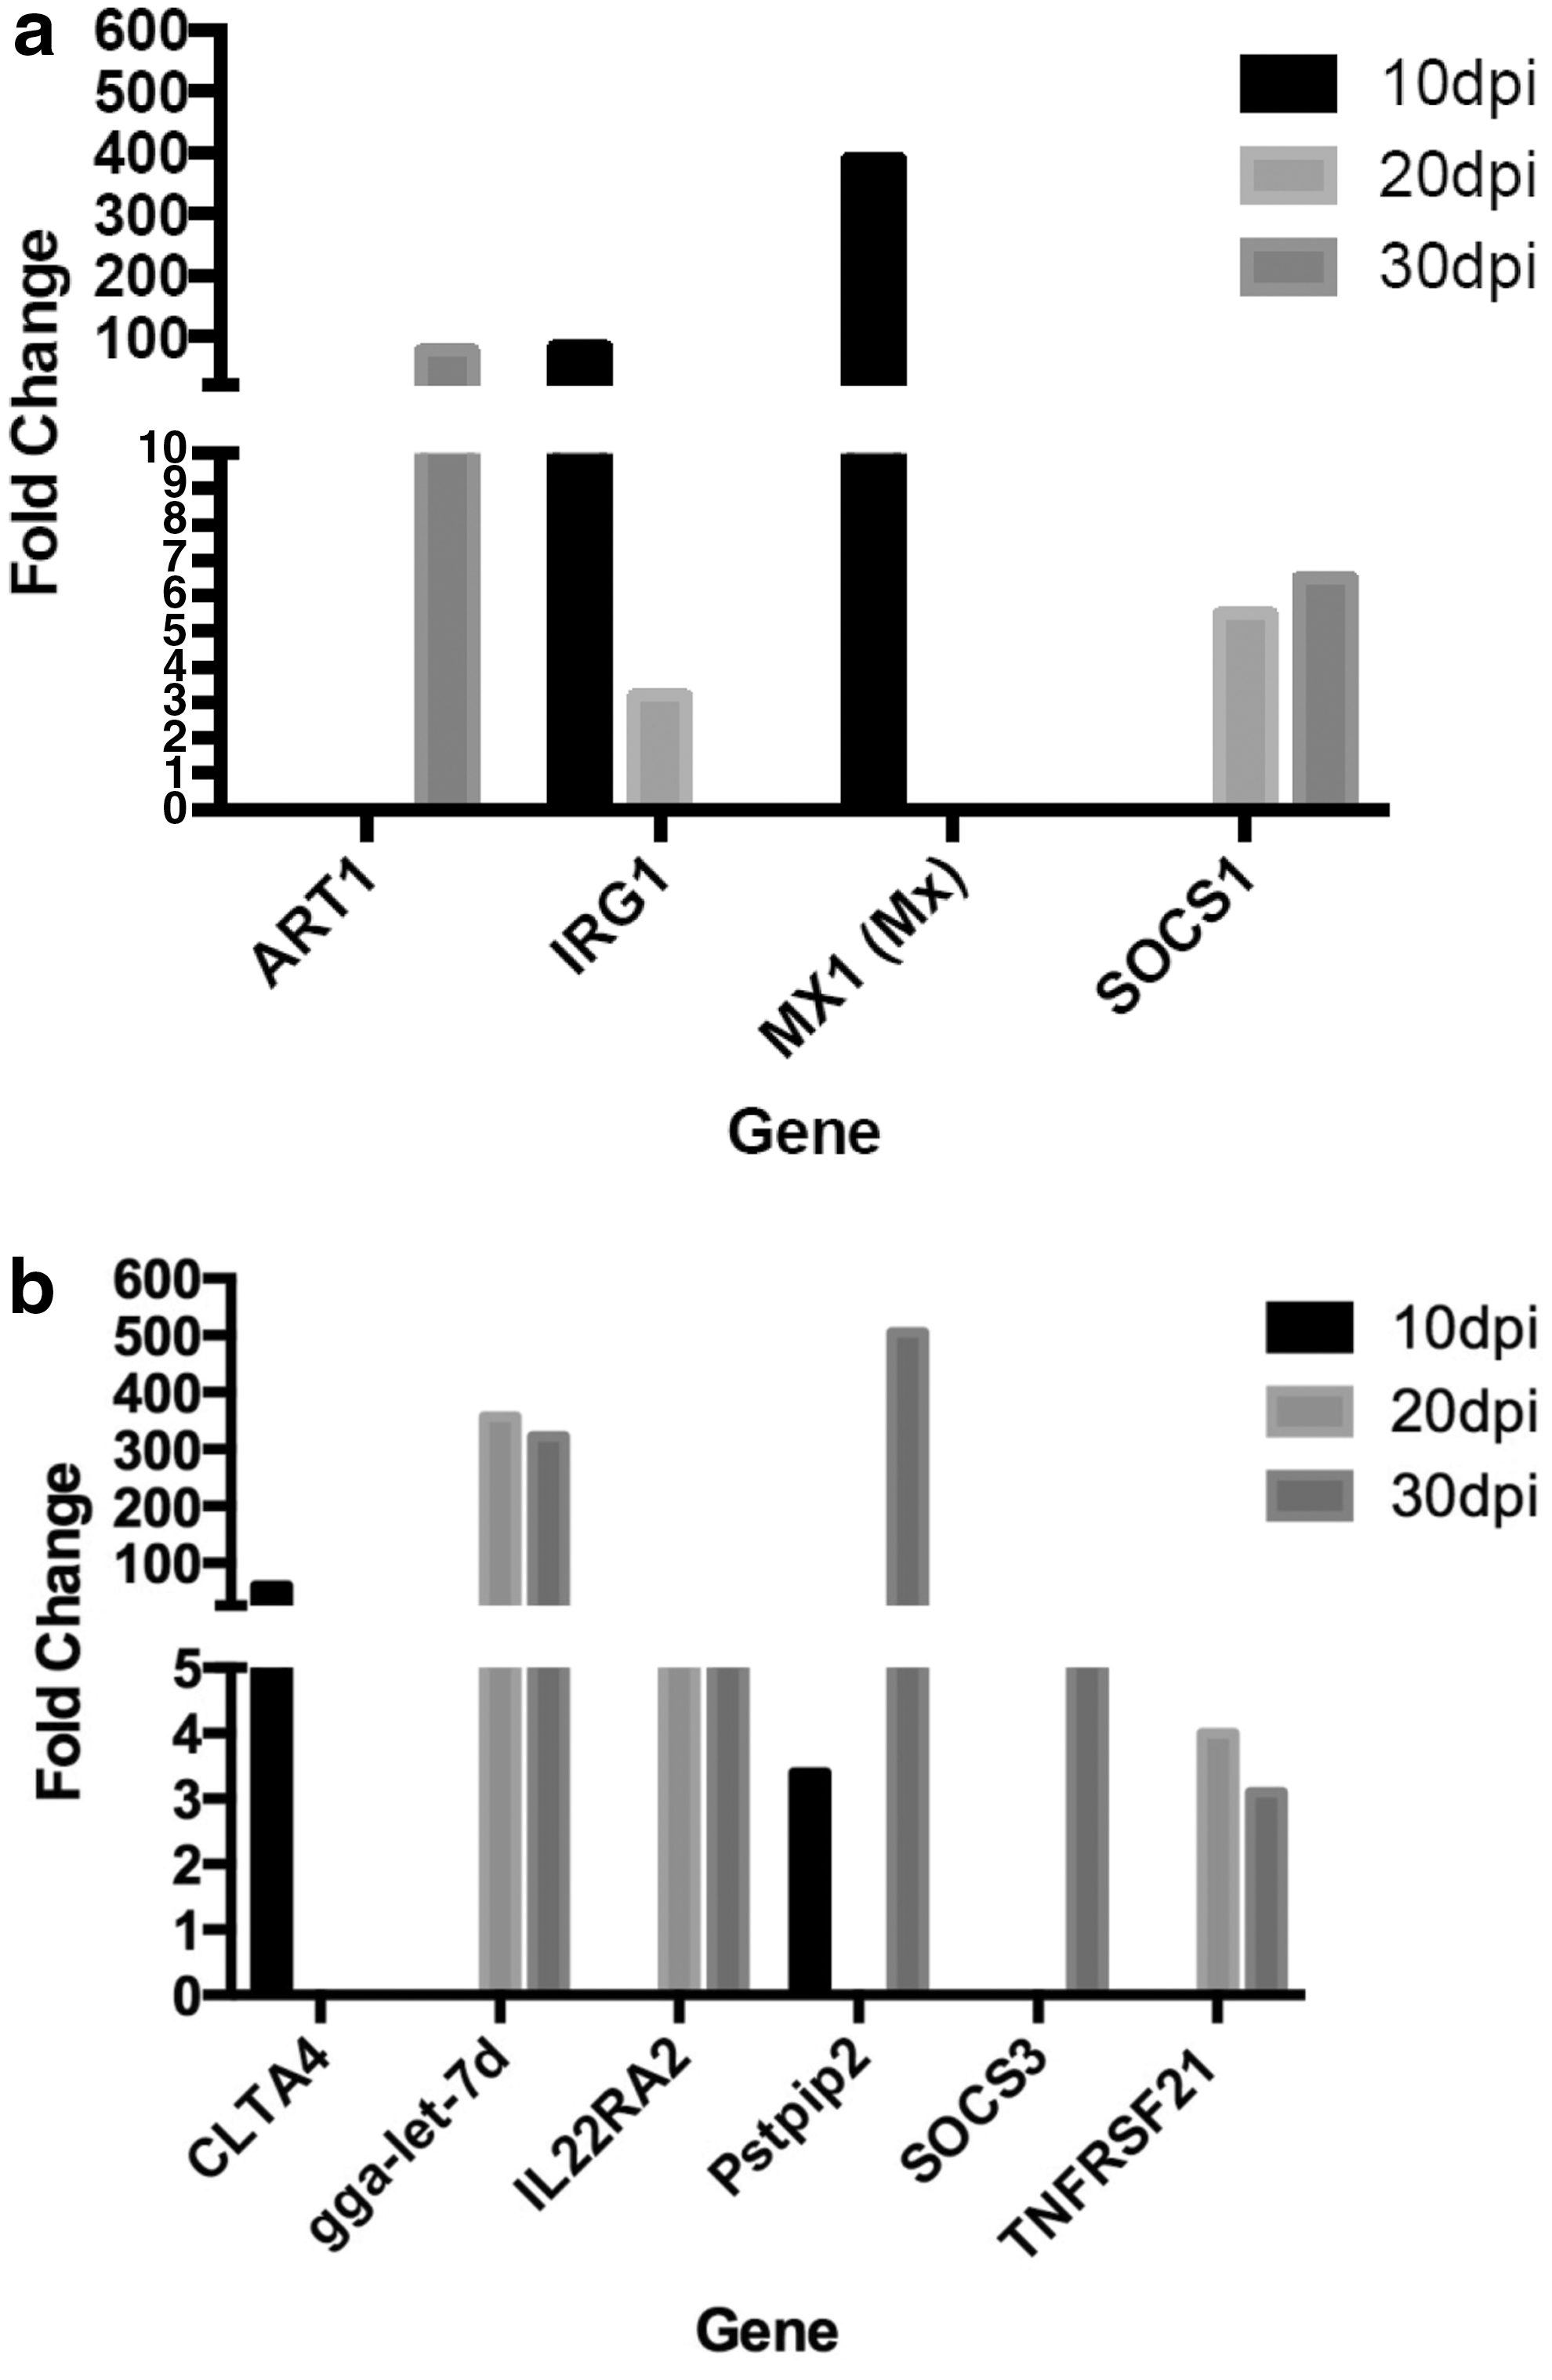
Fold induction of differentially expressed genes for MD susceptibility or genes having known immunosuppressive functions in the skin of MDV-infected chickens. RNA-seq was performed on skin of MDV-infected and uninfected controls.
We next sought to identify additional candidate genes whose differential expression may compromise host immune response in the skin tissue. We first searched the GO molecular function and GO biological process categories that related to immune response for candidate genes. Then, for each gene in these categories, we performed a literature search for its known function. In addition, we researched the function of genes that were in the top 10 up- or downregulated for a given day and those that were differentially regulated across multiple time points. Cytotoxic T-lymphocyte-associated protein 4 was upregulated 60-folds compared to uninfected controls at 10 dpi and is known to inhibit T cell activation (40). Upregulated genes at both 20 and 30 dpi included gga-let-7d, interleukin 22 receptor subunit alpha 2 (IL22RA2), and tumor necrosis factor receptor superfamily member 21 (TNFRSF21). gga-let-7d, a microRNA, was upregulated 357-fold at 20 dpi and 322-fold at 30 dpi. IL22RA2 is upregulated 16-fold at 20 dpi and 12-fold at 30 dpi. TNFRSF21 is upregulated fourfold at 20 dpi and threefold at 30 dpi. Proline-serine-threonine phosphatase-interacting protein 2 (Pstpip2) limits macrophage expansion and response to stimuli and was upregulated 3- and 505-fold at 10 and 30 dpi, respectively. Suppressor of cytokine signaling 3 (SOCS3) is upregulated ninefold at 30 dpi (Fig. 3b).
Confirmation of RNA-seq data by real-time qPCR
We next sought to validate the RNA-seq expression profile through performing qPCR of selected genes from each time point. We chose to test genes from both the up- and downregulated expression data from multiple cellular processes to reduce the chance of any bias in our results. CD3 antigen, epsilon polypeptide, a component of T cell receptor complex, was evaluated across all three time points. Tumor necrosis factor superfamily member 13b (BAFF), cytokine of the tumor necrosis factor ligand family, was tested at 10 and 20 dpi. Phenylalanine hydroxylase, phenylalanine catabolism, and stearoyl-CoA desaturase, fatty acid biosynthesis, were tested at 10 dpi. Troponin C type 1, a regulatory protein of striated muscle contraction, was evaluated at 20 and 30 dpi. To assure the accuracy of the qPCR results we tested for two housekeeping genes, GAPDH and β-actin. Each housekeeping gene was used separately to normalize expression data. Our qPCR results normalized to GAPDH were significant for all genes tested except BAFF (Table 6). In addition, these results were correlated well with the RNA-seq expression profile (r = 0.96, p < 0.0001). Similar results were obtained normalizing test genes to β-actin (r = 0.96, p < 0.0001) (data not shown).
p-value ≤0.05.
Discussion
We demonstrated that infection of chickens with MDV results in measurable changes in the transcriptional profile of the skin of infected birds compared to uninfected controls. In total, across the three time points, we identified 3,724 up- and 3,090 downregulated genes in the skin of MDV-infected chickens with some genes differentially expressed at more than one time point. While this is certainly a broad data set, we acknowledge that this number may not represent all possible differentially expressed genes due to our logistical limitation of four birds per treatment group per time point. While we identified many differentially expressed genes in this study that could be playing a role in host–pathogen interaction, further analysis is needed as there still remain 186 (14%) differentially expressed genes that are termed as uncharacterized protein and 11% of the reads are unmapped partly due to the incomplete nature of the chicken genome. Both of these unknown gene sets could potentially be a source of novel genes important to MDV-host interactions. Although there have been reports describing the cell types and expression of specific genes in the skin of MDV-infected chickens, a global view of the skin's transcriptome in MDV-infected chickens has never been reported (1). This is the first study utilizing RNA-seq to form a profile of the host skin's transcriptome when it is infected by MDV. This approach has allowed us to build a complete and unbiased picture of the changes in the gene expression of the skin that may contribute to the permissive nature of this tissue for the production and shedding of infectious virus. This data set will provide future investigations with insight into a critical phase of host–pathogen interaction. The information may lead to a better understanding of the molecular mechanism of MDV immune evasion, enveloped virus formation, and possible strategies for development of new or improved vaccines.
Our analysis of the differently regulated genes resulted in multiple GO categories being identified, with most of these categories falling directly under host immune response and other categories potentially related to host immune response such as cell death. Our search for downregulated genes resulted in fewer categories that had no clear theme. As would be expected, we found that infection with MDV resulted in a significant enrichment of biological processes and molecular functions related to immune response pathways among upregulated genes. This includes three immune-related GO terms, which were enriched across all three time points: immune response, immune system process, and response to stimulus.
When all immune response categories for all three time points were taken together, some genes, including β-2 microglobulin, MHC class I alpha chain 2, T cell surface glycoprotein CD3 delta chain (CD3D), MHC Rfp-Y class I alpha chain (ENSGALG00000024348), integrin β-2 (ITGB2), P2X purinoceptor 7 (P2RX7), and signal transducer and activator of transcription 1-α/β (STAT1), were upregulated across all three time points. Collectively, these genes represent critical functions in the host's response to MDV infection. B2M is a component of major histocompatibility complex class I heavy chain and critical for the presentation of nonself proteins in viral-infected cells to cytotoxic T cells (16). CD3D is a component of the T cell receptor/CD3 complex, which mediates signal transduction in T lymphocytes when stimulated by antigens by histocompatibility complex molecules. This results in the secretion of multiple cytokines and activation of cytolysis (6). ITGB2 forms complexes on the cell surface of various alpha chain integrins, which then bind to cell adhesion molecules such as ICAM1 and VCAM3, allowing for the recruitment of leukocytes to the site of inflammation (21). P2RX7, a purinergic receptor, promotes pro-inflammatory cytokine secretion by macrophages in response to microbial pathogens (13). STAT1 is a transcription activator that is activated by multiple growth factors and cytokines such as interferons that result in the activation of multiple antiviral genes (17). Our data support the existence of a robust immune response in the skin to MDV. Despite this immune onslaught, however, MDV seemingly must have a mechanism to survive and replicate in this tissue.
While there are many different host genes and process pathways in the skin that are altered by the virus that may allow for viral production, we chose to focus on genes that may play a role in the virus-induced immunosuppression in the infected skin tissues. We searched the GO categories and KEGG pathways related to immune response to identify candidate genes that are differentially expressed after MDV infection and are known to have immunosuppressive properties. One such gene is the microRNA gga-let-7d, which was significantly upregulated across two time points after infection with MDV, 357-fold at 20 dpi and 322-fold at 30 dpi. gga-let-7d is a member of the let-7 microRNA family that inhibits innate immune response by downregulating the expression of interleukin (IL)-6 and Toll-like receptor 4 (TLR4). IL-6 is a pro-inflammatory cytokine secreted by both macrophages and T lymphocytes in response to infection by pathogens. The potential role for IL-6 in the immune response to MDV has been shown by the mouse model for herpes simplex virus-1, another α-herpesvirus. Mice deficient for IL-6 when infected with HSV-1 have been shown to have increased viral titers and high mortality rates (27). Interestingly, recombinant attenuated vaccines against poultry viruses have been engineered to express IL-6 in addition to the viral antigen in the hopes of improving the efficacy of the vaccines. Such a vaccine developed against flu strain H5N1 (rFPV-AIH5AIL6) had increased immune response and reduced viral shedding in ducks compared to the same vaccine without the IL-6 gene (31). How the significantly increased expression of a microRNA inhibitor of IL-6 will affect the efficacy of recombinant vaccines using a similar strategy against MDV remains unclear. This microRNA also downregulates TLR4, which is an orthology to mammalian TLR4 and is expressed on the cellular membrane. TLR4 recognizes viral components and helps to initiate the immune response to these viruses (10,23,44). Thus, the ability of MDV to upregulate gga-led-7d may be a mechanism of suppressing multiple immune response pathways. As MD is a lymphoproliferative disease, it should be noted that several members of the let-7 microRNA have been demonstrated to be upregulated in several human lymphomas (5). Thus, given the role of let-7 microRNA in immunosuppression and oncogenesis, gga-let-7d makes a particular interesting candidate gene to verify this microRNA's role in MDV pathogenesis.
IL22RA2 is a soluble protein that binds to and inhibits IL-22 and, as such, an inhibitor of inflammatory responses and is upregulated 16-fold at 20 dpi and 12-fold at 30 dpi. IL-22 receptors are principally expressed by epithelial cells and are key to epithelial cell homeostasis, a cell type critical to the MDV life cycle (38). IL-22 has been shown to activate the antiviral functions of neutrophils against infection by another herpesvirus, cytomegalovirus, in mice (39). This opens the possibility that inhibiting this pathway may limit the ability of neutrophils to combat MDV. TNFRSF21 has been shown to be a negative regulator of both T cell and B cell function and is upregulated fourfold at 20 dpi and threefold at 30 dpi and could negatively impact these cell types during MDV infection. Genetic knockout of TNFRSF21 in mice increased CD4+ T cell proliferation and cytokine secretion (24). TNFRSF21 deficiency in B cells led to increased cell expansion, survival, and humoral response (35). Thus, increased expression of this gene may have limited the ability of the adaptive immune system to respond to MDV infection. Pstpip2 strongly limits macrophage expansion and response to stimuli and, when not expressed, leads to autoimmune diseases in mice (11). Given that this gene was upregulated 505-fold at 30 dpi, it would be interesting to consider how this may suppress macrophage response to the MDV. SOCS1 and SOCS3 are both upregulated after infection with MDV and form a negative feedback loop to attenuate cytokine signaling. It is worth noting that these genes have been shown to inhibit IFN induction of the JAK/STAT signaling pathway, resulting in reduced antiviral activities of the cell (37). Both SOCS1 and SOCS3 have been previously reported as being upregulated after MDV infection, and SOCS1 has been reported to be more highly expressed in MD-susceptible chicken lines (36). Interestingly, these two genes inhibit the function of STAT1, the inducer of immune response that is unregulated across three days in our study. Taken together, these immunosuppressive genes that are upregulated in the skin of MDV-infected chickens may hold insights into the molecular mechanisms that allow the successful assembly of infectious enveloped cell-free virus particles from this tissue and no other.
In summary, this study sought to identify viral-induced differentially expressed genes in the skin of MDV-infected chickens that suppress the host immune response, and thus, may contribute to MDV replication and shedding from the skin tissue. To this end, we identified a significant number of individual genes that were differentially expressed following infection across three times points. We were then able to identify several upregulated genes with potentially immunosuppressive properties that we put forth as candidate genes that may be critical to the MDV lifecycle. The list of differentially expressed host genes that are yet to be analyzed is extensive and may hold the secret for molecular mechanism of replication and assembly of the cell-free enveloped infectious virus particles within the FFE. Understanding the role of these genes in the MDV life cycle could provide insights into developing a sterilizing vaccine against MDV.
Footnotes
Acknowledgments
The authors thank Jennifer Pierluissi and Dan Wang for their excellent technical assistance.
Author Disclosure Statement
No competing financial interests exist.
References
Supplementary Material
Please find the following supplemental material available below.
For Open Access articles published under a Creative Commons License, all supplemental material carries the same license as the article it is associated with.
For non-Open Access articles published, all supplemental material carries a non-exclusive license, and permission requests for re-use of supplemental material or any part of supplemental material shall be sent directly to the copyright owner as specified in the copyright notice associated with the article.
