
Abstract
Hand, foot, and mouth disease (HFMD) is a common infection for children younger than the age of five. HFMD is mainly induced by coxsackievirus A16 and enterovirus 71 (EV71). EV71-associated HFMD often has serious neurological disease complications. The purpose of this study was to reveal the mechanisms of action of EV71 on neurons. SH-SY5Y cells transfected or untransfected with EV71 were sequenced. After data preprocessing, differentially expressed genes (DEGs) were screened using the limma package in R, and clustering analysis was then performed using the ComplexHeatmap package in R. The DAVID tool was used for EDG enrichment analysis. Protein–protein interactions (PPIs) were predicted using the STRING database and PPI networks were then constructed using Cytoscape software. After pathways involved in the key PPI network nodes were enriched, pathway deviation scores were calculated. Clustering analysis was also conducted for these pathways. There were 978 DEGs in the transfected samples. Upregulated TNF was enriched in NF-kappa B signaling pathway. Among the top 20 nodes in the PPI network, CDK1, STAT3, CCND1, TNF, and MYC had the highest degrees. A total of 28 pathways were enriched for the top 20 nodes, including Epstein-Barr virus infection (p = 3.78E-06), proteoglycans in cancer (p = 4.96E-06), and melanoma (p = 1.99E-05). In addition, clustering analysis showed that these pathways could clearly differentiate the two groups of samples. EV71 may affect neurons by mediating CDK1, STAT3, CCND1, TNF, and MYC, indicating that these genes are promising targets for preventing the neuronal complications of HFMD.
Background
Hand, foot, and mouth disease (HFMD), a commonly occurring infection, is characterized by bumps or spots on the feet, hands, and mouth (17,28). HFMD commonly occurs in children younger than 5 years (17,41) and tends to break out in spring, summer, and autumn (31). HFMD is mainly induced by coxsackievirus A16 (CVA16) and enterovirus 71 (EV71), and these viruses can spread through the air from coughing, through close personal contact, and through the feces of HFMD patients (31). At present, there is no effective therapy for HFMD, and disease management is aimed at relieving symptoms (35). Because of neurological complications, including encephalitis, meningitis, and acute flaccid paralysis, patients with HFMD may require hospitalization (11). Compared with CVA16 infection, EV71-associated HFMD often has more serious neurological disease complications (7). Therefore, identifying the mechanisms of action of EV71 on neurons is necessary for developing pharmacological strategies that prevent the neuronal complications of HFMD.
Previous studies have found that EV71 mediates the cell cycle and cell proliferation of SH-SY5Y cells by promoting the expression of the endogenous microRNA, let-7b, and by regulating cyclin D1 (CCND1) (9). EV71 increases Abl kinase activity by a cell type- and serotype-specific mechanism, which in turn induces neuronal apoptosis by activating cyclin-dependent kinase 5 (Cdk5) signaling (5). In EV71-infected SF268 glioblastoma cells, NEDD4L (neural precursor cell expressed, developmentally downregulated 4-like) protein is differentially expressed and is associated with EV71 replication (22). Through the phosphorylation and inactivation of apoptosis signal-regulating kinase 1 (ASK1), the activation of the phosphatidylinositol-3 kinase (PI3K)/Akt pathway restricts c-Jun NH2-terminal kinase (JNK)-associated apoptosis after EV71 infection (14). By inducing tumor necrosis factor alpha (TNF-α), Fas ligand (FasL), and CD40 ligand (CD40L) expression, EV71 infection promotes apoptosis of rhabdomyosarcoma cells (37). However, the mechanisms of action of EV71 on apoptosis have not been fully reported.
In this study, RNA sequencing was performed on SH-SY5Y cells transfected and untransfected with EV71. The differentially expressed genes (DEGs) between the two groups of samples were then identified. Clustering, enrichment, and protein–protein interaction (PPI) network analyses were performed on these DEGs. In addition, the key nodes in the PPI network were screened and underwent pathway enrichment analysis. Finally, pathway deviation scores were calculated to further confirm the key nodes.
Methods
EV71 preparation
Blood samples isolated from HFMD patients were centrifuged (2000 rpm, 10 min, 4°C) and the virus supernatant was reserved. Vero cells (ATCC) were digested with 0.25% trypsin-0.01% ethylenediaminetetraacetic acid (EDTA; GBICO, Waltham, MA) and then resuspended in modified Eagle's medium (MEM) containing 10% fetal bovine serum (FBS, 105 cells/mL). Subsequently, cells were inoculated into 100 mL cell culture flasks (2 × 10⁵ cells/flask) and cultured at 37°C. After cell monolayers formed, cells were cultured in 1 mL of virus supernatant at 37°C for 30 min and then MEM medium containing 2% FBS was added. After 3–5 days, cells were observed for the appearance of cytopathic effects. After lesions occurred in all cells, the medium was collected and was frozen and thawed one to two times. Virus harvest fluid was then obtained and stored at −80°C. One milliliter of virus harvest fluid was inoculated into 100 mL cell culture flasks. After being continuously passaged for three generations, samples that remained free of cytopathic effects were judged to be negative.
The positive harvest fluid was added to 96-well culture plates (50 μL/well) and mixed with 50 μL of diluted EV71-specific antiserum (dilution was 1:8). Neutralization was performed for 1 h in an incubator at 37°C and 5% CO2, and then Vero cells (1 × 10⁴ cells/100 μL/well) were added. After culturing in an incubator at 37°C and 5% CO2 for 3–5 days, cells were observed for the appearance of cytopathic effects. Cell controls, serum controls, and virus controls were also tested.
Cell culture and EV71 transfection
Human SH-SY5Y cells were obtained from the Cell Bank of the Chinese Academy of Sciences (Shanghai, China). SH-SY5Y cells were digested with 0.25% trypsin-0.01% EDTA (GBICO) to form single cells. Cells were then resuspended in Dulbecco's modified Eagle's medium (DMEM) containing 10% FBS, with a concentration of 105 cells/mL. Following this, cells were inoculated into T75 cell culture flasks (5 × 10⁶ cells/flask) and then cultured at 37°C until they formed a monolayer (from 1 × 10⁷ to 2 × 10⁷ cells/flask). After the previous medium was discarded, monolayer cells were cultured in EV71 virus culture (multiplicity of infection = 0.1) at 37°C for 30 min. Subsequently, DMEM containing 2% FBS was added to the cells, and they were collected after infection for 24 h.
RNA extraction and RNA-seq library construction
Total RNA was extracted using TRIzol (Invitrogen, Carlsbad, CA), following the manufacturer's manual. RNA integrity was confirmed by 1% agarose gel electrophoresis and an Agilent RNA 6000 Nano Kit (Agilent Technologies, Santa Clara, CA). Purity and concentration were determined separately using a NanoPhotometer® spectrophotometer (IMPLEN, Munich, Germany) and a Qubit® 2.0 Flurometer (Life Technologies, Carlsbad, CA). Subsequently, the NEBNext® Ultra™ RNA Library Prep Kit for Illumina® (NEB #E7530; New England Biolabs, Ipswich, MA) was used to construct RNA-seq libraries. After mRNA was enriched, it was broken into fragments with fragmentation buffer. Double-stranded cDNA was then synthesized, purified, and repaired. Next, PCR amplification was carried out to obtain a cDNA library. Finally, quality detection and sequencing of the cDNA library were performed on a Bioanalyzer 2100 (Agilent Technologies) and a Hiseq 2500 (Illumina, San Diego, CA) instrument, respectively. Sequencing data were uploaded to the NCBI (National Center for Biotechnology Information) SRA (Sequence Read Archive) database, under the accession number, SRP091307.
Data preprocessing and DEG screening
Quality control was performed on the raw data using cutadapt (27), prinseq-lite (36), and fastq_quality_filter (15) tools. In brief, adapter sequences were removed. Then, bases with continuous quality under 20 at two ends, reads with low quality (containing over 20% bases with quality below 20), and reads with a length less than 10 bases were removed. Finally, clean reads of high quality were obtained. High-quality reads were compared to the University of California Santa Cruz (UCSC) hg19 human genome, and then, genes were annotated using the TopHat tool (20). Using the htseq-count tool (3), results of the comparison were processed, and the read count of each gene in the samples was acquired. Then, FPKM (fragments per kilobase of exon per million fragments mapped) files were obtained using the cufflinks tool (38).
Read count files were input into the limma package (32) in R to analyze DEGs between transfected and untransfected samples. The p-values of genes were calculated using a corrected t test (40) and were then adjusted using the Benjamini–Hochberg method (1). Genes with an adjusted p-value (i.e., false discovery rate, FDR) <0.05 and log2-fold change (FC) ≥0.58 were considered as DEGs. Clustering analysis was also performed for the DEGs using the ComplexHeatmap package (13) in R.
Functional and pathway enrichment analysis
The Gene Ontology (GO) bioinformatics resource provides functional information on gene products in cellular components (CC), biological processes (BP), and molecular function (MF) (39). The Kyoto Encyclopedia of Genes and Genomes (KEGG,
PPI network analysis
The STRING database describes physical and functional PPIs implicated in various organisms (12). PPIs were predicted for DEGs using the STRING database (12), using a threshold of combined score >0.7. A PPI network was then constructed using the Cytoscape software (33). Using a random walk algorithm (34), the key nodes in the PPI network were analyzed. The node scores were then calculated using the RWOAG package (16) in R. In addition, pathway enrichment analysis was also performed for key nodes in the PPI network using the DAVID tool (10).
Calculation of pathway deviation score for the key nodes
To further explore the mechanisms of HFMD, pathways enriched for the key nodes were scored based on the genes involved in them using the following formula:
P and n represent the pathway and the number of genes enriched in each pathway, respectively. Gi and mean indicate the expression value of gene i in a sample and the average expression value of gene i in the untransfected samples, respectively. The scores of pathway P in all samples were obtained by calculating the Euclidean distances of all enriched genes in pathway P in transfected and untransfected samples and summing them. The average scores of transfected and untransfected groups were then separately calculated based on their score (P). Following this, the absolute value of the difference of average scores was calculated and defined as the deviation score of pathway P relative to the untransfected group. The smaller the deviation score, the closer the pathway was to the normal level. Based on the average scores, clustering analysis was conducted to determine whether these pathways could clearly distinguish transfected samples from untransfected samples.
Results
DEG analysis
There were 978 DEGs (including 654 upregulated genes and 324 downregulated genes) in the transfected samples compared to the untransfected samples. The number of upregulated genes exceeded the number of downregulated genes. The clustering analysis heatmap indicated that the DEGs could easily distinguish the transfected samples from the untransfected samples (Fig. 1).

The clustering analysis heatmap for DEGs. The exp_mean represents the mean expression value. V1, V2, and V3 are transfected samples. C1, C2, and C3 are untransfected samples. DEG, differentially expressed gene.
Functional and pathway enrichment analysis
Enrichment analyses were conducted separately for the upregulated and downregulated genes. The top 10 terms enriched in the upregulated genes are listed in Figure 2. They mainly included transcription, DNA-templated (BP, p = 4.16E-17), nucleus (CC, p = 9.41E-18), transcription factor activity, sequence-specific DNA binding (MF, p = 1.05E-09), NF-kappa B signaling pathway (pathway, p = 9.15E-04, involving TNF), and steroid biosynthesis (pathway, p = 2.18E-04; Fig. 2). Meanwhile, the enriched terms for downregulated genes included translational initiation (BP, p = 5.54E-09), cytosolic large ribosomal subunit (CC; p = 1.65E-04), protein binding (MF, p = 7.52E-04), and ribosome (pathway; p = 7.34E-05; Fig. 3).
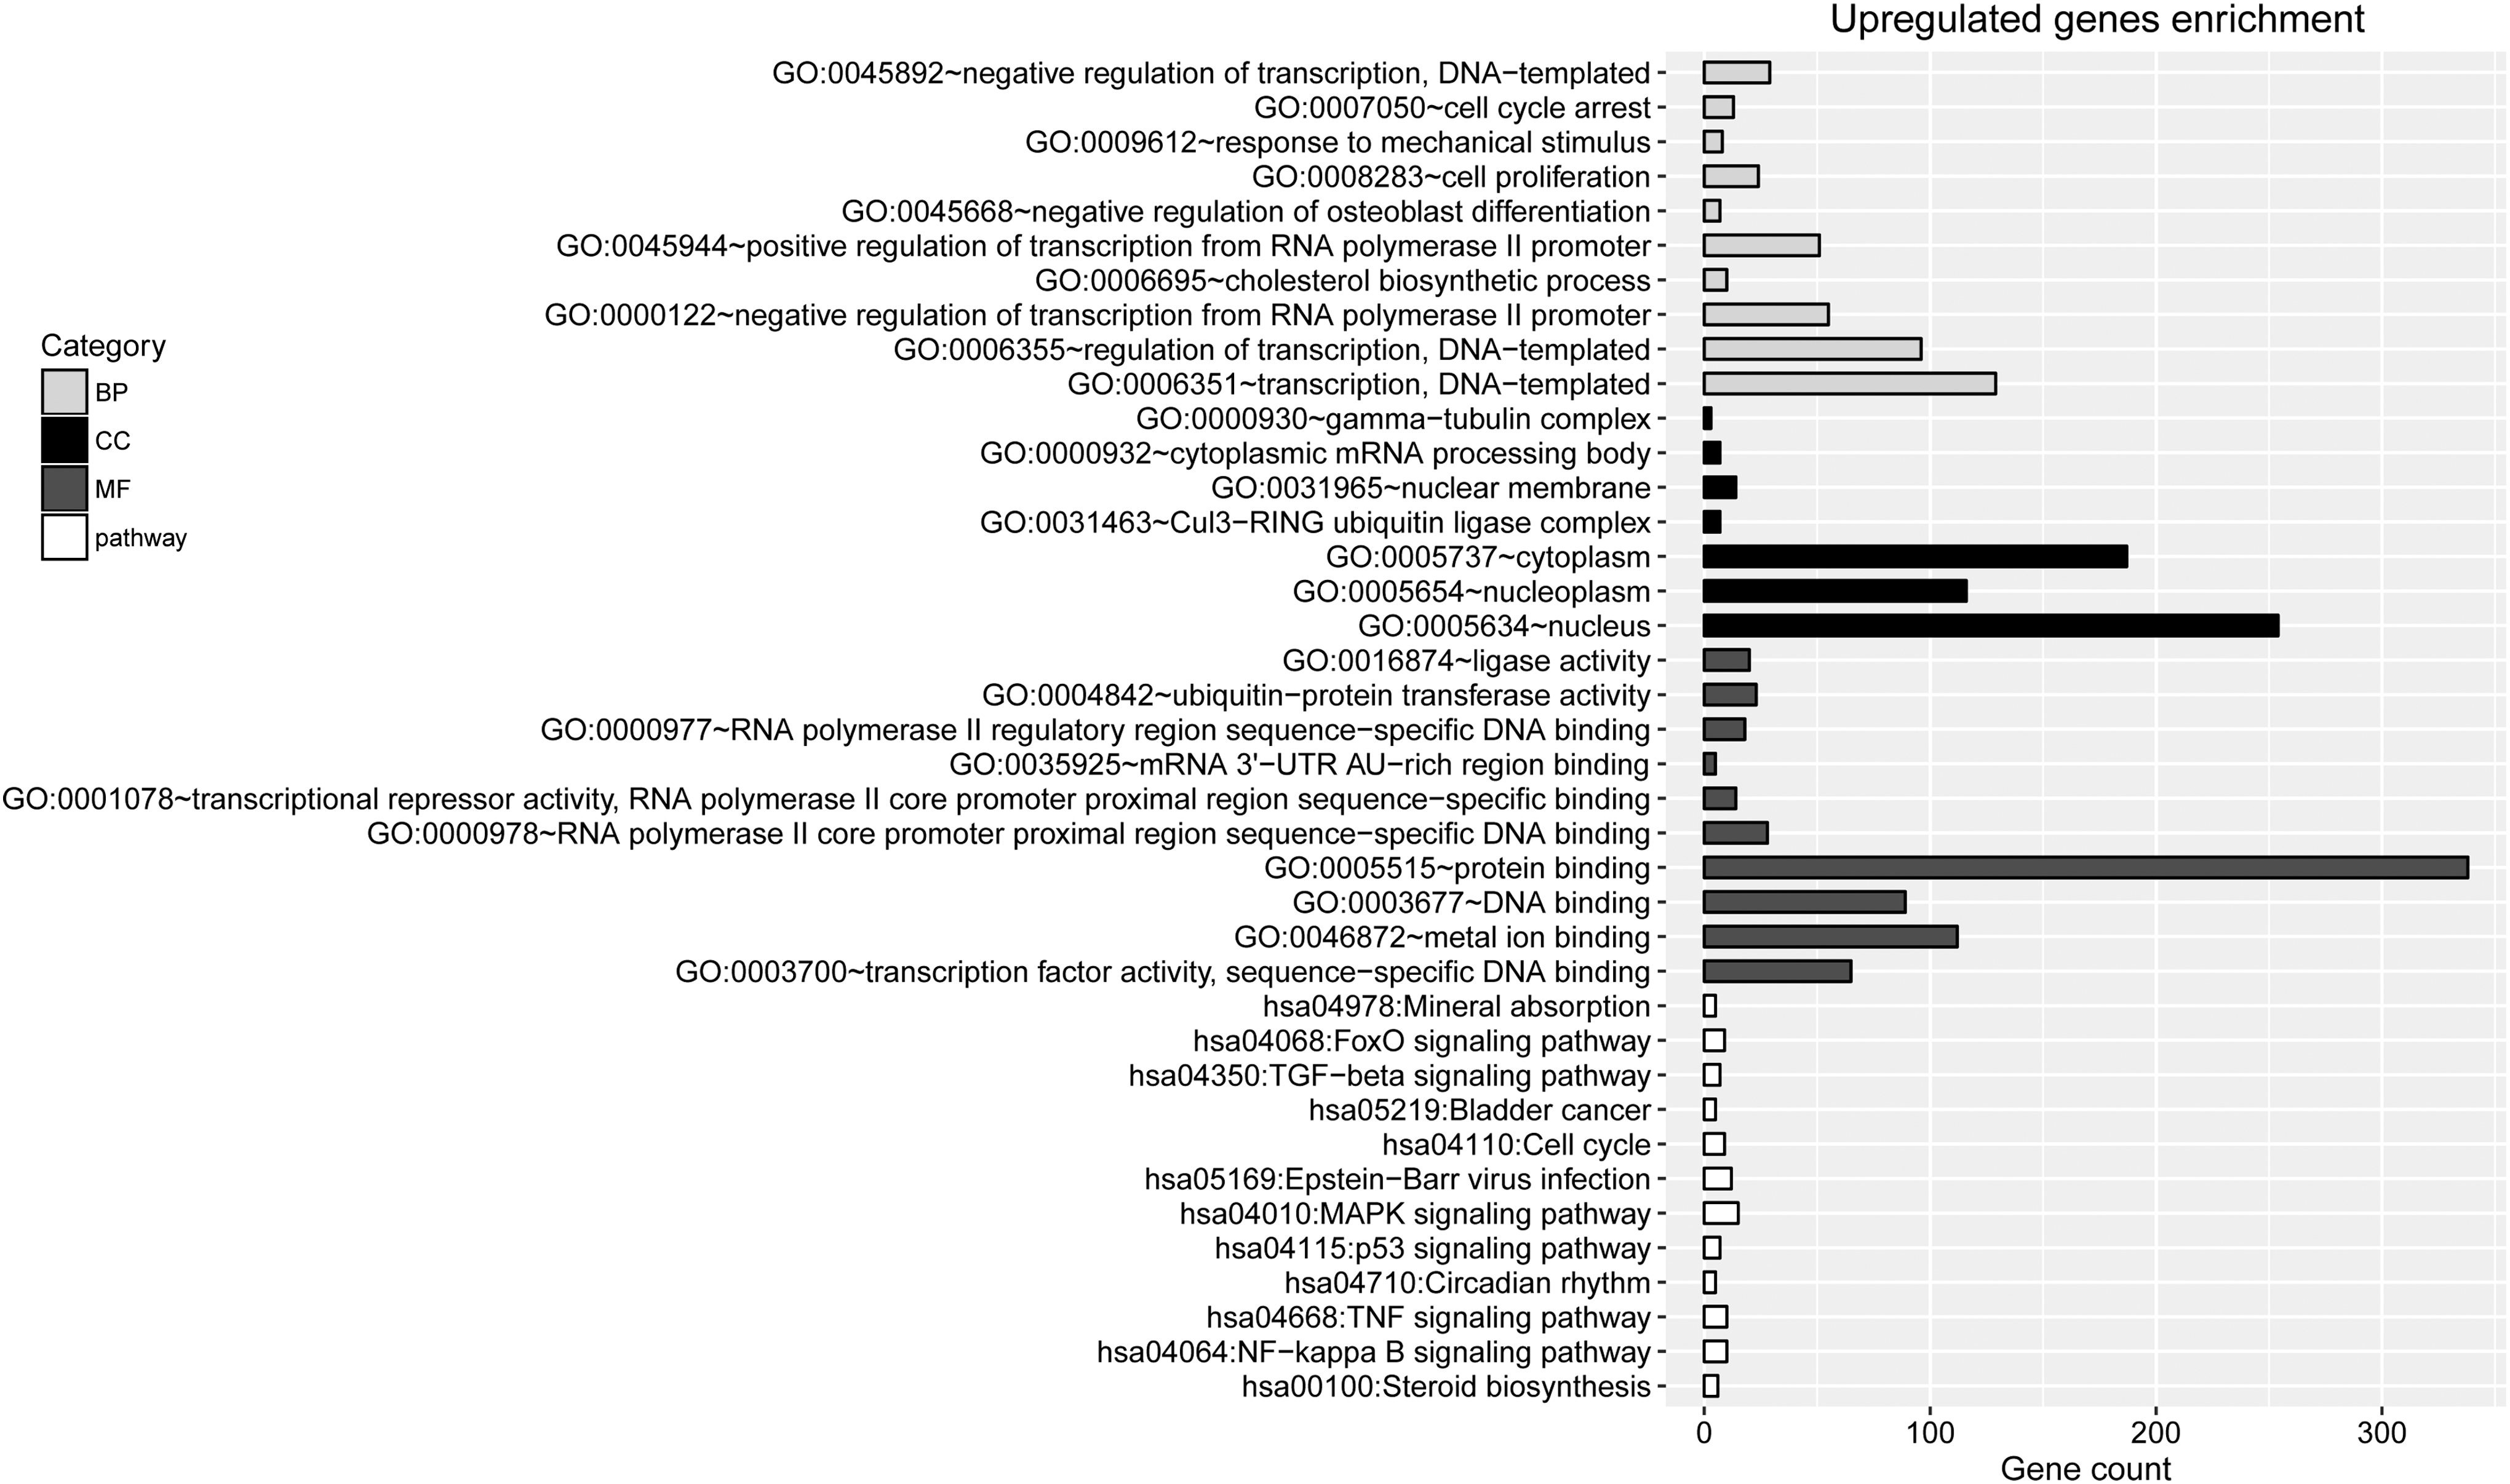
The top 10 terms enriched for upregulated genes. BP, biological process; CC, cellular component; MF, molecular function.
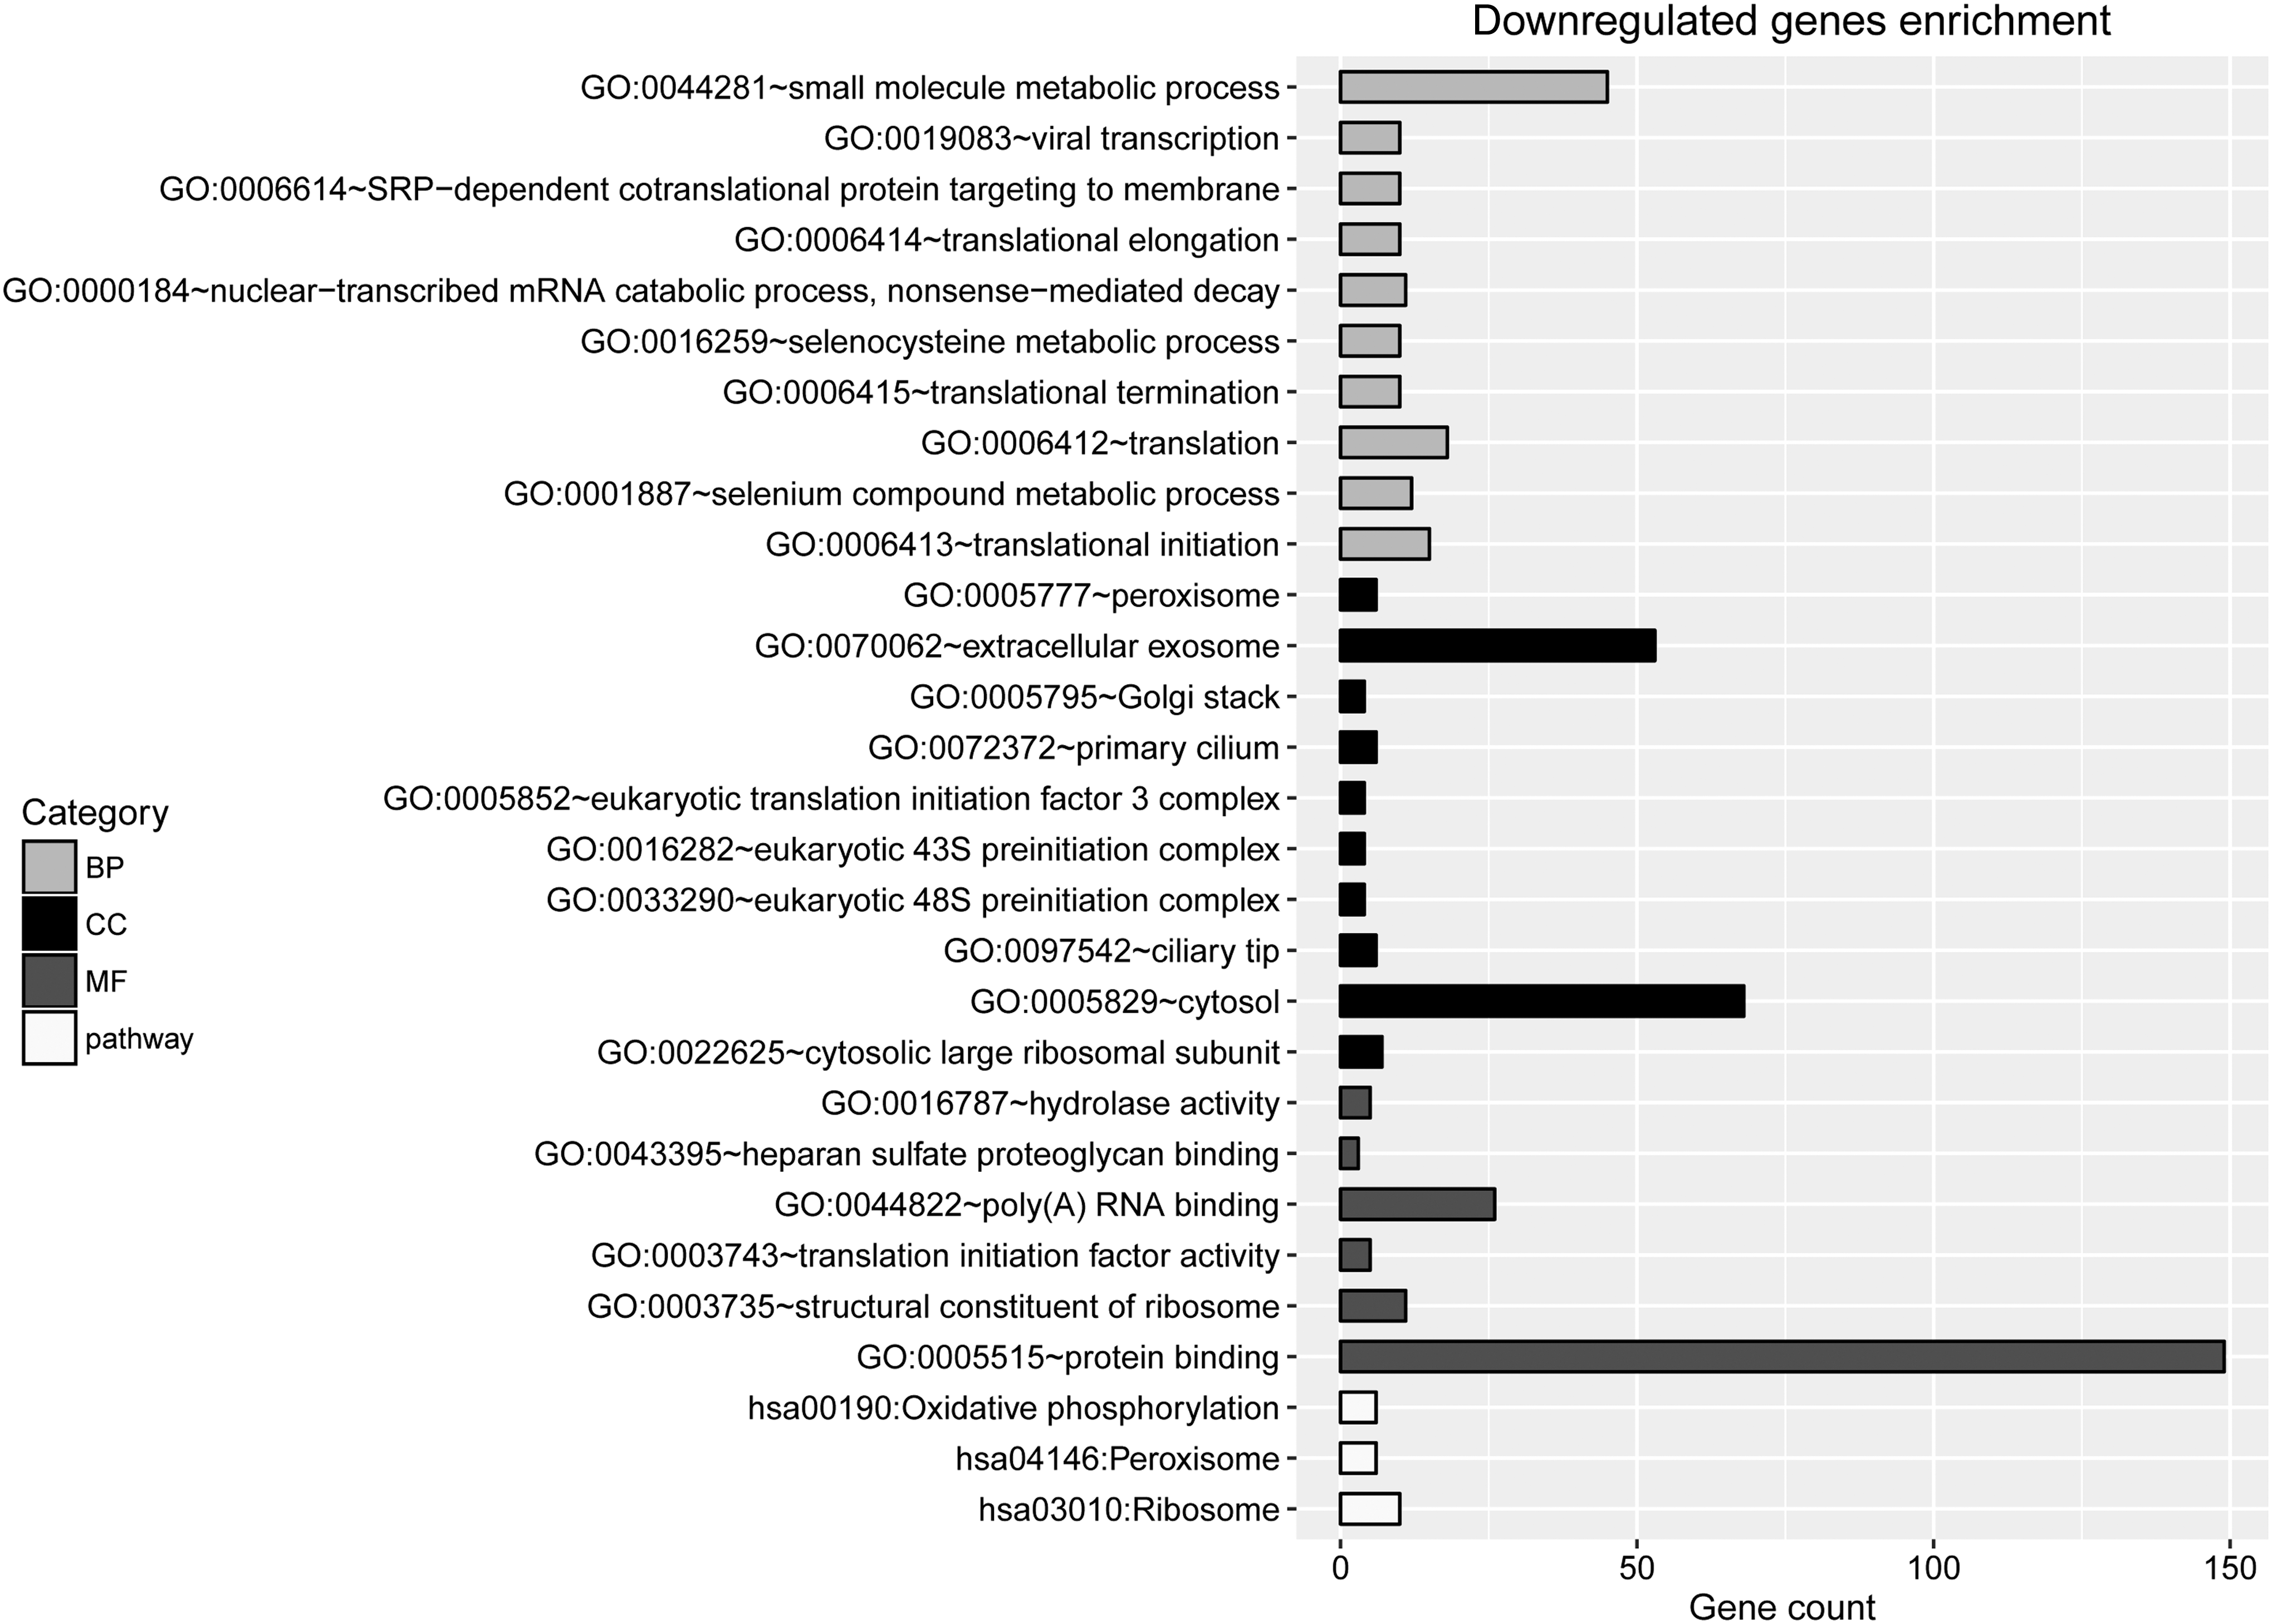
The top 10 terms enriched for downregulated genes.
PPI network and pathway deviation score analyses
The PPI network had 391 nodes and 752 edges (Fig. 4). The top 20 nodes in the PPI network were analyzed using the random walk algorithm and are listed in Table 1.
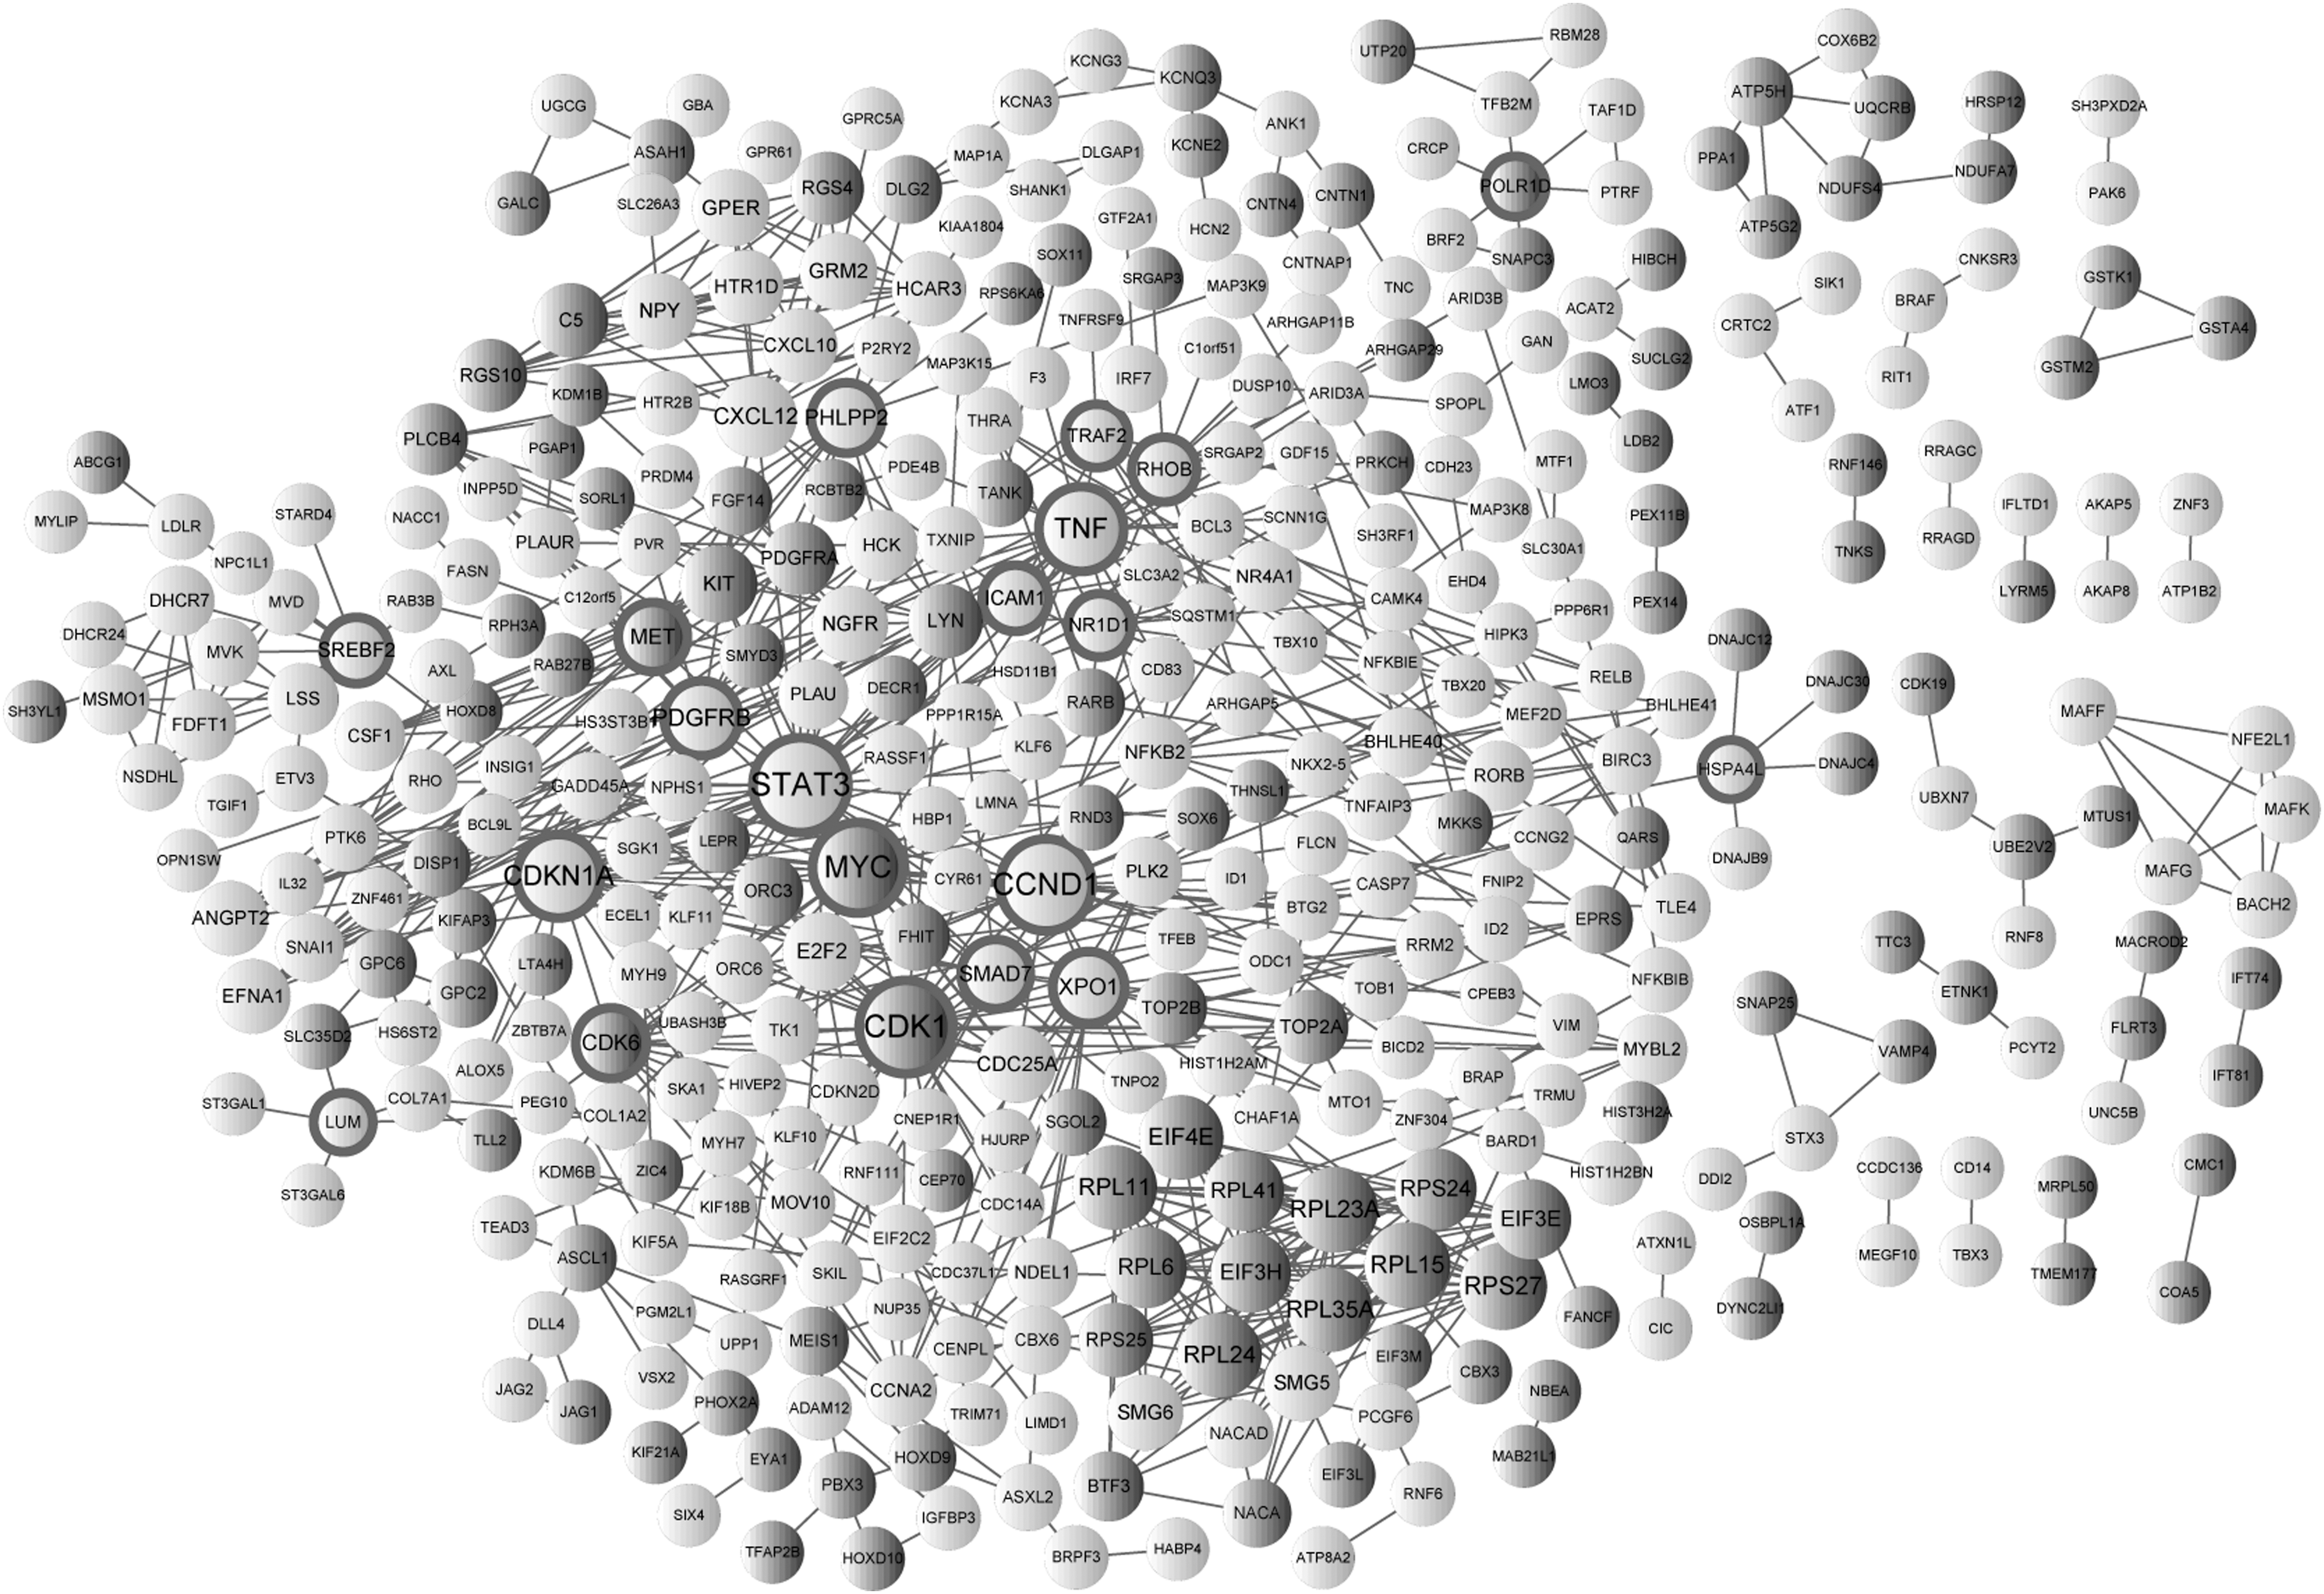
The PPI network constructed for DEGs. Light gray and dark gray circles represent upregulated and downregulated genes, respectively. Circles with gray bands represent the top 20 nodes. PPI, protein–protein interaction.
The Top 20 Nodes in the Protein–Protein Interaction Network Selected Using the Random Walk Algorithm
Among the top 20 nodes, upregulated signal transducer and activator of transcription 3 (STAT3), CCND1 and TNF, as well as downregulated cyclin-dependent kinase 1 (CDK1) and MYC, had the highest degrees. Clustering analysis was also conducted for the top 20 nodes and the results showed that the top 20 nodes could clearly separate transfected samples from untransfected samples (Fig. 5). A total of 28 pathways were enriched for the top 20 nodes, including Epstein–Barr virus infection (p = 3.78E-06), proteoglycans in cancer (p = 4.96E-06), and melanoma (p = 1.99E-05; Table 2). The deviation scores for these pathways are listed in Table 3.

The clustering analysis heatmap for the top 20 nodes. V1, V2, and V3 are transfected samples. C1, C2, and C3 are untransfected samples.
The 28 Pathways Enriched for the Top 20 Nodes
Deviation Scores of the Pathways Enriched for the Top 20 Nodes
Based on the average deviation scores, clustering analysis was conducted for these pathways. Figure 6 showed that these pathways could clearly distinguish transfected samples from untransfected samples, indicating that these pathways had significant differences between transfected and untransfected samples.

The clustering analysis heatmap for pathways enriched for the top 20 nodes. V1, V2, and V3 are transfected samples. C1, C2, and C3 are untransfected samples.
Discussion
Although both CVA16 and EV71 can induce HFMD, EV71 causes more serious neuronal complications. Thus, the aim of this study was to identify the neuronal-toxic effects of EV71, and therefore, the effects of EV71 could not be compared with those of CVA16 under the current experimental design. In this study, a total of 978 DEGs were identified in transfected samples relative to untransfected samples, including 654 upregulated genes and 324 downregulated genes. In the PPI network, CDK1, STAT3, CCND1, TNF, and MYC had the highest degrees among the top 20 nodes. A total of 28 pathways were enriched for the top 20 nodes. In addition, clustering analysis showed that these pathways could clearly distinguish transfected samples from untransfected samples.
Interleukin-1 beta (IL-1β) secretion and STAT3 activation in HAPI microglial cells are regulated by P38/JNK MAPK (mitogen-activated protein kinase) elevation and can cause toxicity in neurons (26). STAT3 degradation may result in isoflurane-induced neurotoxicity, partly by activating calcineurin (43). Through Janus kinase (JAK)-STAT3 and p53 signaling pathways, Kruppel-like factor 4 (KLF4) functions in the progression of traumatic brain injury and thus, blocking KLF4 may be a promising therapeutic strategy for the disease (6). Decreased STAT3 can lead to apoptosis of glioma cells and STAT3 is involved in growth, proliferation, and survival of glioma cells (30). These results indicate that EV71 may act on neurons by mediating STAT3.
Previous studies demonstrate that the E2F transcription factor 1 (E2F1)/CDK1 pathway promotes the pathogenesis of spinal cord injury and the disease may be treated by selectively inhibiting the signaling cascade of this pathway (42). Both activity and expression of CDK1 can be suppressed by a brain-derived neurotrophic factor-dependent mechanism, which helps to maintain the G2-like state of tetraploid retinal ganglion cells (29). By downregulating upregulated gene 4 (URG4/URGCP) and CCND1 and upregulating p65, valproic acid promotes cell cycle arrest in SHSY5Y neuroblastoma (NB) cancer cells and may be a potential agent for treating NB (8). Overexpression of CCND1 contributes to the proliferation of neural stem cells and promotes their differentiation through the JAK-STAT3 pathway (24). Previous studies report that CCND1 expression in peripheral neuroblastic tumors mimic changes that occur in the process of normal development of the peripheral sympathetic nervous system (25). Thus, EV71 may also affect neurons by regulating CDK1 and CCND1.
TNF-α expression is mediated by miR-181c following ischemia/hypoxia and microglia-regulated neuronal injury (23). Nitric oxide (NO), IL-1β, and TNF-α are highly expressed in hypoxic microglia, which can lead to Purkinje neuron death through their receptors (19). NF-kappa B has critical influences on nervous system, which is correlated with developmental cell death, synaptic plasticity, and neurodegenerative disorders (2). Enrichment analysis showed that upregulated TNF was involved in NF-kappa B signaling pathway. Therefore, TNF may play a role in neurons via participating NF-kappa B signaling pathway. By increasing c-Myc expression and protecting against c-Myc-associated apoptosis, p53 mutations promote the development of gliomas (21). Previous studies indicate that c-Myc may reduce expression of the miR-23b-27b cluster, leading to extraneuronal apoptosis during hypoxia (4). These data indicate that the action of EV71 on neurons may be correlated with its effects on TNF and MYC.
Conclusions
In conclusion, a comprehensive bioinformatics analysis was performed in this study and a total of 978 DEGs were identified in transfected samples. Based on these bioinformatics data, EV71 may impact neurons by mediating CDK1, STAT3, CCND1, TNF, and MYC. Thus, these genes may be promising targets for preventing the neuronal complications of HFMD. However, these predictive results needed to be confirmed by further experimental researches such as quantitative real-time polymerase chain reaction and western blot.
Declarations
Ethics approval and consent to participate
This study was approved by the Ethics Committee of The First Affiliated Hospital of Harbin Medical University and The Center for Disease Control and Prevention of Harbin.
Availability of Data and Materials
The datasets used and/or analyzed during the current study are available from the corresponding author on reasonable request.
Footnotes
Acknowledgment
This work was supported by the Doctor Medical Fund of Harbin Medical University (Program No. 2014B23).
Authors' Contributions
H.Z. and S.G. conceived and designed the research, participated in data acquisition, and drafted the article. Y.S. and H.W. carried out analysis and interpretation of data. M.Z. and Y.L. participated in the statistical analyses. H.Z. and S.G. participated in the design of the study and performed statistical analyses. Y.S. and HW conceived the study, participated in its design and coordination, and helped draft the article. All authors read and approved the final article.
Author Disclosure Statement
No competing financial interests exist.