
Abstract
For the assessment of vaccine-induced immune response and to understand the role of antibodies in neutralization, it is necessary to assess dynamics of various antibodies in patients with different clinical manifestations. This study aims to quantitate circulating levels of IgA/IgG and IgG subtypes induced at different days postonset of symptoms, in severe and nonsevere patients. For this, serum or plasma samples (n = 146) collected from 79 COVID-19 patients were used. Indirect severe acute respiratory syndrome coronavirus 2 (SARS-CoV-2) specific IgA, IgG, and IgG subtype specific enzyme-linked immunosorbent assays (ELISAs) were performed. Antibody titers between severe and nonsevere patients were compared at different times postonset of clinical symptoms. Titers in ELISA were compared to neutralizing antibody (Nab) titers determined by plaque reduction neutralization test (PRNT). Over 75% patients were positive for IgA/IgG antibodies in the first week. The ELISA titers did not differ during the first week; however, severe disease exhibited raised titers thereafter. Nab titers correlated with the ELISA titers in mild presentation but not in severe disease. IgA and IgG1 antibodies correlated stronger with Nabs. The findings highlighted that IgA together with IgG play an important in SARS-CoV-2 neutralization. These results will prove useful in assessing efficacy of vaccines and understanding disease pathogenesis.
Introduction
Severe acute respiratory syndrome coronavirus 2 (SARS-CoV-2) is a highly contagious respiratory virus responsible for the current COVID-19 pandemic (31). Patients infected with SARS-CoV-2 remain asymptomatic, show mild symptoms, or develop severe acute respiratory distress syndrome (12). Although at older age, existing comorbidities been associated with severity (5,22,25), factors responsible for severity and mortality are largely unknown. So far, immune correlates of protection are not available.
Among antibodies, IgA is the predominant antibody present at mucosal surfaces and shown to provide protection against virus in the respiratory tract (20). IgA promotes the entrapment of antigens in the mucus, preventing direct contact of pathogens with the mucosal surface (14). IgA positivity toward SARS-CoV-2 nucleocapsid was as high as 92.7% in the first week of infection as against IgM (85.4%) and IgG (77.9%) positivity (10). Moreover, the role of IgA in SARS-CoV-2 neutralization early during infection, together with IgG, is reported (26). These data suggest that both antibodies work together to neutralize the virus (18,26).
Within IgG, the predominant IgG subtypes that are well reported to provide antiviral activity are IgG1 and IgG3 (6). Both IgG subtypes bind to all human Fc gamma receptors (FcγR) classes to execute its effector function (6) and are the outcome of Th1 response. On the contrary, IgG2 and IgG4 are the result of a Th2 response and mainly associated with polysaccharide antigens, and they were also shown to get induced after virus infection (11). Data on IgG subtypes induced after SARS-CoV-2 are minimally reported (21,28).
Several vaccines for SARS-CoV2 are in different phases of clinical trials in different populations (8,34). Understanding the antibody response, especially IgA and IgG subtypes, in terms of titers following natural infection and recovery is essential for the evaluation of vaccine-induced response. In view of the importance of IgA and IgG antibodies in protection and probably in pathogenesis, we quantitated these antibodies in COVID-19 patients presenting with no symptoms or mild/severe disease at different time intervals after the onset of clinical symptoms, by enzyme-linked immunosorbent assay (ELISA). In addition, correlation analyses of antibody titers in ELISA and plaque reduction neutralization test (PRNT) were carried out.
Materials and Methods
Human ethics approval
This study was approved by the Institutional Ethics Committee of Bharati Hospital & Research Centre at Bharati Vidyapeeth Deemed University (IEC/2020/25). Informed written consent was obtained from each participant before enrolment in this study.
Clinical samples
The study was conducted using 146 serum or plasma samples collected during May–July 2020 from 79 SARS-CoV-2 patients confirmed by real time polymerase chain reaction as per the guidelines of government of India. Table 1 describes the details of the patients from whom clinical samples were obtained for this study. Thirteen samples from nine patients were collected from the asymptomatic individuals identified during contact tracing. Sixty-four samples were collected from 23 severely ill patients admitted to intensive care unit, while 69 samples were collected from 43 patients with mild disease admitted to designated COVID wards. Blood was collected at enrolment, typically ∼24 to 72 h after admission, whenever possible, and at discharge. Serum or plasma was separated and stored at −80°C until use.
Details of the Patients from Whom Clinical Samples Were Obtained
Cardiovascular diseases, diabetes, hypertension, chronic lung diseases, parkinsonism, acute lymphoid leukemia.
Inactivated SARS-CoV-2-based ELISA
Inactivation of SARS-CoV-2 for coating of ELISA wells
Indirect ELISA was performed using β-propiolactone (BPL)-treated SARS-CoV-2 as described previously (13). Briefly, Vero cells were propagated using minimum essential medium (MEM, Gibco), 10% fetal bovine serum (FBS, Gibco), and 100 IU/mL penicillin and streptomycin. After 100% confluency was reached, cells were washed thrice with the phosphate-buffered saline (PBS) and infected with 0.01 MOI SARS-CoV-2 isolated from nasopharyngeal swab of an acute-phase SARS-CoV-2 patient from Pune, India (2020). After 72 h, the cell suspension was harvested and centrifuged at 4,816 g for 30 min at 4°C. Cell supernatant was collected and inactivated using 0.1% BPL for 24 h at 4°C. Smaller aliquots were made and stored at −80°C until inactivation was confirmed and for further use. For inactivation check, 1 mL BPL-treated virus was centrifuged in 30,000 molecular weight cutoff tubes (Sartorius, Germany) to remove BPL. The concentrate was resuspended in sterile MEM with 2% FBS at final volume of 1 mL and added to Vero cells. After 1 h of adsorption, the medium was removed and cells were maintained in freshly added MEM with 2% FBS for 5 days, and further blind passages were made for three times without any evidence of infection.
Inactivated SARS-CoV-2-based antibody detection ELISA
Vero cell supernatant containing inactivated SARS-CoV-2 virus was diluted in carbonate-bicarbonate buffer, pH 9.2, and 100 μL was added in ELISA wells for coating. One hundred microliters coating buffer contained 30,000 PFU SARS-CoV-2 inactivated virus particles (as determined by plaque assay for live virus) as described previously (13). Coated wells were incubated overnight at 4°C and washed five times using PBS containing 0.05% tween 20 (Greiner Bio-One, Austria). Plates were blocked for 1 h at 37°C using PBS containing 10% FBS (Gibco) and washed five times with wash buffer. Washing protocol was kept constant for all further washing steps. One hundred microliters of serum/plasma samples was diluted in sample diluent (PBS containing 10% FBS, 1% Vero cell supernatant, and 0.1% tween 20), was added to plates, and incubated for 1 h at 37°C. After incubation, wells were washed and 100 μL 1:20,000 diluted anti-human-IgG-HRP (Sigma-Aldrich), 1:2,500 diluted anti-human-IgA HRP (Sigma-Aldrich), anti-human-IgG1-HRP, anti-human-IgG2-HRP, anti-human-IgG3-HRP, or anti-human-IgG4-HRP (all from Southern Biotech) in PBS with 10% FBS and 0.1% tween 20 (Sisco, India) was added to wells. After incubation for 30 min at 37°C, 100 μl tetramethylbenzidine (TMB) substrate containing hydrogen peroxide (Clinical Science Products, Inc.) was added and reaction was stopped after 10 min using 50 μL 2N H2SO4. Plates were read at 450 nm. Cutoff value for the anti-SARS-CoV-2 ELISA was determined by multiplying optical density (OD) value of negative control by 2.5.
SARS-COV-2-specific plaque reduction neutralization test
SARS-COV-2-specific plaque reduction neutralization test (PRNT) was performed to detect/quantitate neutralizing antibody (Nab) titers. Briefly, PRNT was executed using Vero cells (CCL-81 and ATCC). Around 1 × 10⁵ cells/mL were seeded in the 24-well plate (Corning) using MEM containing 0.2 U/mL penicillin and 0.2 μg/mL streptomycin (Gibco). Twenty-four hours after seeding, serum samples heat inactivated at 56°C for 30 min were diluted fourfold in MEM with 2% FBS starting with 1:5 dilutions till 1:1,280. Equal volume of 600 PFU/mL SARS-COV-2 was mixed with diluted serum samples selected for the test and incubated for 1 h at 37°C in the incubator with 5% CO2. One hundred microliters of serum-SARS-COV-2 mix was added to the Vero cell monolayer and incubated for 1 h at 37°C in the incubator with 5% CO2. The mixture was removed and MEM with 2% FBS, 1% Aquacide-II (Merck, Germany), 0.2 U/mL penicillin, and 0.2 μg/mL streptomycin was added to the Vero cell monolayer. Plates were incubated for 96 h at 37°C in the incubator with 5% CO2. Overlay medium was discarded and cells were fixed with 3.7% formaldehyde made in the PBS. Cells were washed with the PBS and stained using 1% crystal violet. Plaques were counted after thorough washing and drying of crystal violet-stained plates. Karber formula for determining PRNT value was used to calculate the Nab levels.
Statistical analysis
GraphPad Prism v8.1.1 (GraphPad Software) was used to perform the statistical analysis. Two-tailed Mann–Whitney U test that was used to compare differences between groups *, **, ***, and **** represent p < 0.05, p < 0.01, p < 0.001, and p < 0.0001, respectively. Correlation coefficients between ordered features were quantified by the Spearman rank correlation coefficient and significance was assessed by the corresponding nonparametric methods.
Results
Standardization of inactivated SARS-CoV-2-based indirect IgA and IgG ELISA
We first standardized indirect ELISAs for the detection and quantitation of IgA and IgG-anti-SARS-CoV-2 antibodies employing the BPL-inactivated virus for coating the wells. The optimized coating concentration of 30,000 PFU/well, 1:100 diluted serum samples and 1:2,500 or 1:20,000 diluted conjugate, was used for IgA and IgG ELISA, respectively. A total of 91 or 100 blood donor samples collected during 2017–2019 (before the emergence of the current pandemic) were tested to determine specificities of IgA and IgG, respectively. The cutoff value was decided as 2.5 times the mean negative control.
IgA/IgG seropositivity among COVID-19 patients
To investigate the IgA as well as IgG serostatus in SARS-CoV-2-positive patients, 146 samples were screened. The overall IgA and IgG positivity was 87.5% and 92.5% respectively (Table 2). During the first week itself, 76.3% and 81.6% COVID patients had IgA and IgG antibodies, respectively, which raised to 100% during the third week (Table 2). The positivity was 92.3% in asymptomatic individuals. Positivity rate was higher in severe patients during first 2 weeks postonset of disease (POD) and reached 100% in both categories of patients.
Postonset Disease-Wise Seropositivity for IgA and IgG-Anti-SARS-CoV-2 Antibodies in Plasma/Sera of COVID-19 Patients
NA, not applicable; POD, postonset of disease; SARS-CoV-2, severe acute respiratory syndrome coronavirus 2.
Detection and quantification of IgG-SARS-CoV subtypes
To determine antibody titers induced after SARS-CoV-2 infection, quantitative ELISA was executed. The ELISA titers for IgA and IgG were found comparable (p = 0.190, Fig. 1A). IgG subtype titer evaluation was done in 135/146 samples that were positive for anti-SARS-CoV-2 IgG. Among IgG subtypes (Fig. 1B), IgG1 was the predominant subtype detected in 94/135 (69.6%), followed by IgG3 80/135 (59.3%), both suggestive of Th1 response. IgG2 and IgG4, which are result of Th2 response, were detected in 19/135 (14%) and 8/135 (5.9%) samples, respectively. Both IgG1 and IgG3 were present in 74 samples; IgG1 alone was present in 14, while IgG3 alone was present in 6 samples. IgG2 alone was present in 7 samples and IgG4 alone were present in 1 sample. IgG2 and IgG3 were detected in 1 sample. All the four subtypes were detected in 1 sample, while IgG1, IgG2, and IgG3 were present in 6 samples from 5 patients. Overall, positivity of Th1-induced subtypes (100/135, 74%) was higher (p < 0.0001) than Th2 directed (27/135, 20%).
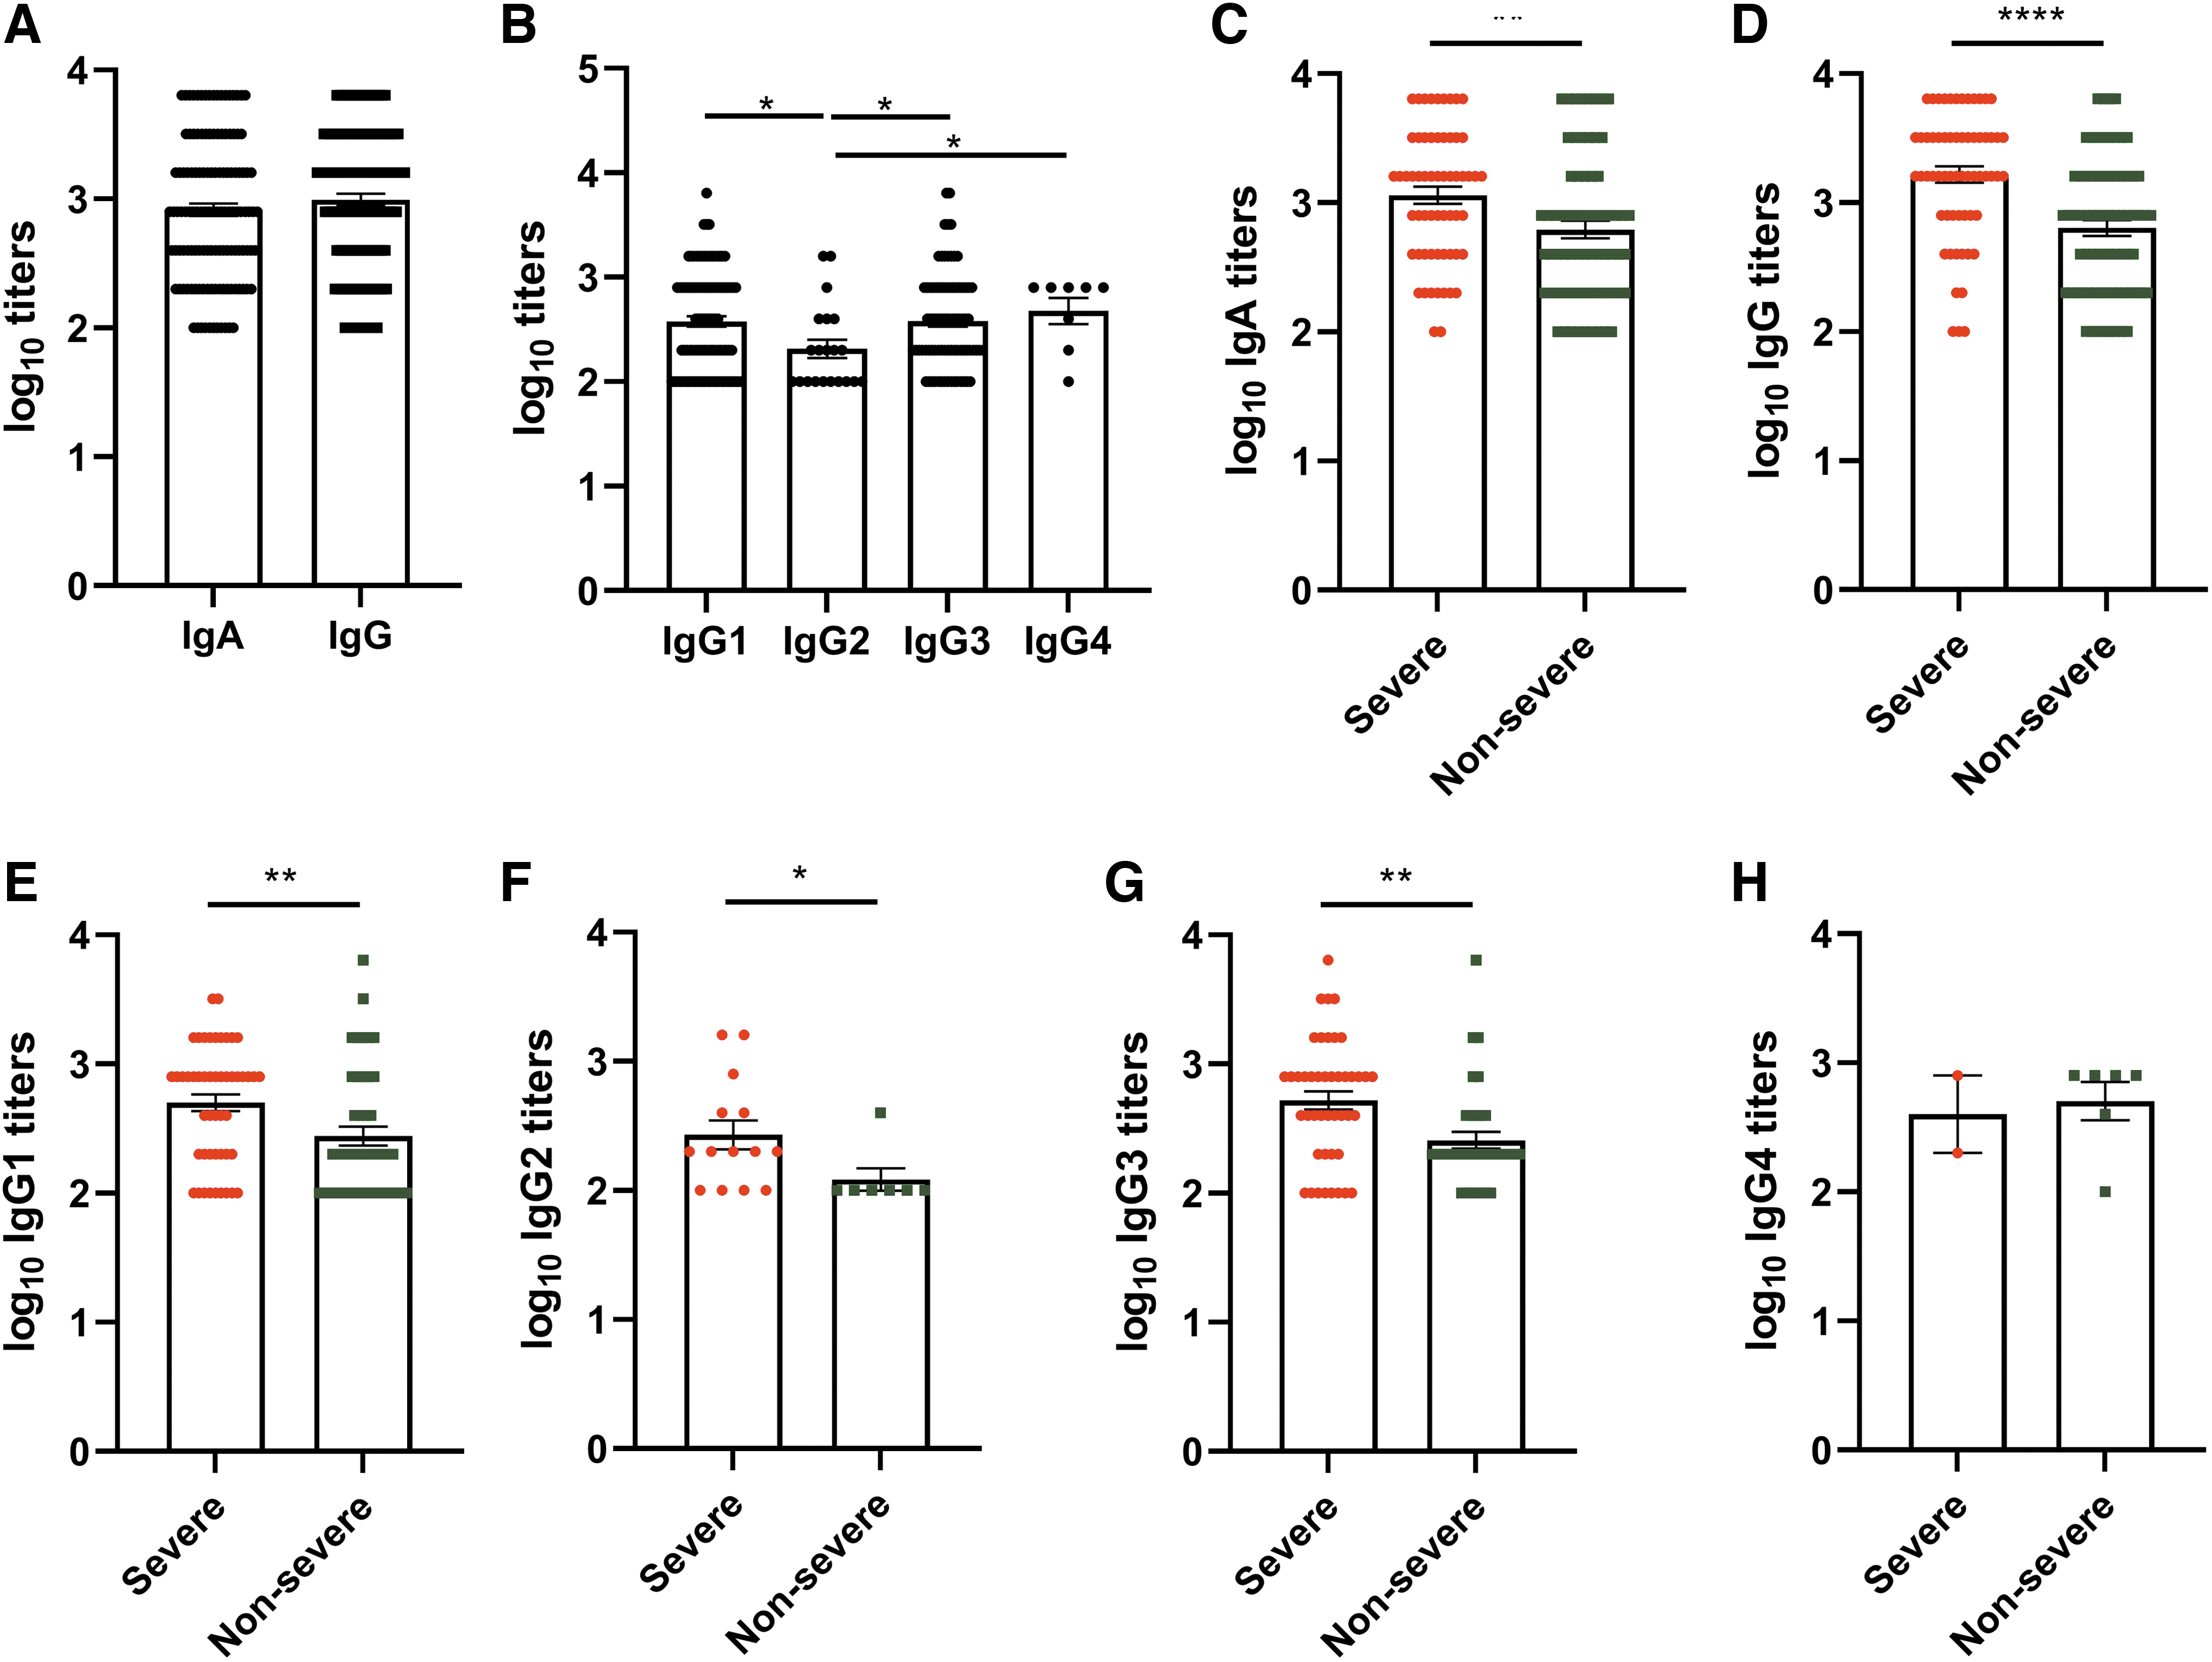
SARS-CoV-2 antibody responses in COVID-19 patients. Antibody titers were determined in 146 serum or plasma samples (64 severe, 69 nonsevere, and 13 asymptomatic). Serological response of
Severity-wise comparison of IgA and IgG antibody (Fig. 1C, D) highlighted significantly higher antibody titers in severe patients compared to nonsevere (p = 0.0015 to p < 0.0001). IgG subtype titer evaluation (Fig. 1E–H) also highlighted high induction of IgG1, IgG2, and IgG3 in severe patients (p = 0.033–0.0015).
Dynamics of IgA and IgG antibodies/subtypes
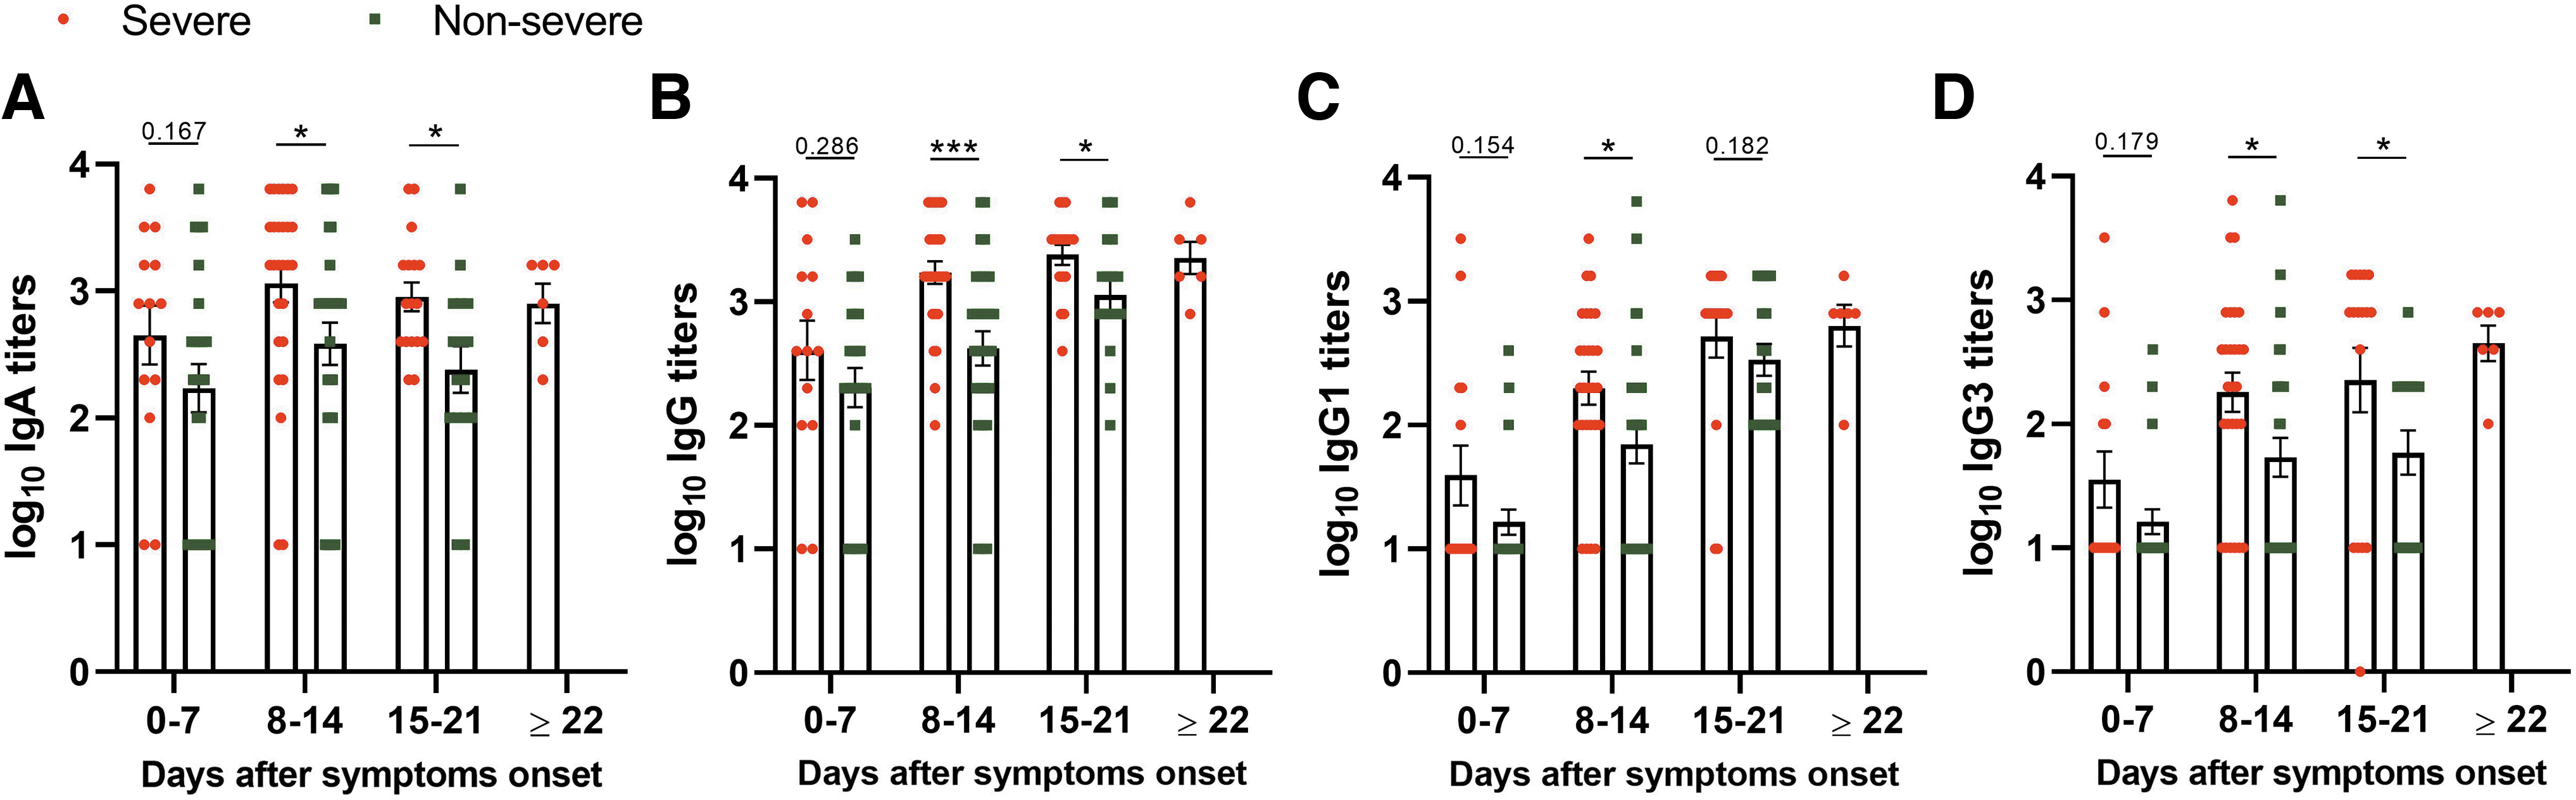
To understand the dynamics of IgA, IgG, and IgG subtypes in seropositive samples, ELISA titers were compared with respect to different times after onset of symptom. IgA and IgG titers were comparable during the first week (Supplementary Fig. S1) and showed approximately fivefold increase during the second week POD. A further rise in third week was seen for IgG in the third week (Fig. 2A, B). Antibody dynamics was similar for IgG1 and IgG3 antibodies (Fig. 2C, D). In addition, IgG1 titers showed higher correlation with IgG titers (r = 0.755) than with IgG3 (r = 0.579, Fig. 2E, F).

SARS-CoV-2-specific antibody titers at days after onset of symptoms. Samples (severe and nonsevere, n = 133) from patients with symptoms were used to determine
Antibody titers in relation to disease severity
Next, a comparison of antibody titers with disease severity and duration was made (Fig. 3). For IgA, IgG, and IgG3, significantly higher titers were recorded in severe disease patients, during second and third weeks. For IgG1, the difference was only seen during the second week. However, by the third week, IgG levels were higher than IgA in severe (p = 0.006) and nonsevere (p = 0.017) patients.
SARS-CoV-2-specific antibody titers on days after onset of symptoms in severe and nonsevere COVID-19 patients. Samples, severe (n = 64) and nonsevere (n = 69), from patients with symptoms were used to determine
Correlation analysis among different antibodies tested
Furthermore, a correlation of IgA and IgG antibodies in COVID-19 patients, in relation to OD values obtained in ELISA (Fig. 4A–C) and titers of respective antibodies (Fig. 4D–F), was obtained. Significant correlation was seen when all the patients irrespective of disease severity (r = 0.627 and 0.6, respectively) and patients with mild disease (r = 0.639 and 0.664, respectively) were considered. In patients with severe disease, the correlation was weak (r = 0.322 and 0.313, respectively).
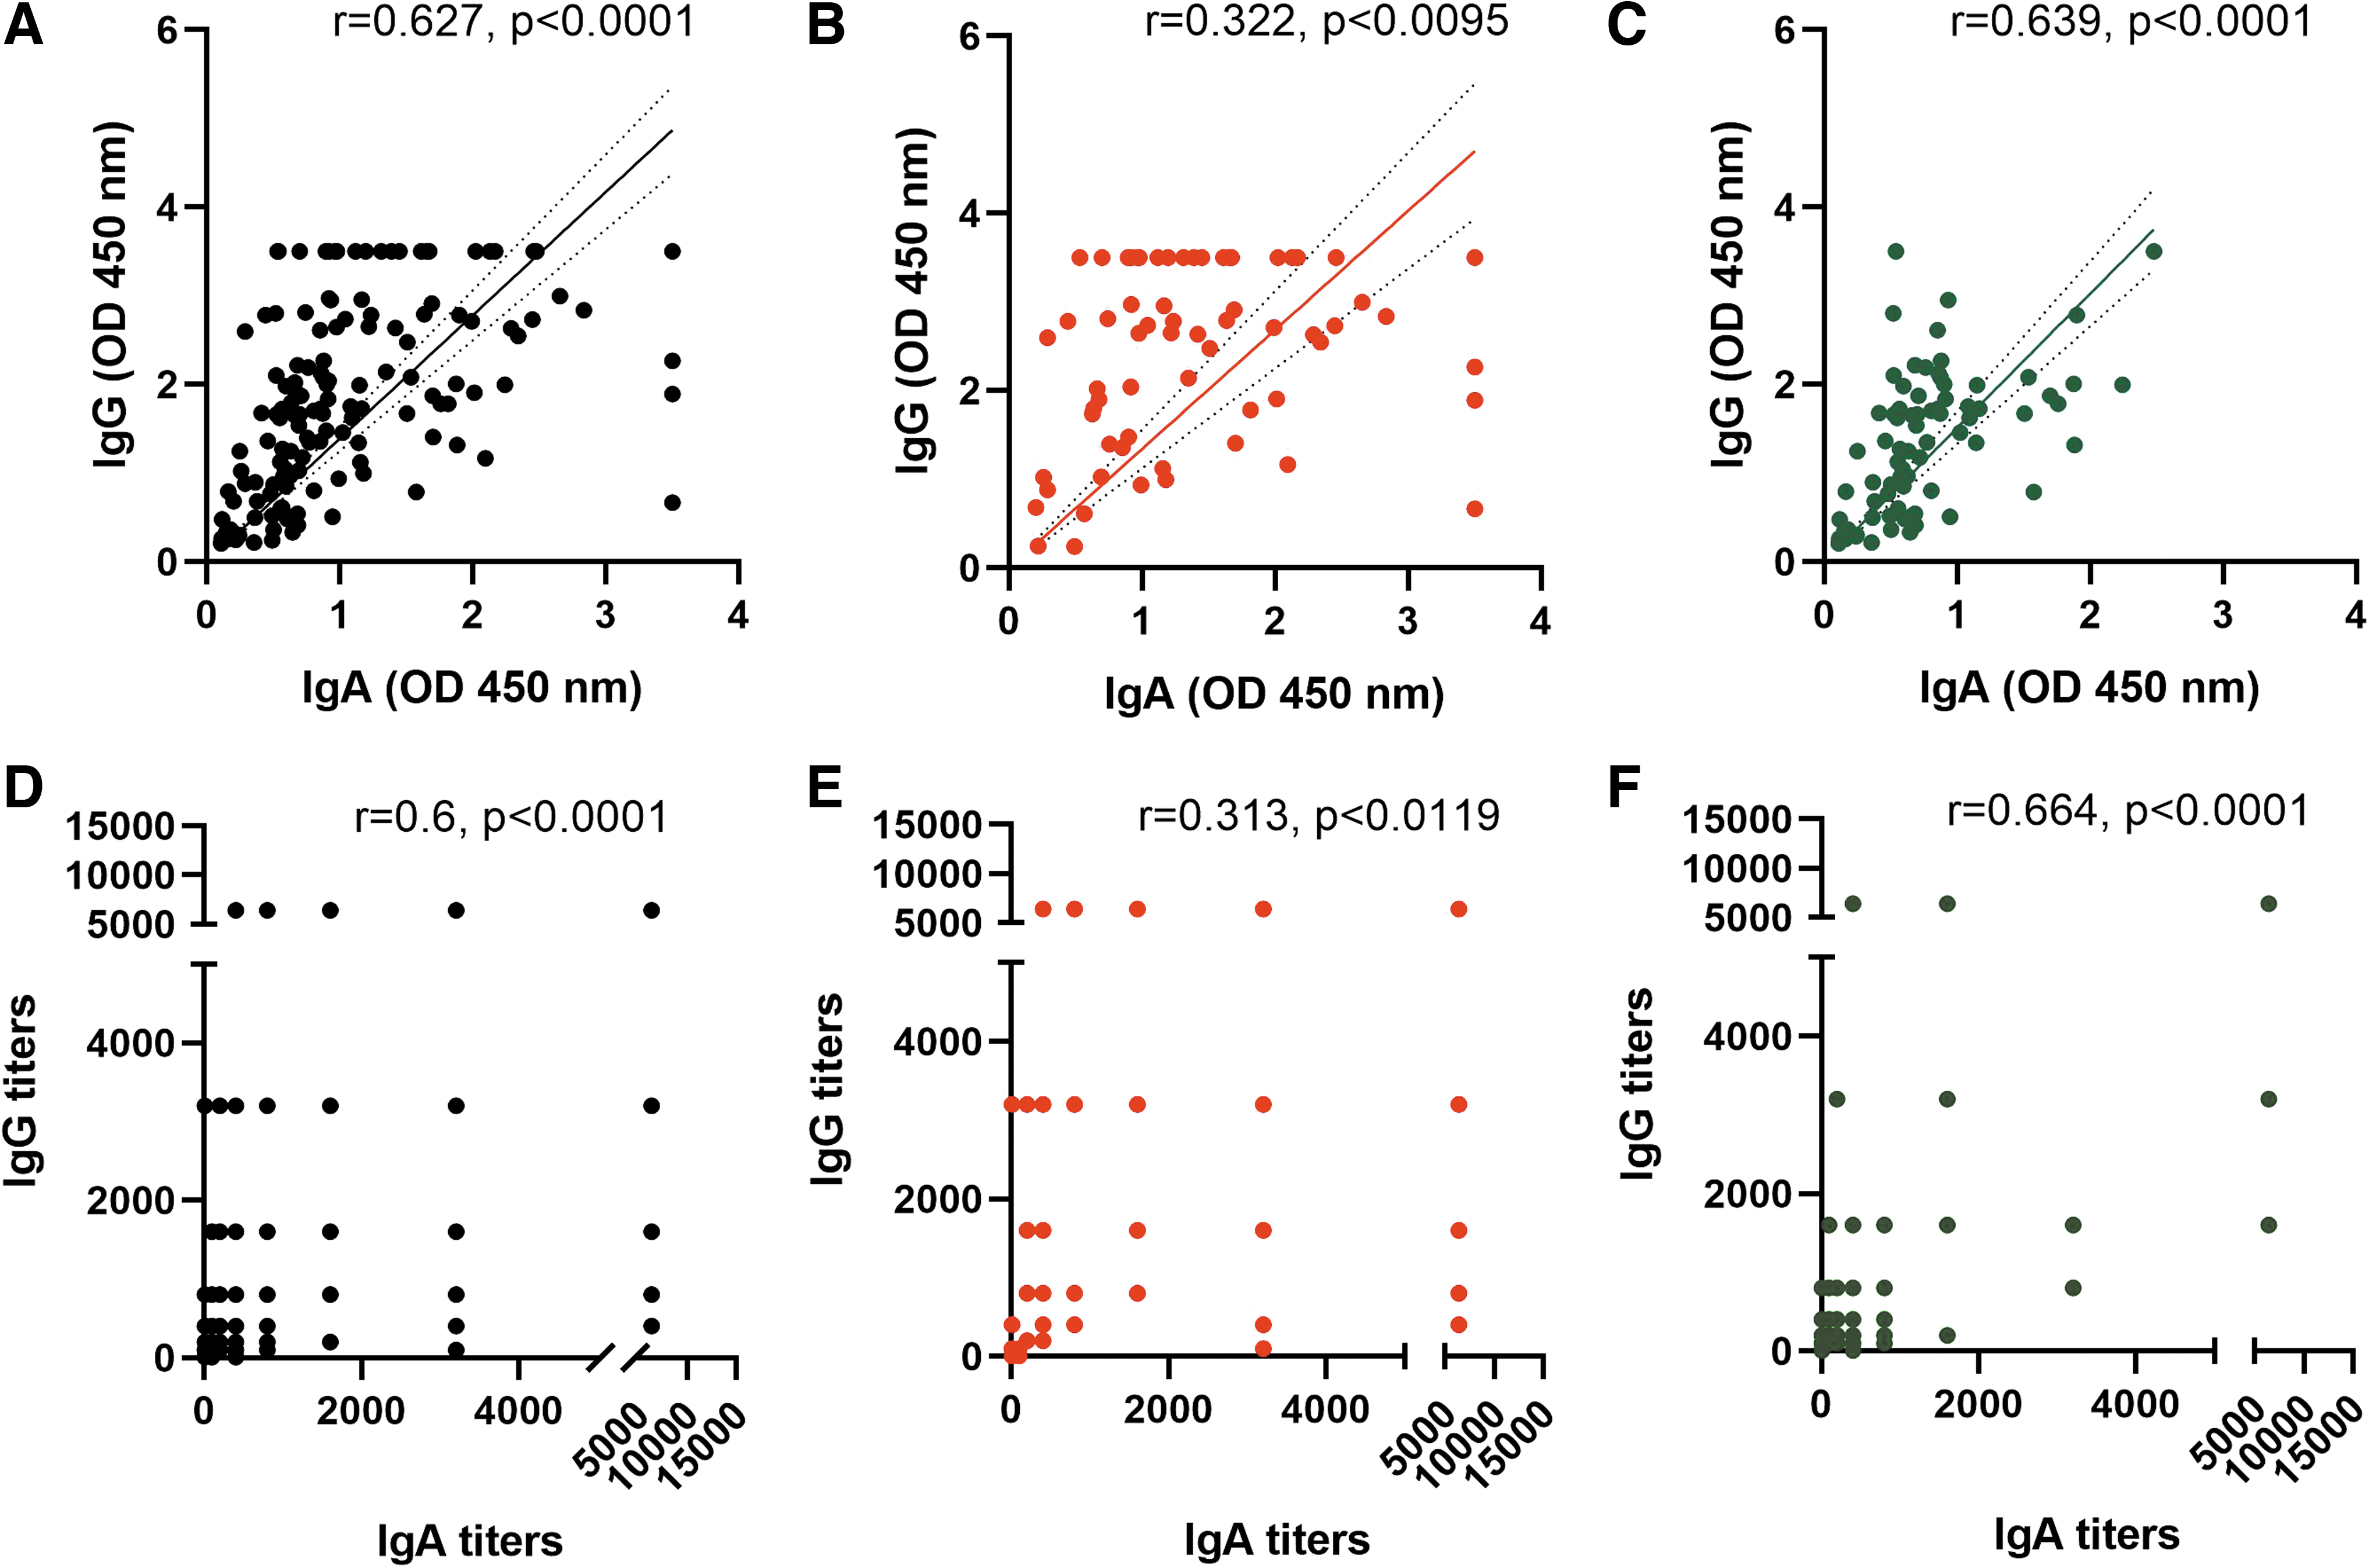
Correlation between IgA and IgG absorbance or titers from COVID-19 patients. Spearman correlation was obtained for 146 samples (64 severe, 69 nonsevere, and 13 asymptomatic). Absorbance between IgA and IgG is correlated in
Correlation analysis among binding and Nab titers
To understand the relationship of binding antibodies (ELISA) and neutralizing antibodies (PRNT), a separate analysis was undertaken. Both IgA (r = 0.562, p < 0.0001) and IgG (r = 0.502, p < 0.0001) correlated with neutralizing antibodies (Fig. 5A, B). Titers correlated better with IgG1 (r = 0.537, p < 0.0001) than IgG3 (r = 0.459, p < 0.0001). In severe patients, correlation between binding and neutralizing antibodies was stronger with IgA (r = 0.539) than IgG (r = 0.313) (Fig. 5E–H).
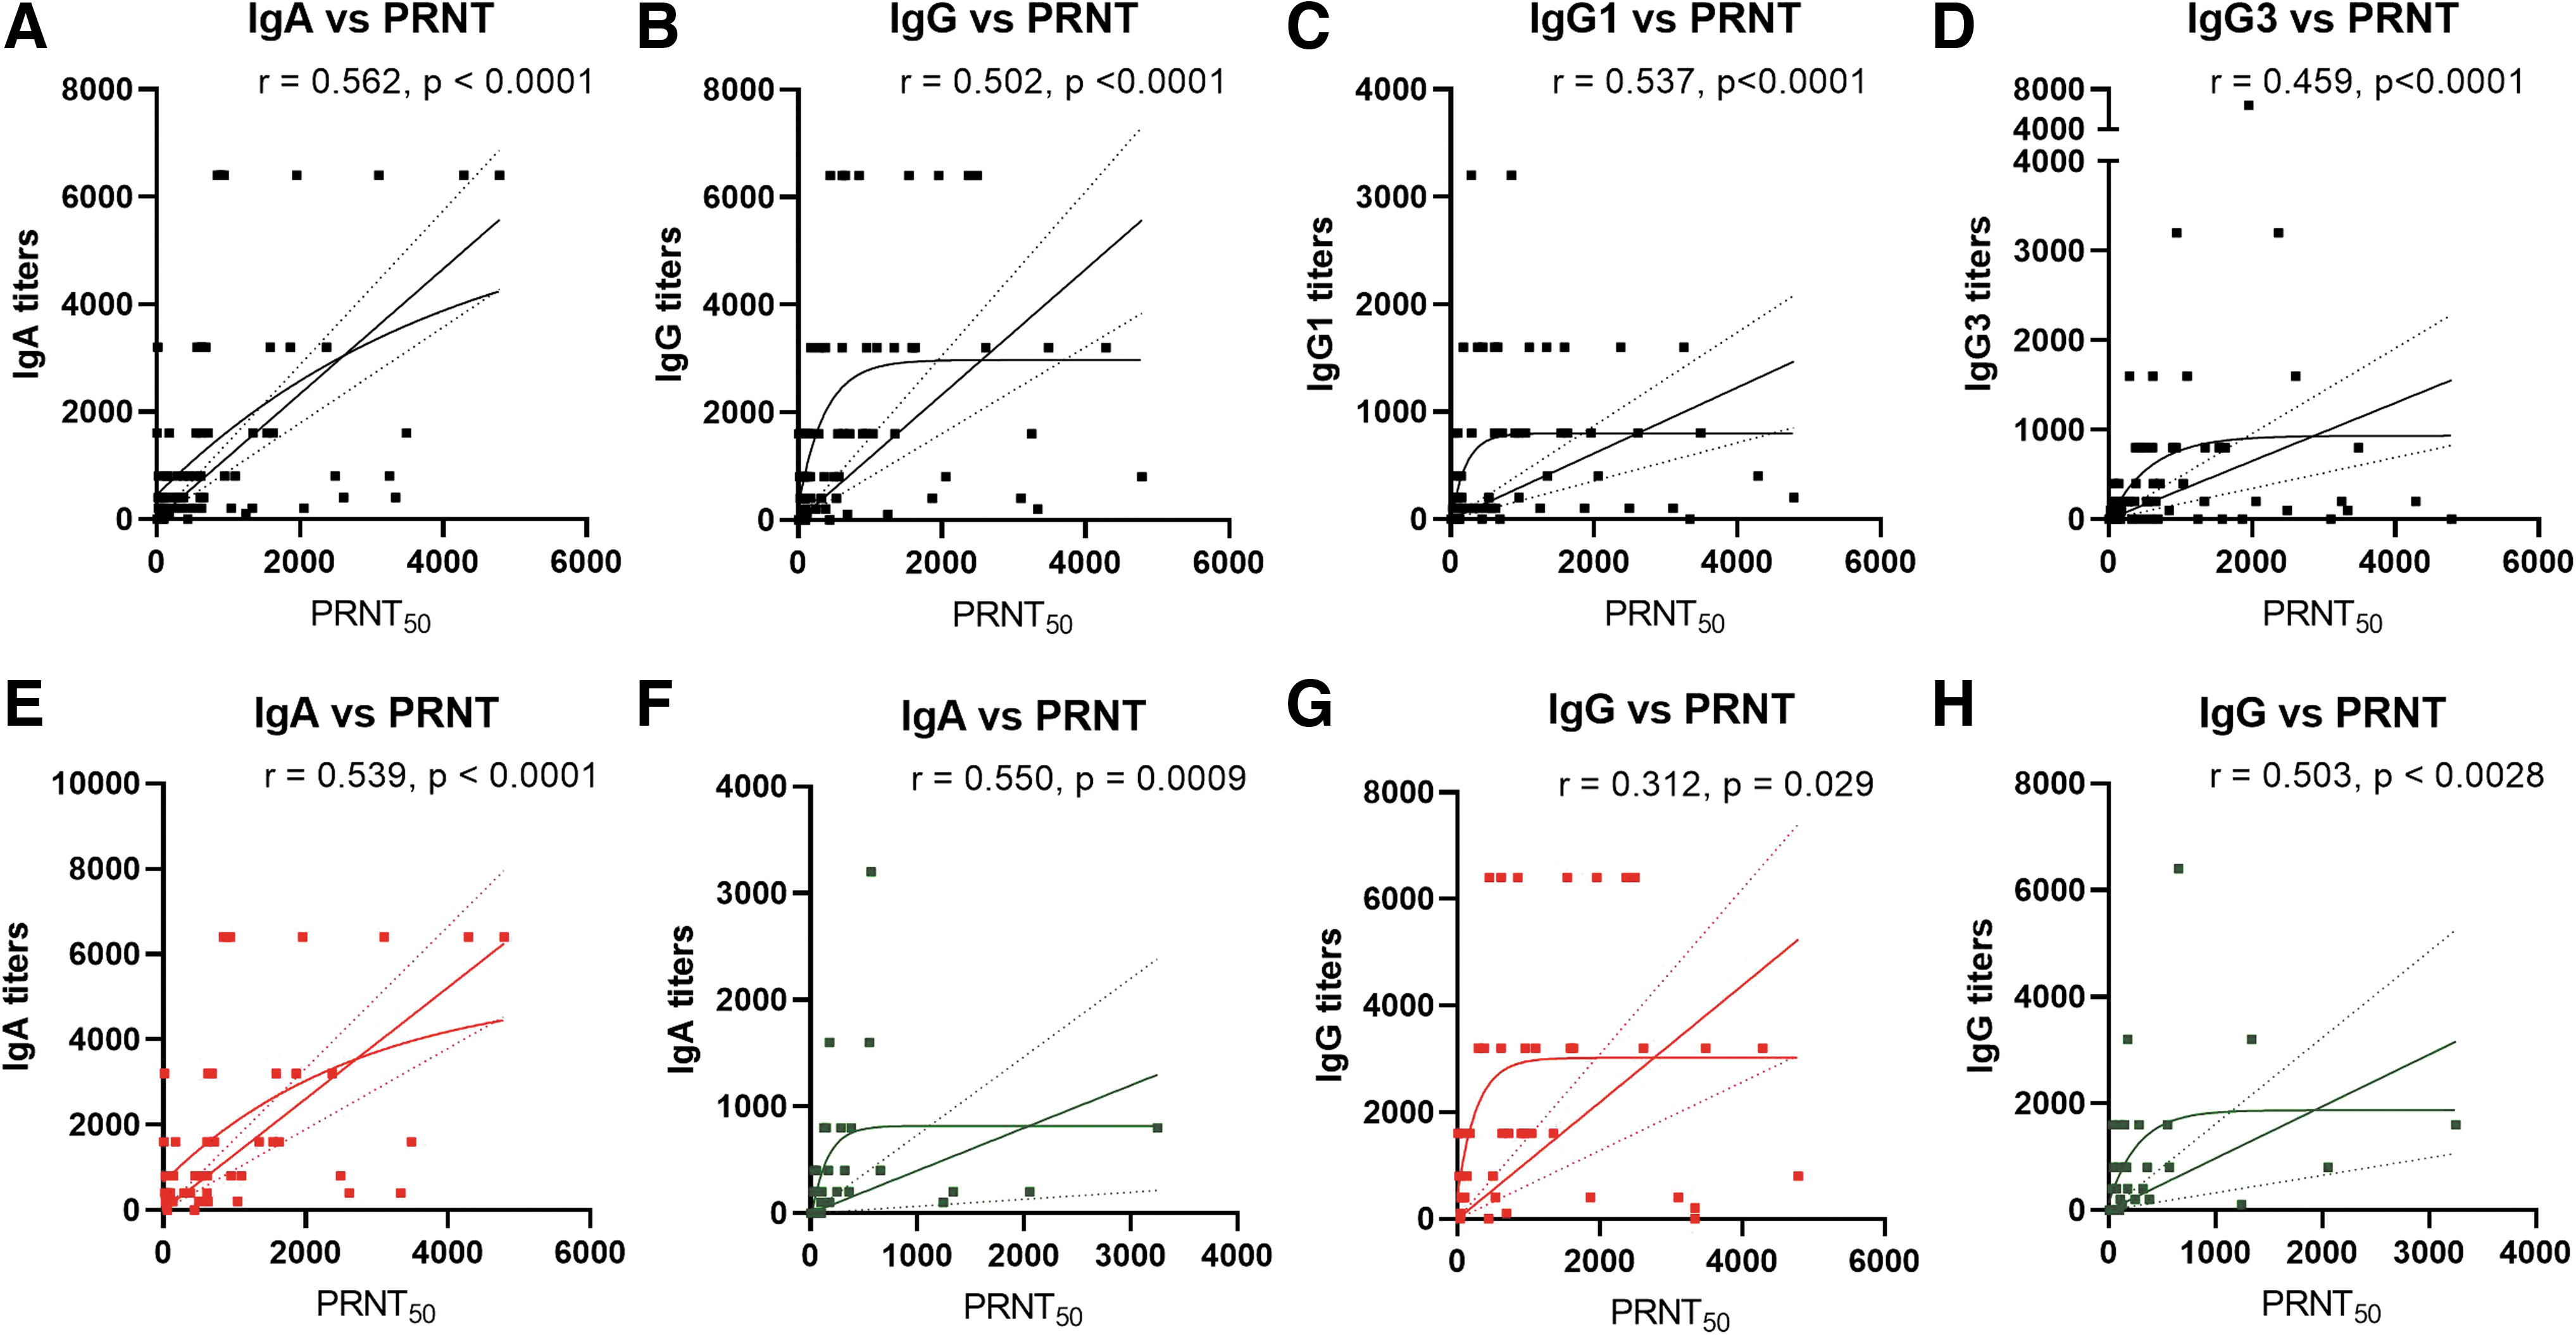
Correlation of SARS-CoV-2-specific antibody titers obtained by neutralizing antibody titers obtained by PRNT50 assay and ELISA. Each dot represents a correlation of PRNT50 titer with
Discussion
This study provides a comprehensive, quantitative, and comparative dynamics of IgA and IgG-anti-SARS-CoV antibodies/IgG subtypes in COVID-19 patients with respect to disease duration and severity. For this, ELISA employing inactivated virus for coating the wells was used (13). Almost 75% of the patients screened during the first symptomatic week were positive for both IgA and IgG antibodies, reaching 100% in the third week. Titers of both the antibodies were comparable in different weeks after disease onset. Kinetics of these antibodies was reported previously on the basis of ELISA OD values or OD ratio (21,29), which do not always correspond to the actual titers. Higher IgA antibody titers early in the disease course suggest longer incubation period/duration of asymptomatic phase. However, based on the available history of contact with a COVID-19 patient and disease onset (data not shown), this may not be the primary reason. Early IgA induction in the respiratory tract may be the characteristic of this respiratory virus (18,26). Notably, in COVID-19 patients, recirculating IgA-secreting plasmablasts with a mucosal-homing profile were detected in high numbers systemically and could seed lung/airway interface (9,19,26).
Similarities and differences were noted when IgA and IgG antibody titers were compared with respect to disease severity and duration. During the first week, levels of both the antibodies did not differ among patients with severe or nonsevere disease. Subsequent rise was recorded in the severe cases with higher levels of IgG than IgA. Thus, binding antibody titers during early disease phase were independent of disease severity. This is in contrast to neutralizing titers determined by PRNT. During the first week itself, higher neutralizing titers were seen in severe disease (our unpublished observations). The role of non-neutralizing antibodies in disease pathogenesis remains unexplored. The possibility of alveolar transudation of high titer IgA/IgG antibodies leading to formation of immune complexes aiding lung injury cannot be ruled out (3,4).
In our study, BPL-inactivated SARS-CoV-2 ELISA was used as a coating antigen, which showed ∼75% IgA or IgG positivity in the first week POD. Other studies, employing different diagnostic methods, reported early (days <5 to 10) IgA positivity of 50 to 93% (10,18,23,30). The pattern of IgA/IgG antibody titers in relation to disease duration was similar when recombinant nucleoprotein (10) or whole virus (this study) was used. We found comparable IgA/IgG titers during the first 2 weeks, while IgA titers were lower than IgG when receptor binding domain (RBD) was used for coating (28).
In the case of IgG, positivity varied between 19% and 100% during the early disease phase when different screening methods were used (16,24,27,33). Of note, inactivated virus, recombinant antigens containing nucleoprotein, and a peptide from the spike protein of SARS-CoV-2 (17) could differentiate severe disease by lower titers in the first week and subsequent significant rise. Phenotyping of antibody response revealed predominant induction of IgG1 (69.6%) and IgG3 (59.3%) reflecting Th1 response, while Th2-dependent IgG2 and IgG4 subtypes were infrequent. Similar findings were reported with nucleoprotein or RBD (17), while higher IgG3 reactivity was observed with soluble spike protein (2). We observed lower IgG1/IgG3 ratio in severe (1.9) compared to nonsevere (2.4) cases, suggesting IgG subtypes might be associated with disease severity. These observations are particularly important because IgG3 is the most polyfunctional of the IgG subclasses, eliciting the widest range and most potent Fc effector functions like complement activation and antibody-dependent cytotoxicity (7). More importantly, Yates et. al demonstrated spike-specific IgG1, and not IgG3 was closely correlated with in vitro viral neutralization, and greater proportion of S1 or RBD-specific IgG3 was associated with COVID-19 disease severity (32). The dynamics of IgG1 and IgG3 was similar to IgG when duration or severity was considered, with IgG1 showing no difference in the third week.
Correlation analyses among different antibodies led to some interesting findings. In nonsevere patients, a perfect correlation of IgA and IgG titers and OD values was seen, which was lost during the severe disease. Both IgA and IgG/subtypes (binding antibodies) correlated with neutralizing antibodies (PRNT); IgA and IgG1 showed better correlation. Neutralizing capacity of IgA alone needs to be clarified. IgA serum levels have been correlated with SARS-CoV-2 neutralization (29) and influenza vaccine efficacy (1,15).
In summary, our study provides useful information on comparative dynamics of IgA/IgG/IgG subtypes in severe/nonsevere COVID-19. While not differing during the first week, severe disease was characterized by subsequent rise in these antibodies. The observed correlation of various antibodies in mild, but not in severe disease is significant. Of note, IgA and IgG1 antibodies correlated better with neutralizing antibodies. Our observations may help in designing vaccine response/efficacy studies. The role of IgA as well as IgG subtypes, especially IgG1 and IgG3, in protection/pathogenesis needs to be explored in depth.
Footnotes
Acknowledgment
We thank medical staff from Bharati Medical Hospital, Katraj-Dhankawadi, Pune-411043, India, for sample collection.
Authors' Contributions
Conceptualization, H.P.P. and V.A.A.; methodology, H.P.P., P.S.R., S.S., and S.P.; software, H.P.P.; validation, H.P.P., P.S.R., and S.S.; formal analysis, H.P.P. and S.S.; investigation, H.P.P. and V.A.A.; resources, V.A.A., A.C.M., and S.L.; data curation, H.P.P. and V.A.A.; writing-original draft preparation, H.P.P. and V.A.A.; writing-review and editing, V.A.A.; visualization, H.P.P. and V.A.A.; supervision, V.A.A.; project administration, V.A.A., A.C.M., and S.L; funding acquisition, V.A.A. and A.M. All authors have read and agreed to the published version of the article.
Author Disclosure Statement
No competing financial interests exist.
Funding Information
The research was funded by Interactive Research School for Health Affairs, Bharati Vidyapeeth (Deemed to be University), Pune.
Supplementary Material
Supplementary Figure S1
References
Supplementary Material
Please find the following supplemental material available below.
For Open Access articles published under a Creative Commons License, all supplemental material carries the same license as the article it is associated with.
For non-Open Access articles published, all supplemental material carries a non-exclusive license, and permission requests for re-use of supplemental material or any part of supplemental material shall be sent directly to the copyright owner as specified in the copyright notice associated with the article.