




Abstract
This study aims to evaluate the estimate of causal relationship between Epstein-Barr virus (EBV) antibody levels and autoimmune diseases (AIDs), such as rheumatoid arthritis (RA) and systemic lupus erythematosus (SLE), through bidirectional two-sample Mendelian randomization (MR) analysis. Despite 50 years of research into the link between EBV infection and AIDs, inconsistent results persist due to the complex mechanisms of EBV within the body. We utilized large-scale genome-wide association studies (GWAS) data from the Integrative Epidemiology Unit (IEU) Open GWAS Project database to conduct rigorous MR analysis, incorporating various sensitivity analyses to assess potential impacts and ensure robustness. EBV antibodies (including VCA-IgG, ZEBRA-IgG, EBNA-1-IgG, and EA-D-IgG) were used as exposure variables, whereas RA and SLE served as outcome variables. In the reverse analysis, RA and SLE were treated as exposure variables and EBV antibodies as outcome variables. When EBV antibodies are designated as the exposure variables, the random-effects inverse-variance weighted (IVW) analysis indicated a significant negative genetic causal relationship between EBV EA-D antibody levels and RA (p = 0.007, odds ratio [OR] = 0.700, 95% confidence interval [CI] = [0.539–0.907]). No significant genetic causal relationship was found between SLE and EBV antibody levels. When RA and SLE are designated as the exposure variables, the random-effects IVW analysis revealed significant positive genetic causal relationships between SLE and EBV ZEBRA antibody levels (p = 0.009, OR = 1.028, 95% CI = [1.007–1.050]) and EBV EA-D antibody levels (p = 0.005, OR = 1.032, 95% CI = [1.009–1.054]). No significant genetic causal relationship was observed between RA and EBV antibody levels. This study offers compelling evidence of a causal relationship between EBV antibody levels and AIDs through MR analysis. Our findings lay a new foundation and perspective for future research directions, clinical prognosis, and treatment.
Introduction
Autoimmune diseases (AIDs) are characterized by an aberrant immune response that targets the body’s own tissues, resulting in significant damage. Rheumatoid arthritis (RA) and systemic lupus erythematosus (SLE) are two prevalent AIDs that profoundly impact patients’ quality of life and place substantial burdens on health care systems and society. Increasing evidence suggests that both environmental and genetic factors play crucial roles in the pathogenesis of AIDs. Among these factors, the association between Epstein-Barr virus (EBV) infection and AIDs has garnered considerable attention. Numerous studies have proposed a potential link between EBV and the development of autoimmune conditions, underscoring the need for further investigation into the underlying mechanisms and causal relationships.
EBV is a pervasive pathogen that infects over 90% of the global population (Smatti et al., 2018) and is associated with the onset and progression of various diseases, including certain autoimmune conditions (Bo et al., 2018; Xuan et al., 2020). Following EBV infection, the body generates multiple antibodies against the virus, such as the EBV capsid antigen antibody (VCA-IgG), the early antigen (ZEBRA) antibody, the EBV nuclear antigen-1 antibody (EBNA-1-IgG), and the early antigen D antibody (EA-D-IgG). These antibodies can serve as markers indicating the timing of EBV infection (De Paschale and Clerici, 2012). Variations in antibody levels might be associated with the risk of developing AIDs, but concrete causal evidence remains elusive.
Mendelian randomization (MR) analysis is a method that utilizes genetic variation to investigate the causal relationships between exposures and diseases. This approach leverages genetic variants as instrumental variables (IVs), which can mitigate the impact of confounding factors and reverse causality—challenges often encountered in traditional observational studies. In recent years, MR analysis has gained increasing popularity in epidemiology, providing novel insights into the mechanisms underlying complex diseases.
In this study, we conducted a two-sample MR analysis. Initially, we used EBV antibodies (including VCA-IgG, ZEBRA-IgG, EBNA-1-IgG, and EA-D-IgG) as exposures and RA and SLE as outcomes. Subsequently, we performed a reverse MR analysis, with RA and SLE as exposures and EBV antibodies as outcomes. We adhered to a rigorous MR analysis protocol, incorporating IV selection, sensitivity analyses, and pleiotropy testing to ensure the robustness and reliability of our findings. Through this approach, we aim to provide a more accurate assessment of the estimate of causal relationships between EBV antibody levels and AIDs, thereby offering a scientific foundation for future research directions and clinical treatments.
Materials and Methods
Study design
A two-sample MR analysis was performed for AIDs, including RA and SLE, and EBV antibodies (VCA-IgG, ZEBRA-IgG, EBNA-1-IgG, and EA-D-IgG). The analysis consisted of two steps. In the first step, EBV antibodies were used as the exposures, and RA and SLE as the outcomes in the MR analysis. In the second step, a reverse MR analysis was conducted with RA and SLE as the exposures and EBV antibodies as the outcomes. This study strictly adhered to MR guidelines, following the fundamental assumptions of MR analysis: (1) establishing a strong association between IVs and exposure; (2) ensuring the independence of IVs from potential confounders; and (3) confirming that IVs affect the outcome only through the exposure.
Data source
The GWAS summary data for this study were obtained from the IEU Open GWAS Project database, accessible at (mrcieu.ac.uk). Table 1 provides detailed demographic information for all data sources. All cases were identified using the M13 code in the International Classification of Diseases, 10th Edition. All participants for both AIDs and EBV antibodies had a common European ancestry. Furthermore, due to the public accessibility of the data, this study did not require an ethical statement or informed consent.
Detailed Demographic Information for All Data Sources
EBV, Epstein-Barr virus; RA, rheumatoid arthritis; SLE, systemic lupus erythematosus.
IV selection
It is well known that strict selection of IVs is essential for ensuring the robustness of MR analysis results. First, IVs need to show a strong association with the exposure, with the criteria for establishing a substantial association being p < 5e-8. However, due to the limited number of single-nucleotide polymorphisms (SNPs) associated with EBV antibodies, the correlation criteria were relaxed to p < 5e-6. A detailed screening process was then performed to exclude the effect of linkage disequilibrium (LD), ensuring that SNPs exhibit minimal LD (r 2 < 0.001 and k > 10,000 KB). Subsequently, the F-test was conducted, and SNPs with F-statistics >10 were included as IVs. The F-statistic is calculated using the formula F = R 2(N − K − 1)/K(1 − R 2). Additionally, the selected IVs must not have a significant correlation with the outcome. Therefore, SNPs associated with the outcome were removed using the PhenoScanner database. Any potential confounding factors identified on the UK Biobank (UKB) website were excluded with a threshold of p < 5e-8. Finally, SNPs characterized by palindromic sequences and intermediate allele frequencies were systematically excluded from the analysis. Multieffect and heterogeneity analysis was performed using MR Pleiotropic Residual Sum and Outlier (MR-PRESSO). If significant outliers were identified, they were excluded from the final selection of IVs.
MR analysis
Inverse-variance weighting (IVW) analysis is considered one of the most effective methods for MR analysis. When there is no pleiotropy of IVs and the sample size is sufficiently large, IVW estimates are consistent, valid, and close to the true value. Therefore, the primary analysis method used in this study is the random-effects IVW method. Additionally, we employed four complementary methods—MR-Egger, weighted median, simple model, and weighted model—to provide more reliable estimates of causality. Scatter plots were used to illustrate causal estimates from the primary and supplementary MR analyses. Forest plots depicted single SNP estimates from exposure to outcome, while a funnel plot was utilized to show the distribution of individual SNP effects.
Sensitivity analysis
Sensitivity analysis is a crucial method for evaluating the robustness of MR analysis results. Given the inherent diversity of GWAS aggregated data, potential heterogeneity in MR analyses has traditionally not been considered a factor significantly affecting the accuracy of genetic causal inference results. Our study integrates two different approaches to examine the presence of heterogeneity: Cochran’s Q statistics applied to MR-IVW and Rucker’s Q statistics applied to MR-Egger. A p-value of <0.05 was considered indicative of significant heterogeneity. It is essential to emphasize that the absence of horizontal pleiotropy is a fundamental prerequisite for the validity of MR analysis results. To evaluate the potential presence of horizontal pleiotropy, intercept tests within the MR-Egger framework were used, where a p-value >0.05 indicated no horizontal pleiotropy. Additionally, the MR-PRESSO method was utilized due to its increased statistical power in detecting horizontal pleiotropic effects. MR-PRESSO was applied to identify and subsequently exclude outliers in MR analysis. Furthermore, a “leave-one-out” analysis was performed to determine the potential impact of individual SNPs on genetic causal inference.
Statistical analysis
The “TwoSampleMR” software package was used for the two-sample MR analysis, and the “MR-PRESSO” software package was utilized for the MR-PRESSO test. All statistical analyses were performed using R version 4.3.2. A significance level of p < 0.05 was used to infer genetic causality. Specifically, a p-value <0.05 combined with an OR >1 indicates positive genetic causality, while an OR <1 indicates negative genetic causality. Additionally, a p-value >0.05 indicates no genetic causation.
Results
EBV antibodies as exposures, RA and SLE as outcomes
Results of IV selection
Figure 1 shows the screening status of all IVs. There are 18 SNPs strongly associated with the EBV ZEBRA antibody. Finally, 10 SNPs were selected from the aggregated GWAS data for RA and designated as IVs, as shown in Supplementary Table S1. Twelve SNPs were selected as IVs from the aggregated GWAS data for SLE, as shown in Supplementary Table S2. We identified a total of 18 SNPs that were significantly correlated with EBV VCA-p18 antibody levels. From the aggregated GWAS data for RA and SLE, 13 SNPs and 14 SNPs were finally selected to meet the IV standard, respectively. For details, see Supplementary Tables S3 and S4. There were 21 SNPs that were significantly associated with EBV EBNA-1 antibody levels. Fifteen SNPs were collected from RA’s GWAS summary data, and the remaining 11 SNPs were designated as IVs, as detailed in Supplementary Table S5. Seventeen SNPs were collected from the aggregated GWAS data for SLE, and ultimately, the remaining 13 SNPs were designated as IVs, as detailed in Supplementary Table S6. We identified a total of 11 SNPs that were significantly correlated with EBV EA-D antibody levels. Nine SNPs each were collected from the GWAS summary data for RA and SLE. Finally, the remaining four SNPs and five SNPs were designated as IVs, as shown in Supplementary Tables S7 and S8.
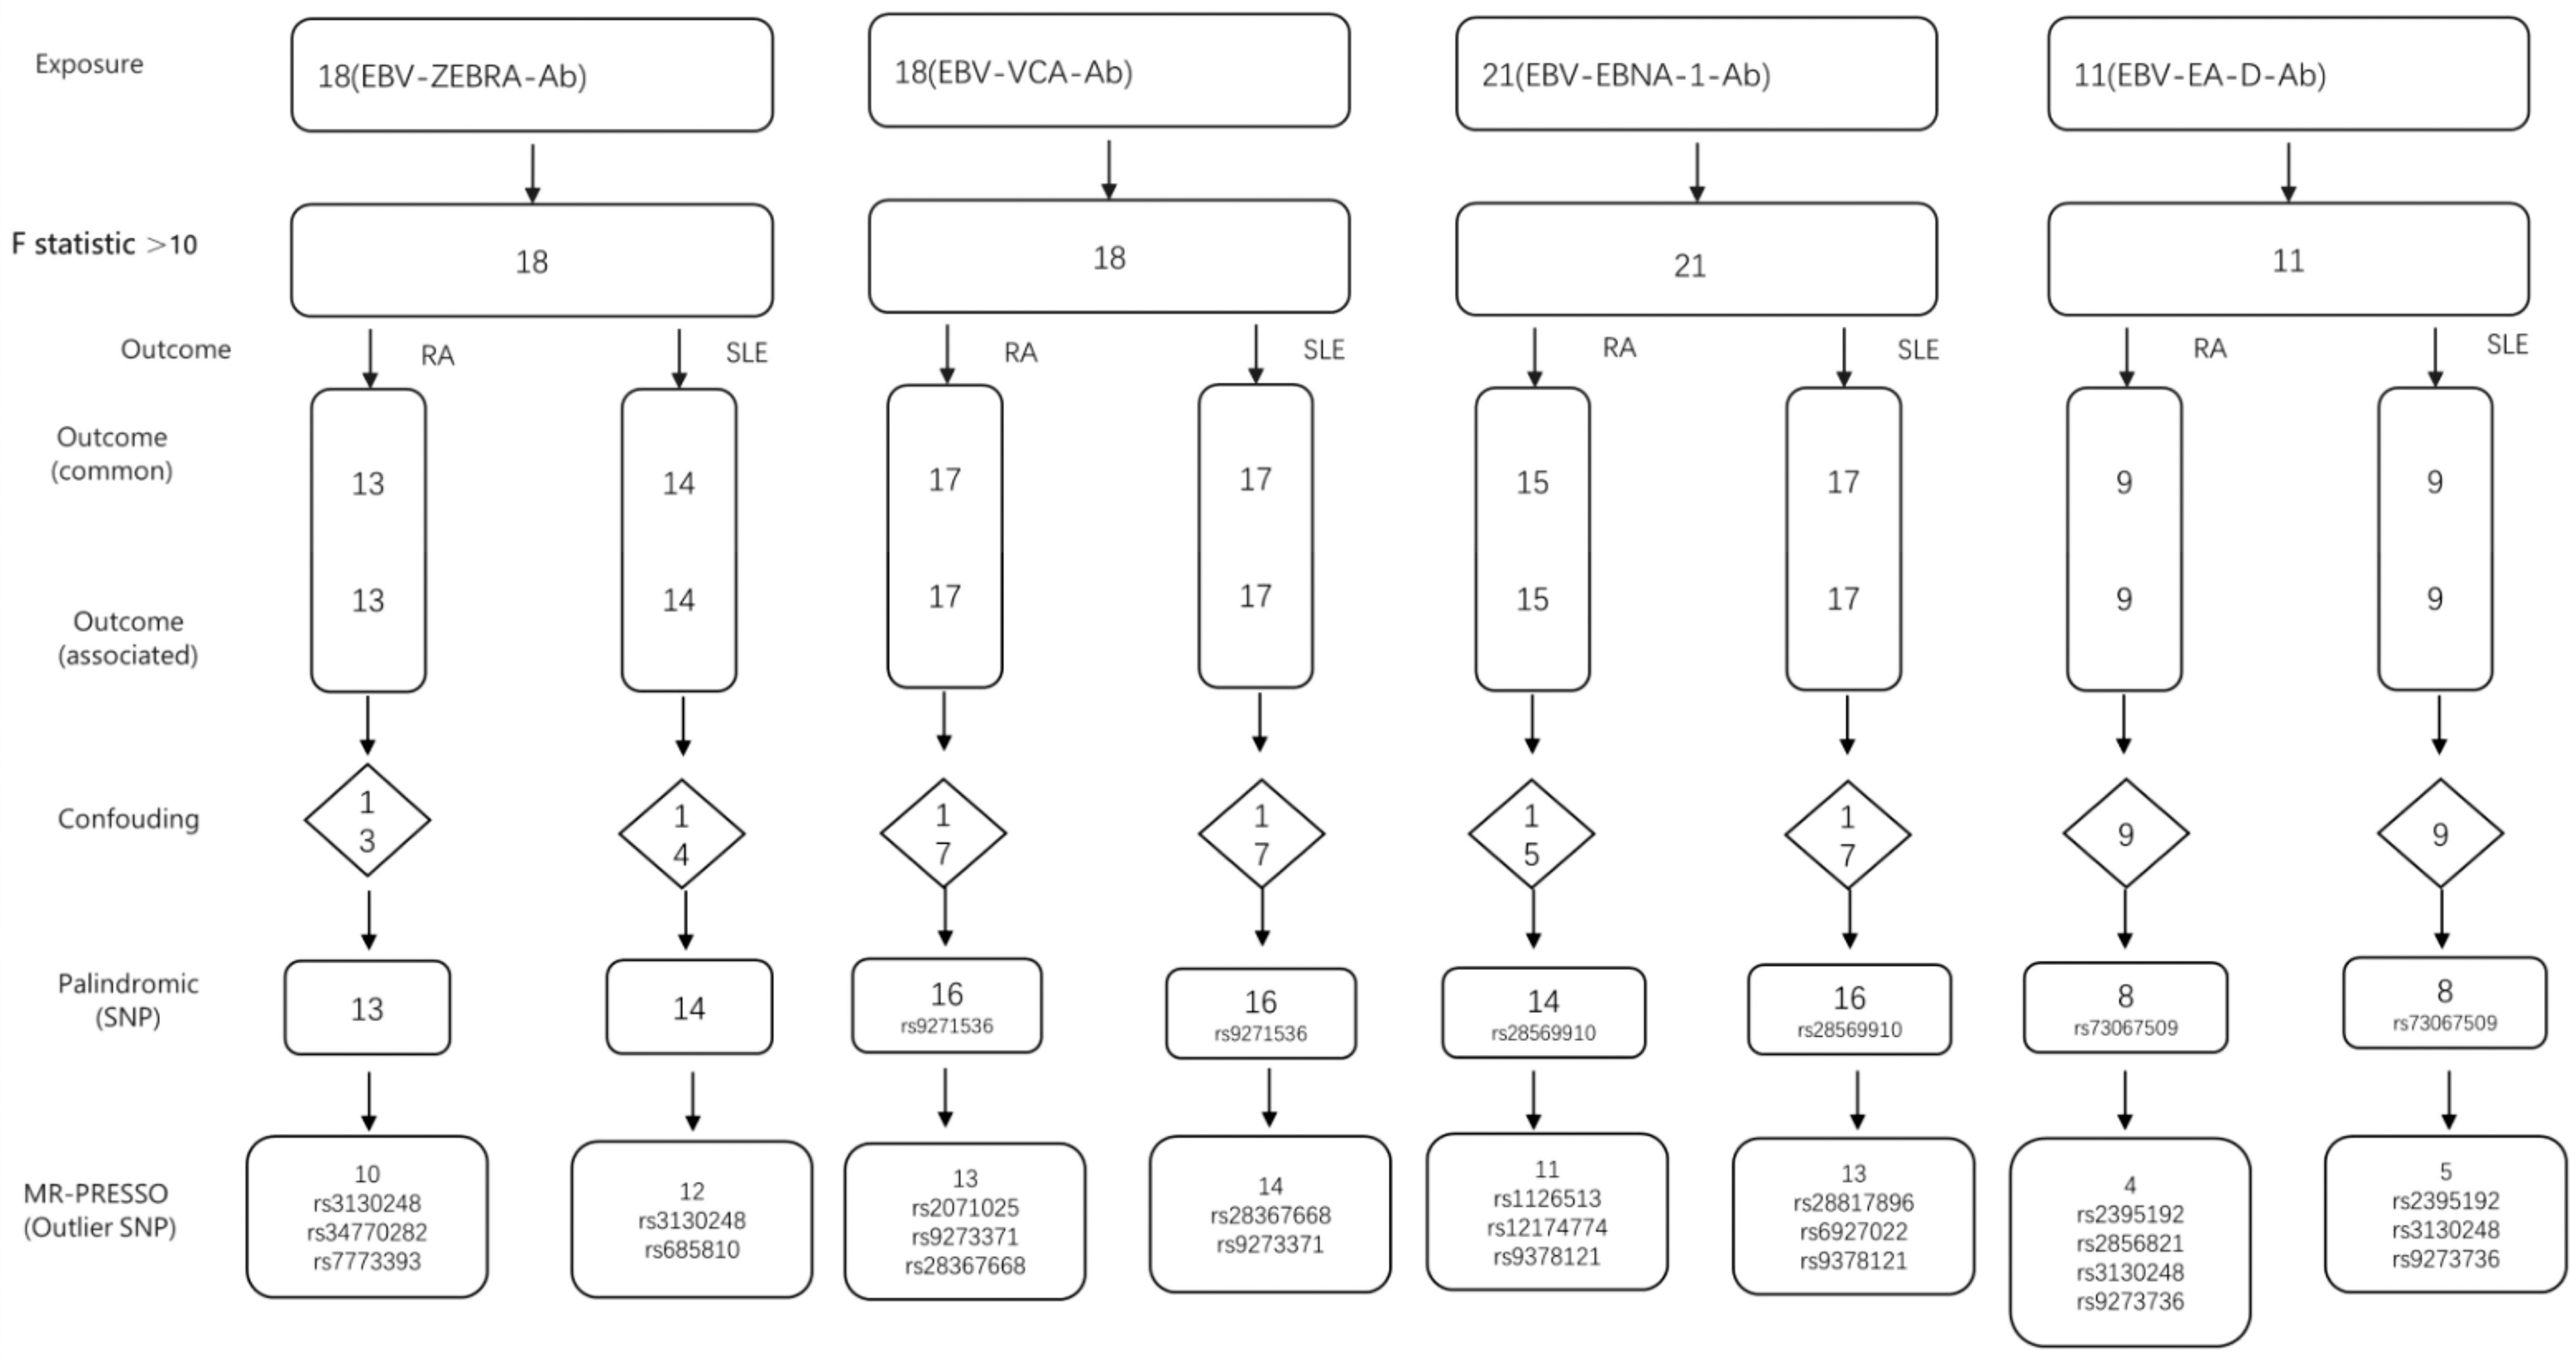
The screening status of all instrumental variables of (EBV antibodies as exposures, RA and SLE as outcomes). EBV, Epstein-Barr virus; RA, rheumatoid arthritis; SLE, systemic lupus erythematosus.
MR results
The main results of the MR analysis are shown in Supplementary Table S9, and the primary IVW analysis is illustrated in Figure 2. The random-effects IVW analysis indicated that EBV EA-D antibody levels had a significant negative genetic estimate of causal relationship with RA (p = 0.007, OR = 0.700, 95% CI = [0.539–0.907]). There were no significant differences observed among the other four methods.

The primary IVW analysis results of exposures (EBV antibodies) and outcomes (RA and SLE). Ab, antibody; IVW, inverse-variance weighting.
There was no genetic causal relationship between EBV antibody levels and SLE. Additionally, EBV VCA-p18 antibody levels, EBV ZEBRA antibody levels, and EBV EBNA-1 antibody levels did not have a genetic estimate of causal relationship with RA.
Results of pleiotropy and heterogeneity
The analysis results of pleiotropy and heterogeneity are shown in Table 2. Based on the above MR analysis results, pleiotropy was tested using the MR-Egger intercept test and the MR-PRESSO global test, with all results showing p > 0.05, indicating no horizontal pleiotropy. Additionally, the leave-one-out analysis showed no significant differences between each MR analysis after sequentially removing one SNP at a time.
The Sensitivity Analysis of the MR Analysis Results of Exposures (EBV Antibodies) and Outcomes (RA and SLE)
MR, Mendelian randomization.
RA and SLE as exposures, EBV antibodies as outcomes
IV selection
Figure 3 shows the screening of all IVs. A total of 60 SNPs were identified as significantly correlated with RA, and 60 SNPs were collected from the GWAS summary data of EBV ZEBRA antibody levels. Ultimately, 47 of these SNPs were designated as IVs, as shown in Supplementary Table S10. Sixty SNPs were collected from the GWAS summary data of EBV VCA-p18 antibody levels, with 52 SNPs ultimately designated as IVs, as detailed in Supplementary Table S11. Similarly, 60 SNPs were collected from the GWAS summary data of EBV EBNA-1 antibody levels, and 50 SNPs were designated as IVs, as detailed in Supplementary Table S12. From the GWAS summary data of EBV EA-D antibody levels, 60 SNPs were collected, with 49 ultimately designated as IVs, as detailed in Supplementary Table S13.

The screening status of all instrumental variables (RA and SLE as exposures, EBV antibodies as outcomes).
A total of 45 SNPs were significantly associated with SLE. From the total GWAS data of EBV ZEBRA antibody levels, EBV VCA-p18 antibody levels, EBV EBNA-1 antibody levels, and EBV EA-D antibody levels, 40, 40, and 39 SNPs were screened, respectively. Finally, 40 SNPs were designated as IVs, as detailed in Supplementary Tables S14, S15, S16, Table and S17.
MR results
The main results of the MR analysis are shown in Supplementary Table S18, and the primary IVW results are illustrated in Figure 4. The random-effects IVW analysis showed that SLE was significantly associated with EBV ZEBRA antibody levels (p = 0.009, OR = 1.028, 95% CI = [1.007–1.050]). Similarly, EBV EA-D antibody levels were significantly associated with SLE (p = 0.005, OR = 1.032, 95% CI = [1.009–1.054]), indicating positive genetic causality. None of the supplementary MR analysis methods were statistically significant.

The primary IVW analysis results of exposures (RA and SLE) and outcomes (EBV antibodies).
There was no significant causal relationship between RA and EBV-Ab levels. Additionally, there was no genetic estimate of causal relationship between SLE and EBV EBNA-1 antibody levels or EBV VCA-p18 antibody levels.
Results of pleiotropy and heterogeneity
Table 3 shows the pleiotropy and heterogeneity of MR analysis results. Pleiotropy was tested using the MR-Egger intercept test and the MR-PRESSO global test, with all results showing p > 0.05, indicating no horizontal pleiotropy. Cochran’s Q test (IVW) and Rucker’s Q test (MR-Egger) methods were used to detect heterogeneity, and the results showed p > 0.05, indicating no heterogeneity. The leave-one-out analysis showed that after removing one SNP at a time, there was no significant difference in each MR analysis.
The Sensitivity Analysis of the MR Analysis Results of Exposures (EBV Antibodies) and Outcomes (RA and SLE)
IVW, inverse-variance weighting; MR-PRESSO, Mendelian Randomization Pleiotropic Residual Sum and Outlier.
Discussion
In this study, we performed a bidirectional two-sample MR analysis using GWAS data from a large cohort to evaluate the estimate of causal relationship between EBV-Ab and RA and SLE. We found that genetic susceptibility to RA was significantly associated with a reduction in EA-D antibody levels. The production of EBV antibodies was not associated with a genetic predisposition to SLE. In reverse MR results, we found that SLE increased genetic susceptibility to ZEBRA antibody and EA-D antibody production. RA was not associated with a genetic predisposition to EBV antibodies. The above results were further verified by sensitivity analysis. Both pleiotropy and heterogeneity tests showed no significant differences, highlighting the robustness of the results.
The database for antibodies to EBV, a common herpes virus, provided serum samples from more than half a million UK adults recruited by the UKB between 2006 and 2010. Among these participants, the seropositivity rate for EBV was over 90% (Butler-Laporte et al., 2020), and the seropositive serum samples were used to detect EBV antibody levels. Therefore, the following research results focus on the causal relationships between EBV infection and AIDs, aiming to explore the genetic variations responsible for different antibody-mediated immune responses in seropositive populations.
This study investigated the potential estimate of causal relationship between EBV antibody levels and AIDs, specifically RA and SLE, through MR analysis. Our results reveal several key findings, which are discussed in detail in the following paragraphs. First, our study found a negative genetic estimate of causal relationship between EBV EA-D antibody levels and RA. These results suggest that a decrease in EBV EA-D antibody levels may increase the risk of RA. Similarly, a genetic causal relationship between the production of autoantibodies following EBV infection and the risk of RA was also demonstrated. Previous studies have been contradictory: some suggested that EBV is an important risk factor for RA (Kudaeva et al., 2019; Munir et al., 2023), whereas others did not support the hypothesis that EBV infection could easily lead to the development of RA (Ball et al., 2015). Although this finding is not entirely consistent with existing research, our study demonstrates an estimate of causal relationship between EBV infection and RA at the genetic level.
It is worth noting that there is no genetic causal relationship between changes in EBV antibody production and the onset of SLE, which is inconsistent with previous findings (Hanlon et al., 2014). This discrepancy may be related to the complexity of antibody production in vivo. Other studies have shown that the titer of VCA-IgA antibody may be related to the onset of SLE (Chen et al., 2005), and that SLE genetic risk loci are associated with the EBNA2 DNA binding pattern (Harley et al., 2018; Wang et al., 2021; Yin et al., 2021). This suggests that the production of other antibodies after EBV infection may have a causal relationship with the onset of SLE, and more antibodies need to be tested to confirm this.
Multiple studies have suggested that EBV infection in AIDs leads to abnormal antibody production (Munir et al., 2023; Wood et al., 2021; Xuan et al., 2020). To rule out reverse causality, we conducted a reverse MR analysis using two samples, with RA and SLE as exposures and EBV antibody levels as outcomes. We reached the following conclusions: (1) From the perspective of genetic causality, patients with RA do not affect the production of EBV antibodies, which is consistent with the findings of He et al. (2022) and Miceli-Richard et al. (2009). Additionally, studies have shown that patients with RA treated with immunosuppressants and biological agents do not show altered EBV antibody levels (Balandraud et al., 2007, Balandraud et al., 2003), supporting these results. (2) Our results indicate that patients with SLE infected with EBV have increased production of ZEBRA antibodies and EA-D antibodies. Previous studies (Miskovic et al., 2023; Wood et al., 2021) have suggested that patients with SLE frequently experience reactivation of EBV after infection, aligning with our findings. Banko et al. (2023) studied 103 patients with SLE and 99 control subjects, concluding that SLE was strongly associated with EA-D IgG antibody, consistent with our results. We further confirmed that SLE leads to increased production of EA-D IgG antibody from a genetic causation perspective.
The life cycle of EBV is characteristic of large enveloped DNA viruses, consisting of primary infection, latency, and reactivation stages (Buschle and Hammerschmidt, 2020). Typically, laboratory identification of EBV infection relies on antibodies that detect EBV antigens, which can be used to determine the stage of infection. In normal individuals, EA-D IgG is elevated during the first 3–4 weeks of infection and becomes undetectable after approximately 34 months (about 85% of acutely infected patients are positive 3 months after symptom onset) (Bauer, 2001). Therefore, EA-D is considered to represent the primary infective phase and the early stages of lytic reactivation (Draborg et al., 2012). EBNA-1 and VCA-p18 represent previous infection, with p18 absent in patients with acute infection, indicating the incubation period (Bauer, 2001; De Paschale and Clerici, 2012). The replication cycle begins with the initial expression of the BZLF1 gene and the production of the Epstein-Barr replication-activating protein (ZEBRA) (Gulley and Tang, 2008), making anti-ZEBRA antibody a marker of reactivation. AIDs are caused by the interplay of genetic and environmental factors. Based on the results of this study, we speculate that EA-D antibodies should increase during early infection or reactivation following EBV infection. However, due to genetic abnormalities, EA-D antibody levels may decrease, potentially leading to the onset of RA. Similarly, given our conclusion that SLE can lead to a genetic causation of increased ZEBRA antibodies and EA-D antibodies, we suspect that patients with SLE may experience frequent EBV infection and reactivation.
The role of EBV as an environmental causative factor of AIDs has been studied for 50 years, but the results remain inconsistent due to the complex mechanisms of EBV within the body. The advantage of this study is the use of the MR method to avoid reverse causality and rigorous techniques to exclude pleiotropy and heterogeneity, thereby making the conclusions more robust. This study establishes the exact genetic causal relationship between AIDs and EBV, providing new insights for future prevention and treatment strategies. This article not only demonstrates that EBV infection is a cause of RA but also discusses the relationship between early and reactivated EBV infection periods and RA (Serafini et al., 2007). Additionally, it concludes that patients with SLE are prone to frequent EBV infections and reactivations, providing a theoretical basis for the prevention and active treatment of EBV in patients with SLE.
However, there are some limitations to our study. Firstly, although MR analysis can reduce the impact of confounding factors, it has its limitations. The method cannot fully eliminate all potential confounders, which may pose a threat to the validity of the results. For example, genetic heterogeneity and pleiotropy may affect the results of MR analyses. In this study, we employed a variety of sensitivity analysis methods to assess these potential effects and ensure that our results were as robust as possible. Second, our study relies on existing GWAS data, which may be subject to selection bias and sample size limitations. Additionally, the database we used did not provide information on the patients’ medication status, previous EBV vaccine status, and whether the patients tested for antibodies had EBV infection symptoms and treatment status. Therefore, future studies need to be conducted with larger samples and different populations. Moreover, more EBV-related antibodies should be analyzed to verify the complex infection mechanism of EBV in the human body, which leads to the development of AIDs. Furthermore, our study is based on existing GWAS data, primarily from individuals of European ancestry, which may limit the generalizability of the findings. Additionally, population stratification and assortative mating were not accounted for, which could introduce potential confounding effects. Therefore, our findings may not be generalizable to other races or populations. Future studies are needed in more diverse populations to validate our findings and explore whether there are racial or geographic differences in the interaction between EBV infection and AID.
Conclusion
This study provides definitive evidence for a causal relationship between EBV antibody levels and AIDs through MR analysis. Our findings offer a new perspective for understanding the pathogenesis of these complex diseases and lay a foundation for future research directions and clinical prediction of prognosis and treatment.
Footnotes
Authors’ Contributions
M.X.: Data curation (equal), methodology (equal), writing—original draft (lead), writing—review and editing (equal), formal analysis (equal), and methodology (lead). M.S.: Data curation (equal), writing—original draft (equal), and writing—review and editing (equal). G.C.: Data curation (equal), formal analysis (equal), methodology (equal), and software (lead).
Data Availability Statement
The datasets presented in this study can be found in online repositories. The names of the repository/repositories and accession number(s) can be found in the article/supplementary material.
Author Disclosure Statement
The authors declare that the research was conducted in the absence of any commercial or financial relationships that could be construed as a potential conflict of interest.
Funding Information
The authors declare that no financial support was received for the research, authorship, and/or publication of this article.
Supplementary Material
Supplementary Table S1
Supplementary Table S2
Supplementary Table S3
Supplementary Table S4
Supplementary Table S5
Supplementary Table S6
Supplementary Table S7
Supplementary Table S8
Supplementary Table S9
Supplementary Table S10
Supplementary Table S11
Supplementary Table S12
Supplementary Table S13
Supplementary Table S14
Supplementary Table S15
Supplementary Table S16
Supplementary Table S17
Supplementary Table S18
References
Supplementary Material
Please find the following supplemental material available below.
For Open Access articles published under a Creative Commons License, all supplemental material carries the same license as the article it is associated with.
For non-Open Access articles published, all supplemental material carries a non-exclusive license, and permission requests for re-use of supplemental material or any part of supplemental material shall be sent directly to the copyright owner as specified in the copyright notice associated with the article.
