




Abstract
Abstract
Zebrafish cancer models are fast gaining ground in cancer research. Most tumors in zebrafish develop late in life, when fish are no longer transparent, limiting in vivo optical imaging methods. Thus, noninvasive imaging to track tumor in adult zebrafish remains challenging. In this study, we applied magnetic resonance microimaging (μMRI) to track spontaneous melanomas in stable transgenic zebrafish models expressing an RAS oncoprotein and lacking P53 (mitf:Ras::mitf:GFP X p53−/−). Tumors in live adult zebrafish were observed at various locations using a T2-weighted fast spin echo sequence at 9.4 T. Further, live imaging of tumors at ultrahigh field (17.6 T) revealed significant tumor heterogeneity. This heterogeneity was also confirmed by the significant differences in transverse relaxation time, T2 measured in various regions of tumor. To our knowledge, this is the first report demonstrating the application of μMRI to detect the locations, invasion status, and characteristics of internal melanomas in zebrafish and suggesting that noninvasive μMRI can be applied for longitudinal studies to track tumor development and real-time assessment of therapeutic effects in zebrafish tumor models.
Introduction
Advanced melanoma is a devastating and lethal cancer. Significant progress in understanding the basis for this disease has been made. 6 Further research, particularly the kind that translates knowledge of the disease into treatment options, will be required to improve the prognosis for melanoma patients. With many tools for studying melanocytes and established melanoma models, the zebrafish is poised to make great contributions toward this goal.7–9 It has been shown that zebrafish melanomas are strikingly similar to their human counterparts. 6 Although these studies have been invaluable to demonstrate the potential of zebrafish as a melanoma model, they have been limited by an inability to assess tumor growth and progression in vivo. Most of the tumors in zebrafish develop late in life.5,10,11 Thus, the lauded advantage of zebrafish embryos being transparent does not apply to most in vivo cancer studies in zebrafish that involve adult animals. Although a relatively transparent adult zebrafish line that lack all types of pigments has been generated, they are not applicable to study, for example, malignant melanomas that contain melanin pigments. Recently, Goessling et al. 4 have applied high-resolution ultrasound to follow tumor development and regression by treatment in living adult fish. However, obtaining anatomical details and tumor heterogeneity is beyond the resolution of ultrasound. Among the many noninvasive imaging techniques available, magnetic resonance microimaging (μMRI) can provide relatively good spatial resolution and specificity, without ionizing radiation and with limited side effects.
MRI has been widely used to track the presence, development, and heterogeneity of various types of tumors in human as well as in various animal models such as mice and rats. 12 However, MRI to detect tumors in adult zebrafish has not yet been explored. Because of their very small size compared to a mouse or a rat, imaging adult zebrafish demands high resolution. Further, being aquatic animals, zebrafish require a special setup and several precautions for supporting in vivo imaging. Recently, we have optimized in vivo μMRI at 9.4 T to image live adult zebrafish. 13 High-resolution anatomical details have been obtained from adult zebrafish using T2-weighted fast spin echo sequences. 13 Further, μMRI in conjunction with MR spectroscopy allowed us to obtained neurochemical composition of live healthy adult zebrafish brain. 14 However, to get access to small internal tumors in zebrafish and to characterize these tumors, improvement in sensitivity and image resolution is needed.
In this study, we used high-field μMRI to characterize the tumor anatomy in a living transgenic zebrafish melanoma model (mitf:Ras::mitf:GFP X p53−/− fish). This transgenic zebrafish model develops spontaneous melanomas. 9 However, the locations and invasion status of melanomas have not been fully studied. The main aim of this study was to establish parameters for in vivo μMRI of zebrafish melanomas to observe their anatomical locations as well as extent of invasion. In addition to imaging melanomas in zebrafish at moderately high field (9.4 T), we explored the used of ultrahigh field (17.6 T) to obtain even greater sensitivity and resolution. Further, to obtain detailed information about the heterogeneity of tumors, the proton spin–spin relaxation (T2) times have been calculated within tumor volume. Our results demonstrate the feasibility of using μMRI technique to noninvasively monitor malignant melanomas and their anatomy in living adult zebrafish.
Materials and Methods
Generation of transgenic zebrafish model of melanoma (mitf:Ras::mitf:GFP X p53−/−)
The generation of transgenic zebrafish expressing oncogenic human HRasG12V in melanocytes (mitf:Ras::mitf:GFP fish) has been previously described. 9 Stable mitf:Ras::mitf:GFP transgenic fish were crossed with homozygous tp53M214K fish to generate mitf:Ras::mitf:GFP X p53−/− fish.10,15
All wild-type and transgenic zebrafish were maintained in recirculating aquarium systems according to established rearing procedures.16,17 Adult fish (aged between 4 and 6 months) were used for this study. For imaging dead fish, adult zebrafish were euthanized and immediately embedded in Fomblin (Perfluoropolyether). Alternatively, the fish were fixed in 4% buffered paraformaldehyde (Zinc Formal-Fixx) for 2 days and subsequently embedded in Fomblin.
Magnetic resonance microimaging
For in vivo μMRI measurements, a fish was anesthetized by adding 0.001% MS222 (ethyl meta aminobenzoate metanesulfonic acid salt; Sigma Chemical Co.) to pH-controlled water. Subsequently, the fish was transferred to a closed mini-flow-through chamber, which was specially designed to be fitted in 10 mm volume radio frequency (RF) coil to support living zebrafish inside the magnet. 14 The flow-through setup was then inserted in the center of the volume coil (1 cm diameter, 4 cm length) inside the microimaging probe, which was then inserted into the bore of the vertical MR magnet (400 MHz). Aerated water with anesthetic was pumped from a temperature-controlled aquarium to a tube entering the flow-through cell and opening close to the mouth of the fish. After passing the chamber, the water was transported back to the aquarium. The setup allowed direct in vivo nuclear magnetic resonance (NMR) measurements at constant flow speeds (10 mL/min), which were regulated by a STEPDOS 03/08 pump (KNF Flodos AG). After the μMRI measurements, zebrafish were transferred back to normal aquarium without anesthetic where fish recovered uneventfully from the experimental treatment within 1–2 h.
MRI was performed using a 400 MHz (9.4 T) or 750 MHz (17.6 T) vertical bore system, using a 10 mm volume coil and a 1 Tm−1 gradient insert from Bruker Analytic. Before each measurement, the magnetic field homogeneity was optimized by shimming. Each session of measurements began with a multislice orthogonal gradient-echo sequence for position determination and selection of the desired region for subsequent experiments. For imaging live and dead zebrafish, rapid acquisition with relaxation enhancement (RARE) sequences was used. Basic measurement parameters used for the RARE sequence 18 were echo time = 15 ms, repetition time = 1500 ms, and RARE factor = 4. The field of view was 1.0 cm with an image matrix of 256 × 256 and the slice thickness was 0.2 mm. Data acquisition and processing were performed with Para Vision 3.02pl (Bruker Biospin) running on a Silicon Graphics 02 workstation with the Irix 6.5.3 operating system and using a Linux pc running XWinNMR 3.2.
For T2 relaxation time measurement, a multislice multiecho sequence was used. Imaging parameters were as follows: FOV 2.0 × 2.0 cm2, matrix size 256 × 256, number of averages 2, number of slices 6 with slice thickness of 0.5 mm, number of echoes 8 with echo time of 8.5, 17.0, 25.5, 34.0, 42.5, 51.0, 59.5, and 68.0 ms, and a repetition time of 1.5 s. For calculation of T2 relaxation time, regions of interest (ROIs) were drawn at various locations within the tumor. Another ROI in the muscle was used as an internal control. Mean and standard deviation for T2 relaxation times for each ROI were calculated.
Histology and microscopy
Following in vivo MR measurements, fish were fixed in 4% paraformaldehyde (Zinc Formal-Fixx) at 4°C for 3 days. Fixed fish were decalcified in 0.25 M ethylenediaminetetraacetic acid (pH 8.0) for 4 days, dehydrated with ethanol, and embedded in plastic. Plastic-embedded fish were carefully sectioned (7 μm) while maintaining the same spatial orientation as in the MRI experiments. The sections were stained with toluidine blue and were examined under a Leica MXFLIII stereo microscope and a Zeiss axioplan microscope. Histological images were collected with a digital photo camera (model DKC-5000; Sony) and produced using Metamorph software (Molecular Devices Corporation). Final images were transferred to Adobe Photoshop 7.0 to adjust levels and brightness.
Results and Discussion
Zebrafish are fast becoming an accepted organism for cancer modeling. Most of the tumors in zebrafish develop late in life, when the fish is no longer transparent, limiting in vivo optical imaging methods. In this study, we applied μMRI methods to image internal tumors in live adult zebrafish. Clear morphological proton images were obtained from live fish using RARE sequence in a short time (4 min) (Fig. 1). Intermediate signal intensity from the tumor was observed in T2-weighted images.

Noninvasive detection of malignant tumors in transgenic mitf:Ras::mitf:GFP X p53−/− zebrafish using magnetic resonance microimaging (μMRI). Images of living (
Figure 1A depicts images of four live transgenic zebrafish (a–d) with tumors at locations such as in trunk muscles and abdomen that is penetrating into the myoseptum, near the eye, intestine, and liver (Fig. 1A). Figure 1B shows images of the same four transgenic fish after they were freshly killed. Due to the absence of motion and flow artefacts a better image quality was obtained from freshly killed fish as compared to images of living fish. The MR images clearly show that μMRI can provide clear tumor invasion status in these transgenic fish. To assess the accuracy of in vivo μMRI in distinguishing tumor type, a three-way correlation of tumor-bearing zebrafish is shown in Figure 2A (a–c). The same transgenic zebrafish with a large abdominal tumor was imaged live (Fig. 2Aa), dead (Fig. 2Ab), and after histological sectioning (Fig. 2Ac). An excellent correlation between tumor observed by μMRI and in histological section was obtained. Figure 2B shows successive slices in coronal (d–g) and sagittal (h–k) planes of a zebrafish with an abdominal tumor showing the location and penetration of tumor within abdominal regions. The histological analysis shows that these tumors are heterogeneous (Fig. 2C). Melanocytes and their different developmental stages are evident in Figure 2C (arrows). For example, immature, mature, and dendritic melanocytes can be seen in this tumor. In addition, the penetration of melanocytes in muscle cells and melanin vesicles produced by melanocytes can be clearly seen (Fig. 2C). Interestingly, heterogeneity of the tumor can also be slightly recognized in in vivo images, but the tumor appeared more homogeneous in images from formalin-fixed zebrafish. The homogenous appearance of tumor in dead fish seen by μMRI may be due to the influence of formalin fixation process on T2 contrast. The fixation process is known to alter tissue characteristics by forming cross-links between proteins and/or proteins and nucleic acids, and creating hydroxymethylene bridges. 19
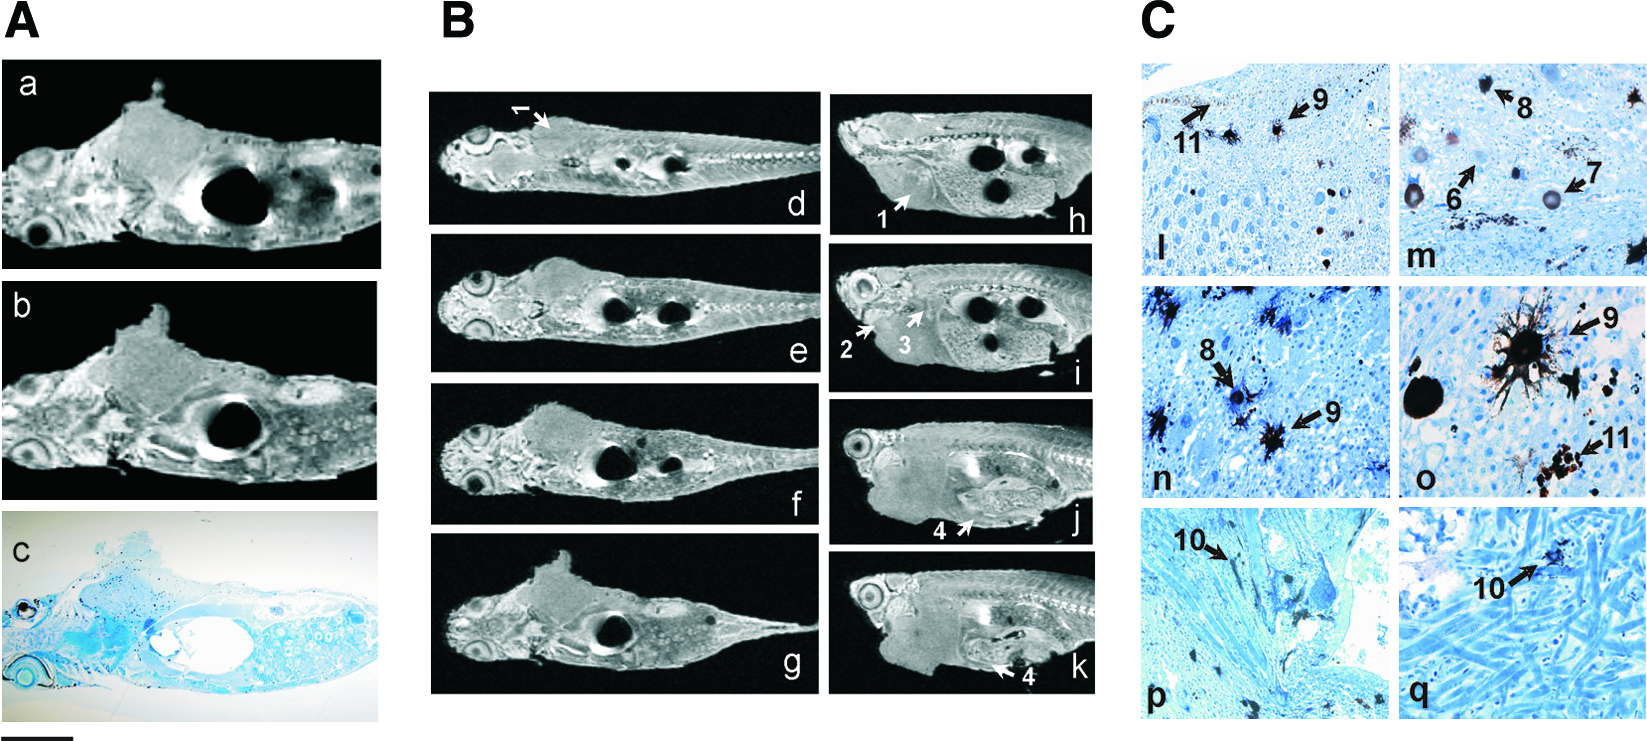
Characterization of malignant tumor in transgenic mitf:Ras::mitf:GFP X p53−/− zebrafish. (
To improve image quality and to clearly probe the heterogeneity of tumor, we explored the use of ultrahigh magnetic field (17.6 T) for μMRI. Initial experiments were performed to compare the image quality improvement in zebrafish at ultrahigh field. Figure 3 compares the MR image quality obtained from zebrafish head by using moderate (9.4 T) and ultrahigh field (17.6 T) magnetic field strength. The images were collected with the same parameter settings at both magnetic fields, to compare image quality rather than shortening the total scan time. The improved image quality was characterized by a better signal-to-noise ratio (SNR), better image contrast, and higher resolution compared to images obtained at 9.4 T. As shown in Figure 3, the brain substructures, which were not visible at 9.4 T, were nicely resolved at 17.6 T. At 17.6 T, an image with approximately two times better SNR was obtained. The difference between these SNR improvement factors may be due to difference in the saturation of the magnetization and in the T2 relaxation times in the tissue. Brain regions such as telencephalon, diencephalon, mesencephalon, and cerebellum were more clearly visible at 17.6 T than at 9.4 T. The influence of better SNR in improving structural information at ultrahigh field was then applied to observe tumor anatomy in vivo. Figure 4A shows images in sagittal and coronal plane of the live transgenic zebrafish with lower abdominal tumor. As clear from this figure, live imaging of tumor at ultrahigh field revealed that the tumor is highly heterogeneous. The heterogeneity of tumors was also confirmed by the significant differences in transverse relaxation time, T2 measured in various regions of tumor. The spin–spin relaxation time, T2, is a specific attribute of spins, which depends on their surrounding. Interaction between spins, for example, coupling of neighboring nuclei destroy the phase coherence; therefore, T2 relaxation time can be a sensitive indicator of the variation in the microenvironment within a tumor volume. An elevated and broader T2 relaxation time has been reported within tumor in earlier studies. 20 T2 has also shown to be a sensitive indicator of tumor growth rate. 20 We measured the T2 relaxation time within and outside the abdominal tumor bed in five different living transgenic zebrafish containing similar abdominal tumor. In general, the T2 relaxation time was elevated within tumor bed as compared to its immediate surrounding healthy tissue. Also, the T2 variation was significantly higher within tumor bed than in surrounding healthy tissue in all five fish. The T2 relaxation times measured in various regions within abdominal tumor bed ranged between 36.0 ± 2.9 and 66.3 ± 2.7 ms as compared to a range between 33.3 ± 3.5 and 35.2 ± 1.3 ms found in healthy muscle tissue outside the tumor. An example of the T2 measurement within and outside abdominal tumor bed in one of the zebrafish is depicted in Figure 4B. T2 relaxation times in region 1, 2, and 3 within tumor were 66.3, 36.7, 42.3 ms, respectively; T2 times in region 4 and 5 outside the tumor were 35.9 and 33.4 ms, respectively (Fig. 4B). A variety of factors can influence relaxation times within tumor, for example, cellular architecture, regional differences in cellular growth rates, local inflammatory processes,20,21 necrosis, and/or presence of trace amount of paramagnetic ions or chemical radical species. 22 The influence of differences in melanin contents in the tumor cells on T2 variation cannot be ruled out, although previous studies did not show any clear association between T2 signal intensity and melanin contents. 23 White areas within the tumor bed correspond to necrotic degenerating mucoid cells as confirmed by coregistration of MR images (Fig. 5A) with histological sections of the same fish (Fig. 5B). The presence of a significant proportion of degenerating or dead cells in addition to numerous proliferating viable cancer cells in rapidly growing tumors is a well-known phenomenon. These dead or dying cells result from incomplete formation of tumor blood vessels and impaired immune cell response. The accumulation of dying cells results in the formation of a dead, or necrotic, core present in virtually all solid tumors. Figure 5C and E shows that these white areas or necrotic core did not show any well-defined borders.
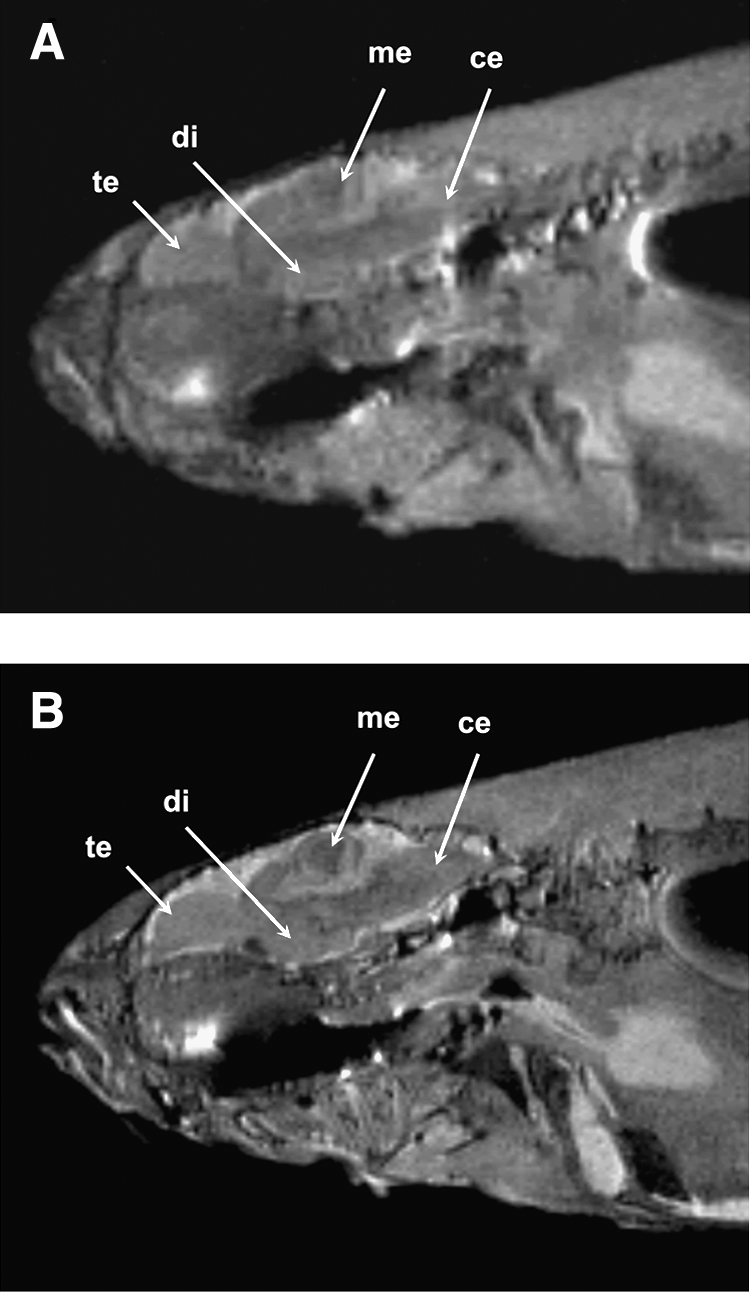
High-resolution images of adult zebrafish at a magnetic field strength of 9.4 T (

In vivo characterization of malignant abdominal tumor in transgenic zebrafish using in vivo (MRI at 17.6 T. (
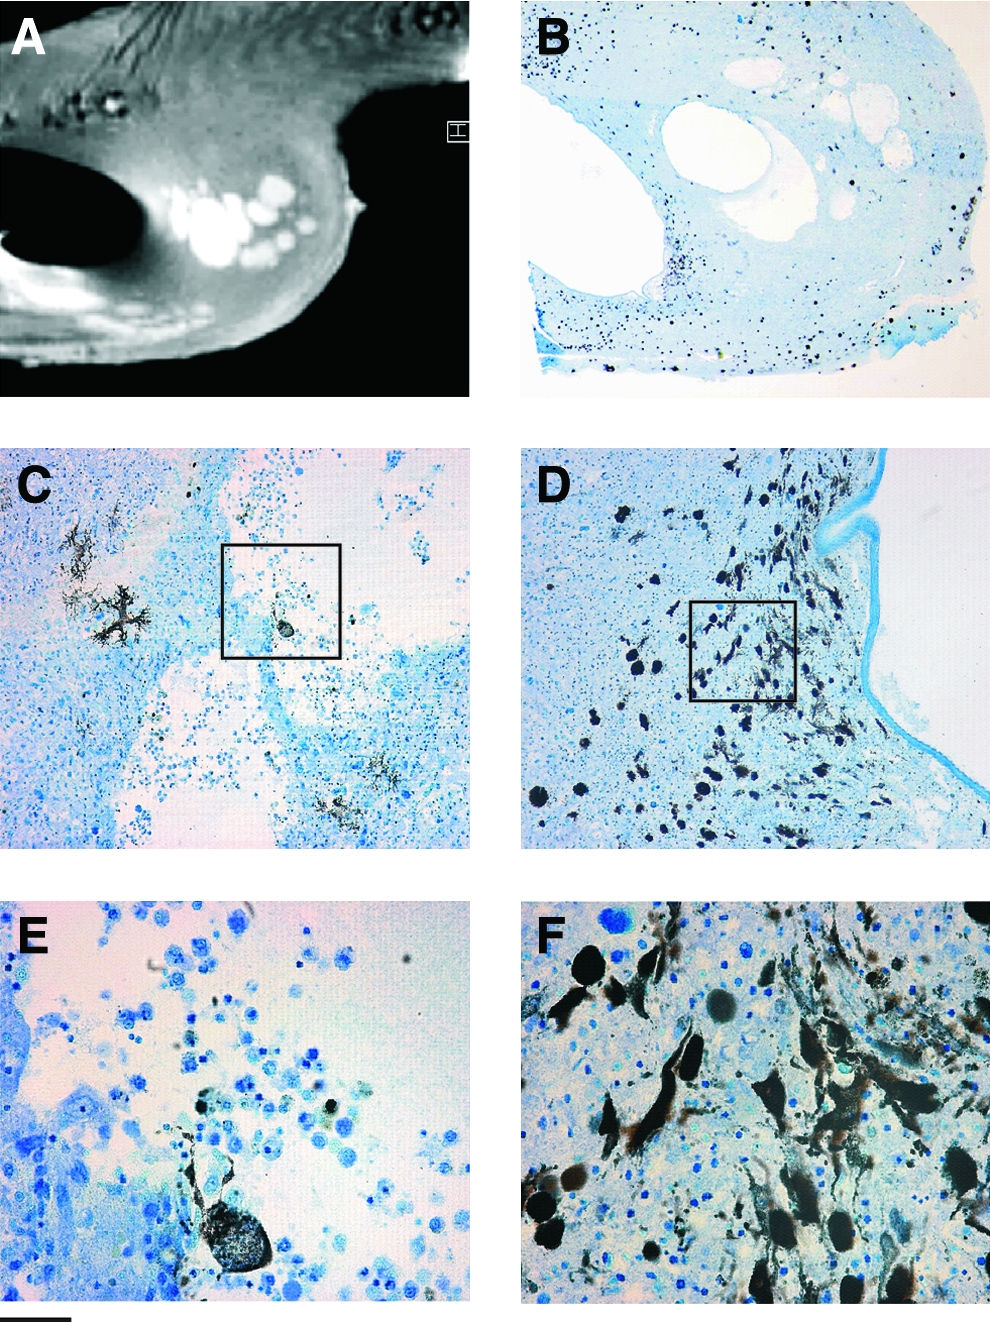
Heterogeneity of the malignant abdominal tumor in transgenic zebrafish observed by (
Conclusions
Our results demonstrate the feasibility of μMRI technique to detect internal tumors, for the first time, in live adult zebrafish noninvasively. We have also shown that T2 relaxation time measurements can provide a means to evaluate the heterogeneity of the malignant tumor in vivo. Such noninvasive μMRI studies may allow longitudinal studies of tumor development and real-time assessment of therapeutic effects in zebrafish tumor models.
Footnotes
Acknowledgments
We thank Fons Lefeber and Kees Erkelens for technical help concerning the MRI, and Annemarie Meijer for advice and providing the facility to work with the zebrafish. We also thank Gerda Lammers for histological sectioning. This work was partly supported by grants from the Centre for Medical Systems Biology and CYTTRON within the Bsik program (Besluit subsidies investeringen kennisinfrastructuur).
Disclosure Statement
No competing financial interests exist.