
Abstract
Abstract
This project was developed to promote understanding of how mathematics and statistical analysis are used as tools in genetic research. It gives students the opportunity to carry out hypothesis-driven experiments in the classroom: students generate hypotheses about Mendelian and non-Mendelian inheritance patterns, gather raw data, and test their hypotheses using chi-square statistical analysis. In the first protocol, students are challenged to analyze inheritance patterns using GloFish, brightly colored, commercially available, transgenic zebrafish that express Green, Yellow, or Red Fluorescent Protein throughout their muscles. In the second protocol, students learn about genetic screens, microscopy, and developmental biology by analyzing the inheritance patterns of mutations that cause developmental defects. The difficulty of the experiments can be adapted for middle school to upper level undergraduate students. Since the GloFish experiments use only fish and materials that can be purchased from pet stores, they should be accessible to many schools. For each protocol, we provide detailed instructions, ideas for how the experiments fit into an undergraduate curriculum, raw data, and example analyses. Our plan is to have these protocols form the basis of a growing and adaptable educational tool available on the Zebrafish in the Classroom Web site.
Introduction
Zebrafish are being increasingly used for education, and in particular have many advantages for genetic experiments.2–7 They are easy to raise, and a single pair often produces 100 embryos or more when mated, making it possible for each student to have their own fish. Since adult fish live over 2 years, the same fish can be used over many semesters, either directly when the adult fish express viable phenotypes or to produce clutches containing mutant embryos for analysis. Many zebrafish mutant and transgenic strains are available commercially and from the Zebrafish International Resource Center, and there is a wealth of information about how to successfully raise and maintain them (zebrafish.org/zirc/home/guide.php).8–10 Our first protocol uses GloFish, a brightly colored and fluorescent strain. GloFish are readily available in pet stores (www.glofish.com/), making it possible to carry out challenging genetic experiments in schools without access to a research zebrafish facility.
Several excellent protocols already exist for using zebrafish to teach genetics (www.bioeyes.org/) (www.insciedout.org/) (www.glofish.com/classroom.asp).2–7 Our protocols build upon this earlier work by giving students background in how genetic screens are used to find new mutants, bringing in the analysis of several phenotypes in a single cross, and including inheritance patterns that do not fall into basic recessive and dominant patterns. Finally, these protocols add richness to the study of genetics by challenging students to form their own hypotheses, and then rigorously test these hypotheses through the use of chi-square statistical analysis. Chi-square analysis requires only the use of basic mathematic techniques, making it appropriate for middle school and high school students. Knowledge of mathematics is becoming even more important to biologists as they tackle increasingly complex problems and large data sets.11–13 This has led to a call for greater integration of mathematics into the undergraduate curriculum.13–15 Our protocols enable the introduction of mathematics into the undergraduate curriculum during the freshman or sophomore year, providing a foundation for more complex mathematical approaches in subsequent courses.
The two protocols reported here were developed for a sophomore level undergraduate genetics laboratory course. This course met for one 4-hour laboratory session each week of the semester, and all of the students (∼60 students/semester, 10–20 students/laboratory section) either had taken or were concurrently taking a genetics lecture course. However, these experiments will coordinate with virtually every genetics course, as they incorporate the concepts that form the basis of all genetics studies. In addition, these laboratories are student-driven and problem-based without being extremely labor intensive for the instructors. Thus, they will fit well into courses aiming to eliminate “cook-book” laboratories from their curriculum. Further, the raw data we have included can be used to introduce active learning and problem solving into lecture courses, which has been shown to have a positive impact on the ability of students to retain knowledge and their long-term achievement. 16 Our goal is to make this an evolving and growing collaborative protocol on our Zebrafish in the Classroom Web site (www.zfic.org) that includes variations on how to use these ideas in the classrooms for students at diverse levels in their development as scientists.
Materials and Methods
All procedures have been approved by the University of Minnesota IACUC Committee. A copy of the approved protocol is available on the Zebrafish in the Classroom Web site (www.zfic.org/common%20techniques/IACUC-teaching-all.pdf). In addition, students complete vertebrate animal safety training before starting the laboratories (Supplementary Material 1; Supplementary Data are available online at www.liebertonline.com/zeb).
Fish stocks
Parental fish stocks included the wild-type (WT) strain zebrafish Danio rerio (ZDR) (Aquatic Tropicals, Plant City, FL), and strains carrying the following mutations and transgenes: cyclopsm294 (cyc) 17 ; squintcz35 (sqt), 18 mylz2:Yellow Fluorescent Protein (GloYFP), 19 mylz2:Red Fluorescent Protein (GloRFP), 19 golden (gol),20,21 and long fin (lof).22,23 Adult fish were maintained using standard protocols. 10 Fish to be raised were maintained for 8–9 days postfertilization (dpf) in Petri dishes at 28.5°C, and then placed in a 10 L tank within a recirculating, multi-rack aquarium system (Aquatic Habitats, Apopka, FL) in our fish facility. From 9–14 dpf they were fed twice daily with live paramecium 10 and a pinch of a powder containing one part dried Spirulina and one part Argent Chemical Laboratories Hatchfry Encapsulon Grade 0. 24
Natural matings
Adult fish were set up in single pair or group matings in the afternoon, and monitored for spawning until late afternoon the following day. At that time, adult fish were placed back into their home tanks, and any embryo produced were collected into deep (100 × 20 mm) Petri dishes (Cat. #M090501; Laboratory Products Sales, Rochester, NY), one dish for each clutch of eggs. To do this, the adult fish and the insert in the mating tank were removed and the eggs allowed to settle. The majority of the water was poured out slowly so that no eggs were lost. When about 20 mL of water was left, the remaining water and eggs were poured quickly into a Petri dish (www.zfic.org/common%20techniques/mating.html). The fertile eggs were sorted from infertile eggs and waste products using a dissecting microscope with transmitted light. Embryos were moved to the middle of the Petri dish using the “embryo swirl” (www.zfic.org/common%20techniques/embryo%20swirl.html). The good eggs, which appeared translucent and had normal morphology, were sorted into one area of the Petri dish using an embryo loop (www.zfic.org/common%20techniques/Embryoloops.html), and waste and infertile eggs removed. Healthy embryos were moved to a new Petri dish containing clean aquatic system water using a transfer pipet, and the Petri dish placed in an incubator at 28.5°C or in the aquatic fish facility until the fish were ready to be imaged or raised in a large tank.
Scoring the phenotype of cyc and sqt mutants
Between 2 and 3 dpf, developing embryos were counted and scored by their eye phenotype using a dissecting microscope, with normal embryos having two eyes and mutant embryos having more closely spaced or cyclopic eyes.
Imaging
Fish were photographed without anesthesia or with a short incubation in 0.017% tricaine methanesulfonate (MS-222) dissolved in aquatic system water. Larvae were photographed using a Leica S6 D stereo light microscope fitted with a Nikon Digital Sight DS-SM camera. For all adult pictures except the progeny in Figure 5 and all fish in Figure 14, the fish were netted onto a flat surface with a small amount of water, and then photographed using Panasonic DMZ-TZ3 digital camera. Images in Figure 5 were captured with a Canon EOS Rebel XS 18-55IS digital camera. For Figure 14, adult fish were netted onto the glass plate of an Olympus SZX12 stereomicroscope connected to a Cannon PowerShot A520 through one eye piece. Images were taken with white light illumination from above or with fluorescence microscopy.
Results
Laboratory 1: analysis of Mendelian inheritance patterns using GloFish
This laboratory is designed to be the opening laboratory of the semester. Students analyze sibling groups of adult zebrafish by counting the number of fish with each phenotype, generate hypotheses about the inheritance of the relevant genes based on these data, and test their hypotheses using chi-square statistical analysis (Supplementary Materials 1–7). To make this engaging, and to bring in the concept of transgenes, it uses GloFish, a commercially available strain containing transgenes that make the fish brightly colored (Table 1) (www.glofish.com).19,25,26 In the most challenging sibling group, students make hypotheses about the inheritance patterns of three different genes that when combined together produce eight different phenotypes in a single clutch of siblings (Trihybrid Crosses 1 and 2 below). The experiments in this protocol are accessible to teaching laboratories that do not have an association with a research zebrafish facility with many mutant strains, as all needed materials can be easily found in pet stores. For instance, the GloFish available from pet stores carry transgenes and mutations that enable the analysis of recessive, dominant, and incomplete dominance inheritance patterns, making it easy to build both simple and complex crosses for student analysis.
The Glo transgenes, which give these fish their name, use the muscle-specific fast skeletal light chain 2 (mylz2) promoter to drive expression of Green Fluorescent Protein (GFP), Yellow Fluorescent Protein (YFP), or Red Fluorescent Protein (RFP/dsRed), making the body color of the fish green-yellow, yellow, or red, respectively.19,25,26 GloFish purchased from pet stores are typically homozygous for the recessive gol mutation, which causes them to have very light or non-existent stripes (Table 1). 20 To create trihybrid crosses, we crossed GloFish to WT zebrafish, which introduces the WT striped allele of the gol gene, and into a line carrying the dominant lof mutation, which causes all of the fins to undergo unregulated growth (Table 1).22,27–30 WT zebrafish and fish carrying the lof mutation are also readily available in pet stores. Because all of these genetic changes in our crosses produce viable phenotypes, inheritance patterns can be followed over several generations and students can be challenged to interpret the inheritance patterns of several genes in one cross.
The experimental design and set up for the laboratory are relatively simple (See GloFish Instructor's Key: Supplementary Material 2). Students prepare by completing vertebrate animal safety training, and by reading an introduction to the laboratory (Supplementary Materials 1 and 4). At the start of class, the students are given a short PowerPoint presentation that puts the GloFish experiment into context, lists the goals for the day, and gives examples to illustrate important concepts in statistical analysis (Supplementary Material 3).
A worksheet guides students through the steps of the laboratory and at the same time teaches them how to keep an accurate and complete laboratory notebook (Supplementary Materials 5 and 7). Briefly, students move in small groups around the laboratory and together sort tanks of sibling fish into phenotypic classes and count the number of fish in each class. After this is complete, the groups together generate null hypotheses about the inheritance patterns in each tank, and test these hypotheses using chi-square analysis. The final step in the protocol, which is typically done a week or more later, is for students to set up their own single pair mating designed to test one of their hypotheses (Supplementary Materials 5 and 6). The last day of the semester, the students have the chance to examine the progeny of these crosses and determine if their hypothesis was correct and their experimental design sound (Supplementary Material 2)
Students are encouraged to work together throughout the laboratory, but the written assignments are to be completed individually by each student. The written assignments include the laboratory worksheet, which counts as their laboratory notebook entry, and a homework in which they design an experiment to test one of their hypotheses about inheritance patterns (Supplementary Materials 5–7). Here, we have provided raw data and analyses for four GloFish crosses that could be used for this laboratory.
Dihybrid cross 1
The first experiment in this laboratory enables students to start with analysis of recessive and dominant genes, the simplest Mendelian inheritance patterns. It analyzes a dihybrid cross between a WT male and a female heterozygous for the GloYFP transgene and homozygous for gol mutation (Fig. 1). Thus, the male is gray with stripes, whereas the female is yellow and lacks stripes (Fig. 1). Of 14 progeny, 57% were yellow and 43% were gray, and all were striped (Fig. 1, Table 2, Supplementary Fig. 1).
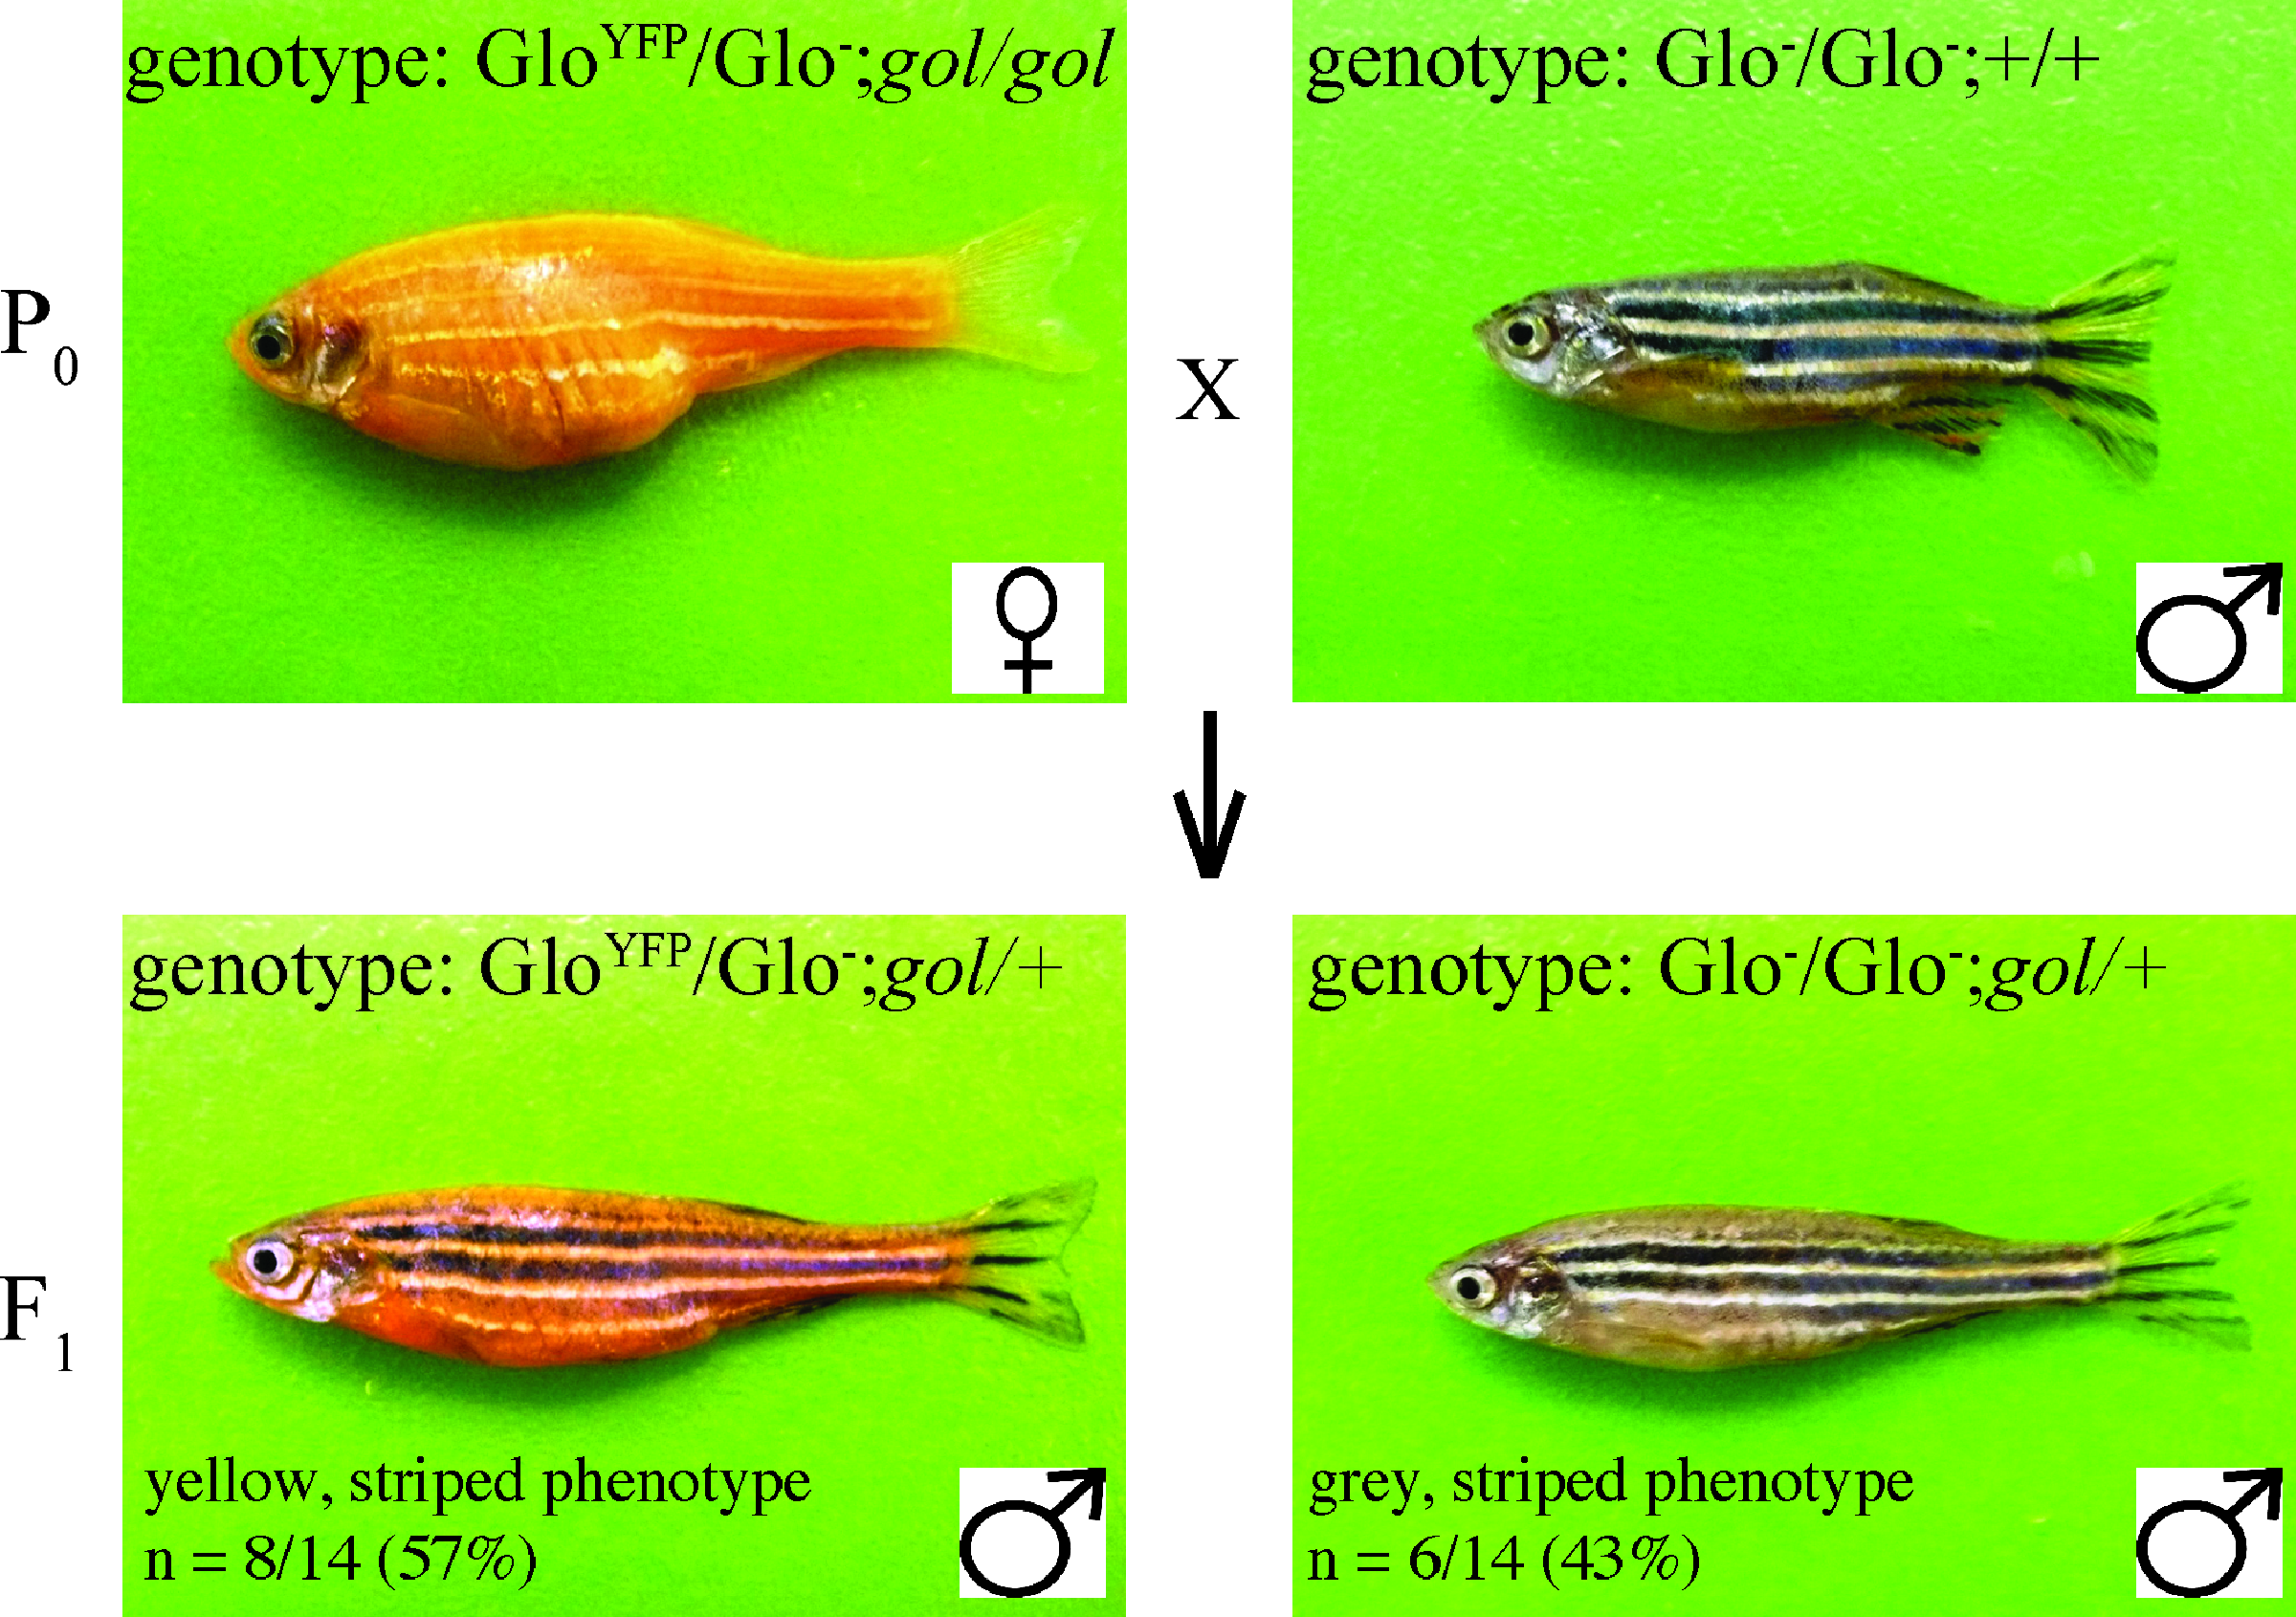
Dihybrid cross with fish carrying the GloYFP transgene and gol mutation. The parental (P0) generation consisted of a female fish heterozygous for the GloYFP transgene and homozygous for the gol mutation and a WT male fish that was not carrying the transgene or the gol mutation. Genotypes at the different loci are separated by semicolons with the genotype at the transgene locus listed first. The F1 generation was produced through a single mating of these adult fish, with one progeny of each phenotype shown. Images are lateral views, anterior to the left and dorsal to the top. Images of all of the progeny are included in Supplementary Figure 1. WT, wild type.
(1) The two phenotypes expected from the hypothesis in Figure 2 were written in the first column.
(2) The number of fish observed (O) with each phenotype was recorded in the second column.
(3) The expected number of progeny was calculated and recorded in column 3. E (normal color, normal stripes) = 0.5 × 1.0 × 14 = 7. E (yellow color, normal stripes) = 0.5 × 1.0 × 14 = 7.
(4–6) For each phenotype, D, D2, and χ2 were calculated for each phenotype and recorded in the appropriate column. Numbers were rounded to one significant digit, as this is the number of significant digits in column 2.
(7) The degrees of freedom were calculated using the number of phenotypes (n) expected by the hypothesis.
(8) The χ2 value for the experiment was the sum of the χ2 values for each phenotype.
(9) The range of p-values was calculated by using a χ2 table (www.sociology.ohio-state.edu/people/ptv/publications/p%20values/chi_table.jpg), the χ2 value for the experiment, and the degrees of freedom.
The next step in the experiment is for the students to generate a hypothesis about the inheritance patterns in this cross, and test their hypothesis with chi-square statistical analysis. In chi-square analysis, the hypothesis about the inheritance pattern of a gene or genes is termed the null hypothesis. The chi-square test produces a probability value (p-value) that reports the probability that the observed distribution of values is the same as the expected distribution. For instance, a p-value of 0.40 means that there is a 40% chance that the observed distribution is consistent with the null hypothesis, and a 60% chance that it is not. A p-value of 0.05 or less is needed to reject the null hypothesis. In other words, if there is a 5% or lower probability that the observed distribution is consistent with the null hypothesis, the null hypothesis can be rejected. It is important to note that the converse is not true. A p-value above 0.05 does not prove the null hypothesis. To rigorously prove the null hypothesis, one would have to disprove all of the other possible hypotheses by showing that they produce a p-value less than 0.05.
To make the experiment more challenging, students are typically not told the genotypes or phenotypes of the parents, and have to generate the null hypotheses based only on their observations of the progeny. Even when lacking the parental information, generating a correct hypothesis is typically not a challenge for the sophomore level undergraduate students in this course. For this cross, two null hypotheses fit the data equally well. The correct one is that the gol mutation is recessive and the GloYFP transgene is dominant (Fig. 2). Alternatively, students could hypothesize that the GloYFP transgene is recessive, with the yellow parent being homozyogous for the transgene, and the gray parent being heterozygous for the transgene. Class discussions can be used to generate a next-step experiment to determine which of these two null hypotheses is correct. Our Dihybrid cross 2 is one such cross (Fig. 3).
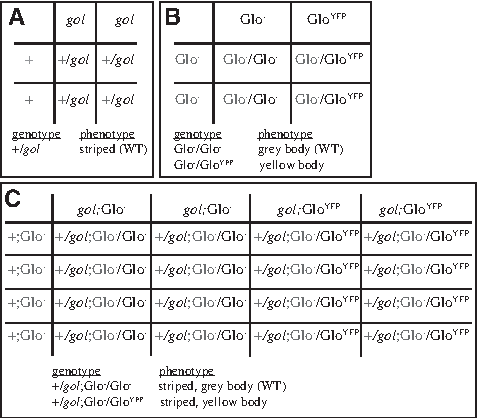
Hypothesis for dihybrid GloYFP and gol cross. The hypothesis for the inheritance pattern of the dihybrid cross is presented as Punnett squares. The genotypes of the gametes produced by the female parent are shown in the top row and the genotypes of the gametes produced by the male parent are shown in the left column. The genotypes of the progeny were generated by filling in the appropriate inherited genes from each parent, with maternal genes marked in black and paternal genes marked in gray. The hypothesized relationship of genotype to phenotype is listed below the Punnett squares.
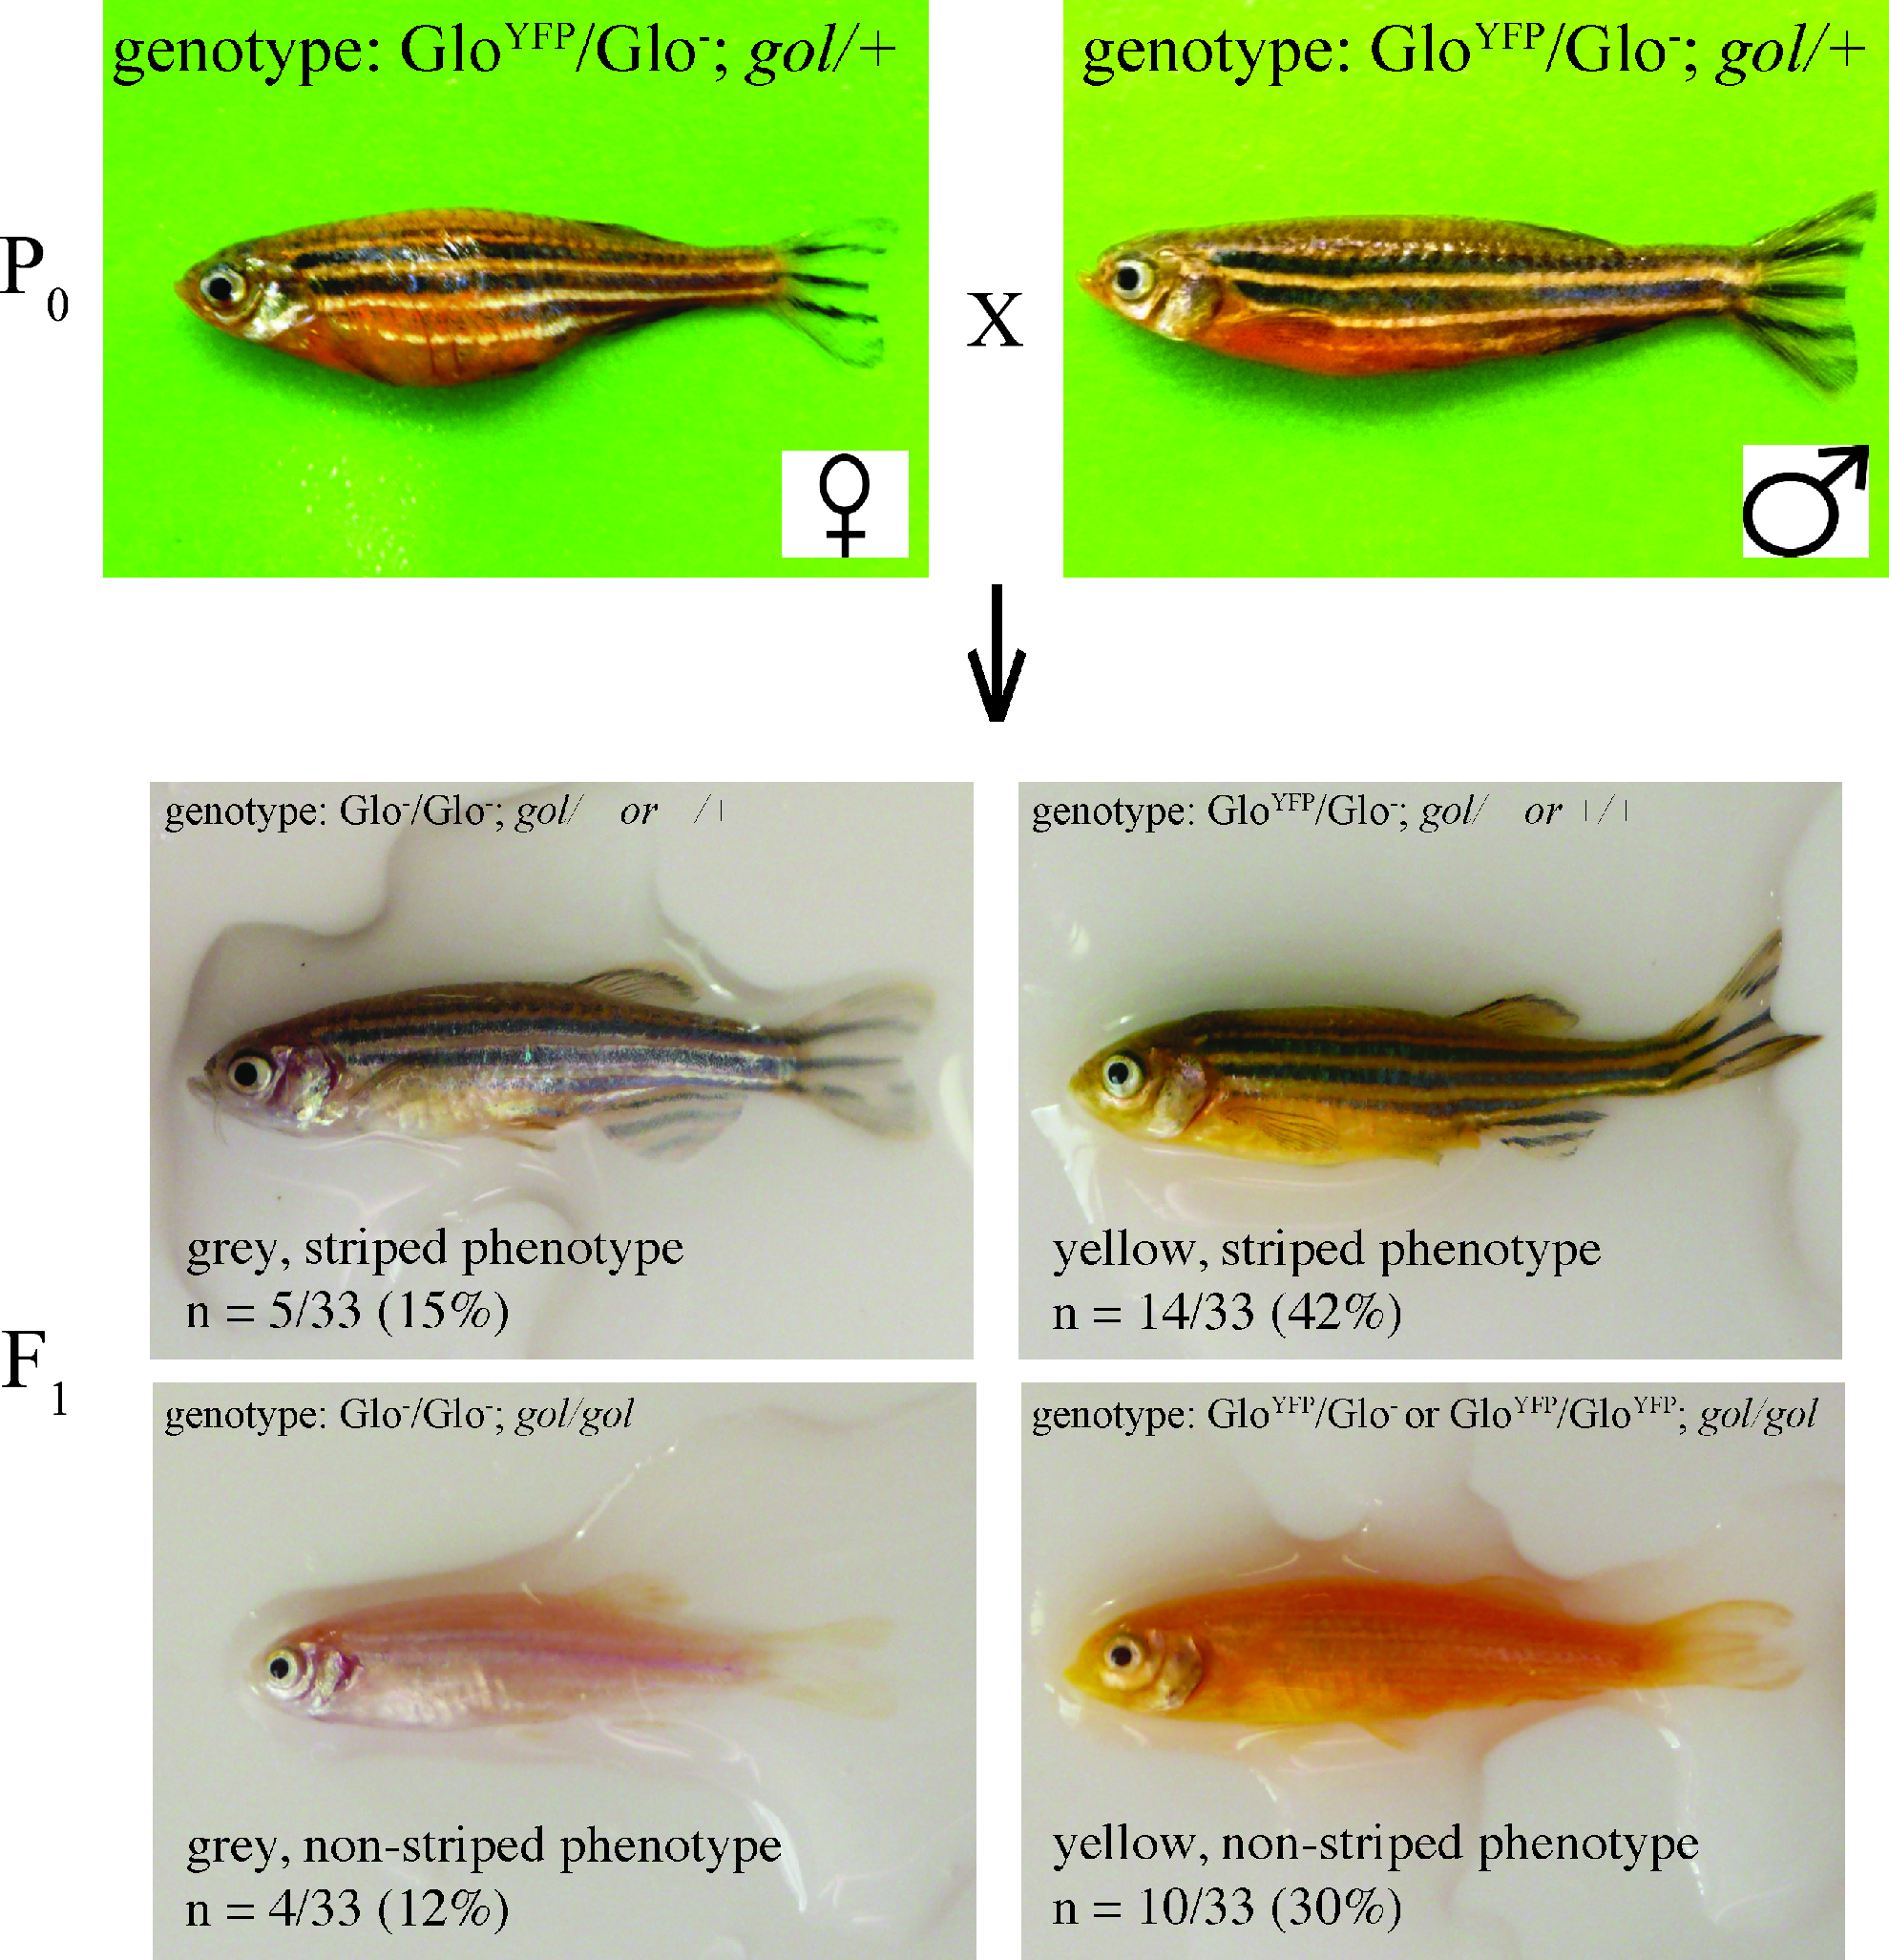
Dihybrid cross of parents heterozygous for GloYFP and gol. The parental (P0) generation consisted of a female and a male fish heterozygous for the GloYFP transgene and the gol mutation. Genotypes at the different loci are separated by semicolons with the genotype at the transgene locus listed first. The F1 generation was produced through a single mating of the P0 pair, with one progeny of each phenotype shown. Images are lateral views, anterior to the left and dorsal to the top. Images of all of the progeny are included in Supplementary Figure 2.
For simplicity, only the correct hypothesis (Fig. 2) is tested here. From our null hypothesis, we expect that 50% of the progeny will be yellow and 100% will be striped (Fig. 2, Table 2). The p-value from the chi-square analysis falls between 0.6 and 0.7, supporting the null hypothesis (Table 2). The number of progeny for this cross is quite low. This offers a strong opportunity for discussions on what experiments could be used to further support the null hypothesis. One possibility is to repeat the experiment to increase the number of progeny analyzed. If the null hypothesis is correct, then increased numbers should cause the p-value to increase. In contrast, if the number of fish increases, but the ratio of fish with each phenotype stays the same, the p-value will decrease. Another possibility is for the students to carry out a chi-square test on the alternative (incorrect) hypothesis, providing support for their hypothesis by disproving the alternative. Perhaps the best approach would be to design an experiment that will give different outcomes whether the hypothesis is correct or incorrect, such as the experiment in Dihybrid cross 2.
This cross could also be used for an even more basic start to the experiment, following only the GloYFP transgene and the body color phenotype as a monohybrid cross. In this case, chi-square analysis for body color generates a p-value between 0.6 and 0.7, and in fact is exactly the same as the chi-square analysis when both phenotypes are considered (Table 3). Note that chi-square analysis cannot be used to analyze the striped/nonstriped phenotypes alone because there is only one phenotype in the progeny, making the degrees of freedom equal to zero.
Dihybrid cross 2
Our second cross is designed to distinguish between the two null hypotheses that fit the data for Dihybrid cross 1. In this cross, both parents have the same phenotype of a yellow body and stripes, and are heterozygous for both GloYFP and gol (Fig. 3). The progeny phenotype ratios are approximately 3:1 yellow:gray and 1:1 striped:nonstriped (Supplementary Fig. 2, Table 4). These ratios should lead students to formulate the null hypothesis that the gol mutation is recessive and the GloYFP transgene is dominant (Fig. 4). Chi-square analysis yields a p-value between 0.1 and 0.15 (Table 4). This p-value supports the null hypothesis, but is close enough to 0.05 to leave some doubt. This low p-value could be used to prompt student discussions on how to decide when a hypothesis is supported. Questions that can be used to stimulate discussion include the following: Does the experiment need to be repeated to increase the number of fish analyzed? If Dihybrid crosses 1 and 2 are considered together, does this increase the support for the hypothesis? Are their alternative hypotheses that could explain these data? Are these alternative hypotheses supported or rejected by chi-square analysis?

Hypothesis for dihybrid cross of heterozygous fish. The hypothesis for the inheritance pattern of the dihybrid cross is presented as Punnett squares generated as in Figure 2.
Calculations for each column and row carried out as in Table 2.
Trihybrid cross 1
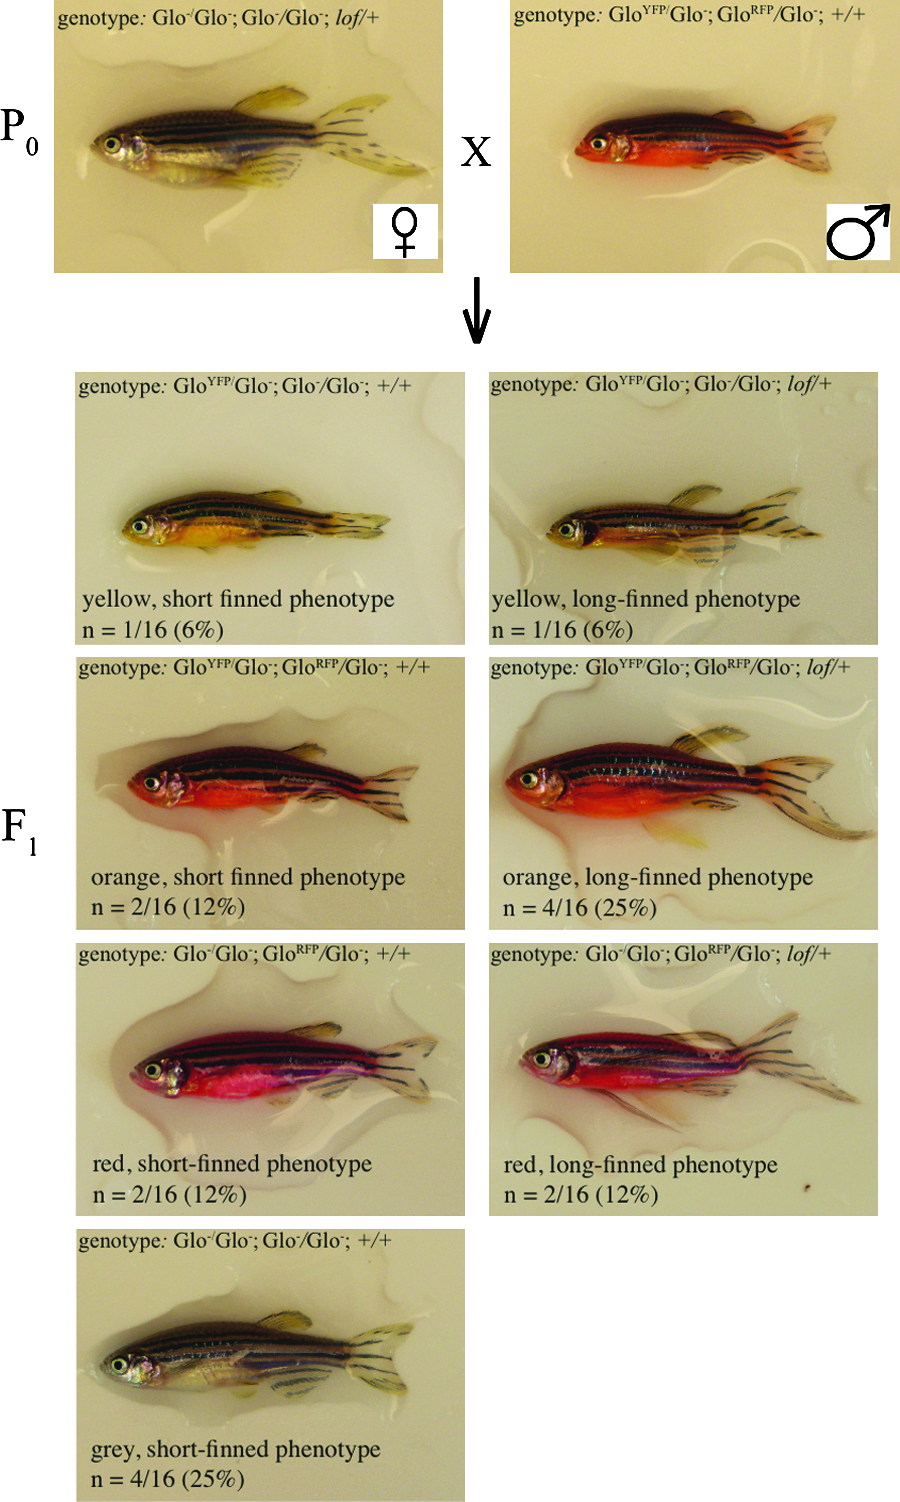
Our next cross, a trihybrid cross, significantly increases the number of phenotypes found in the progeny, and thus the mathematical complexity of the chi-square analysis. A cross between a red, striped female and a yellow, striped male yields progeny with four different colors: gray, yellow, red, and orange, and because both parents are carrying one copy of the gol mutation, two different pigment patterns, striped and nonstriped (Fig. 5, Supplementary Fig. 3).
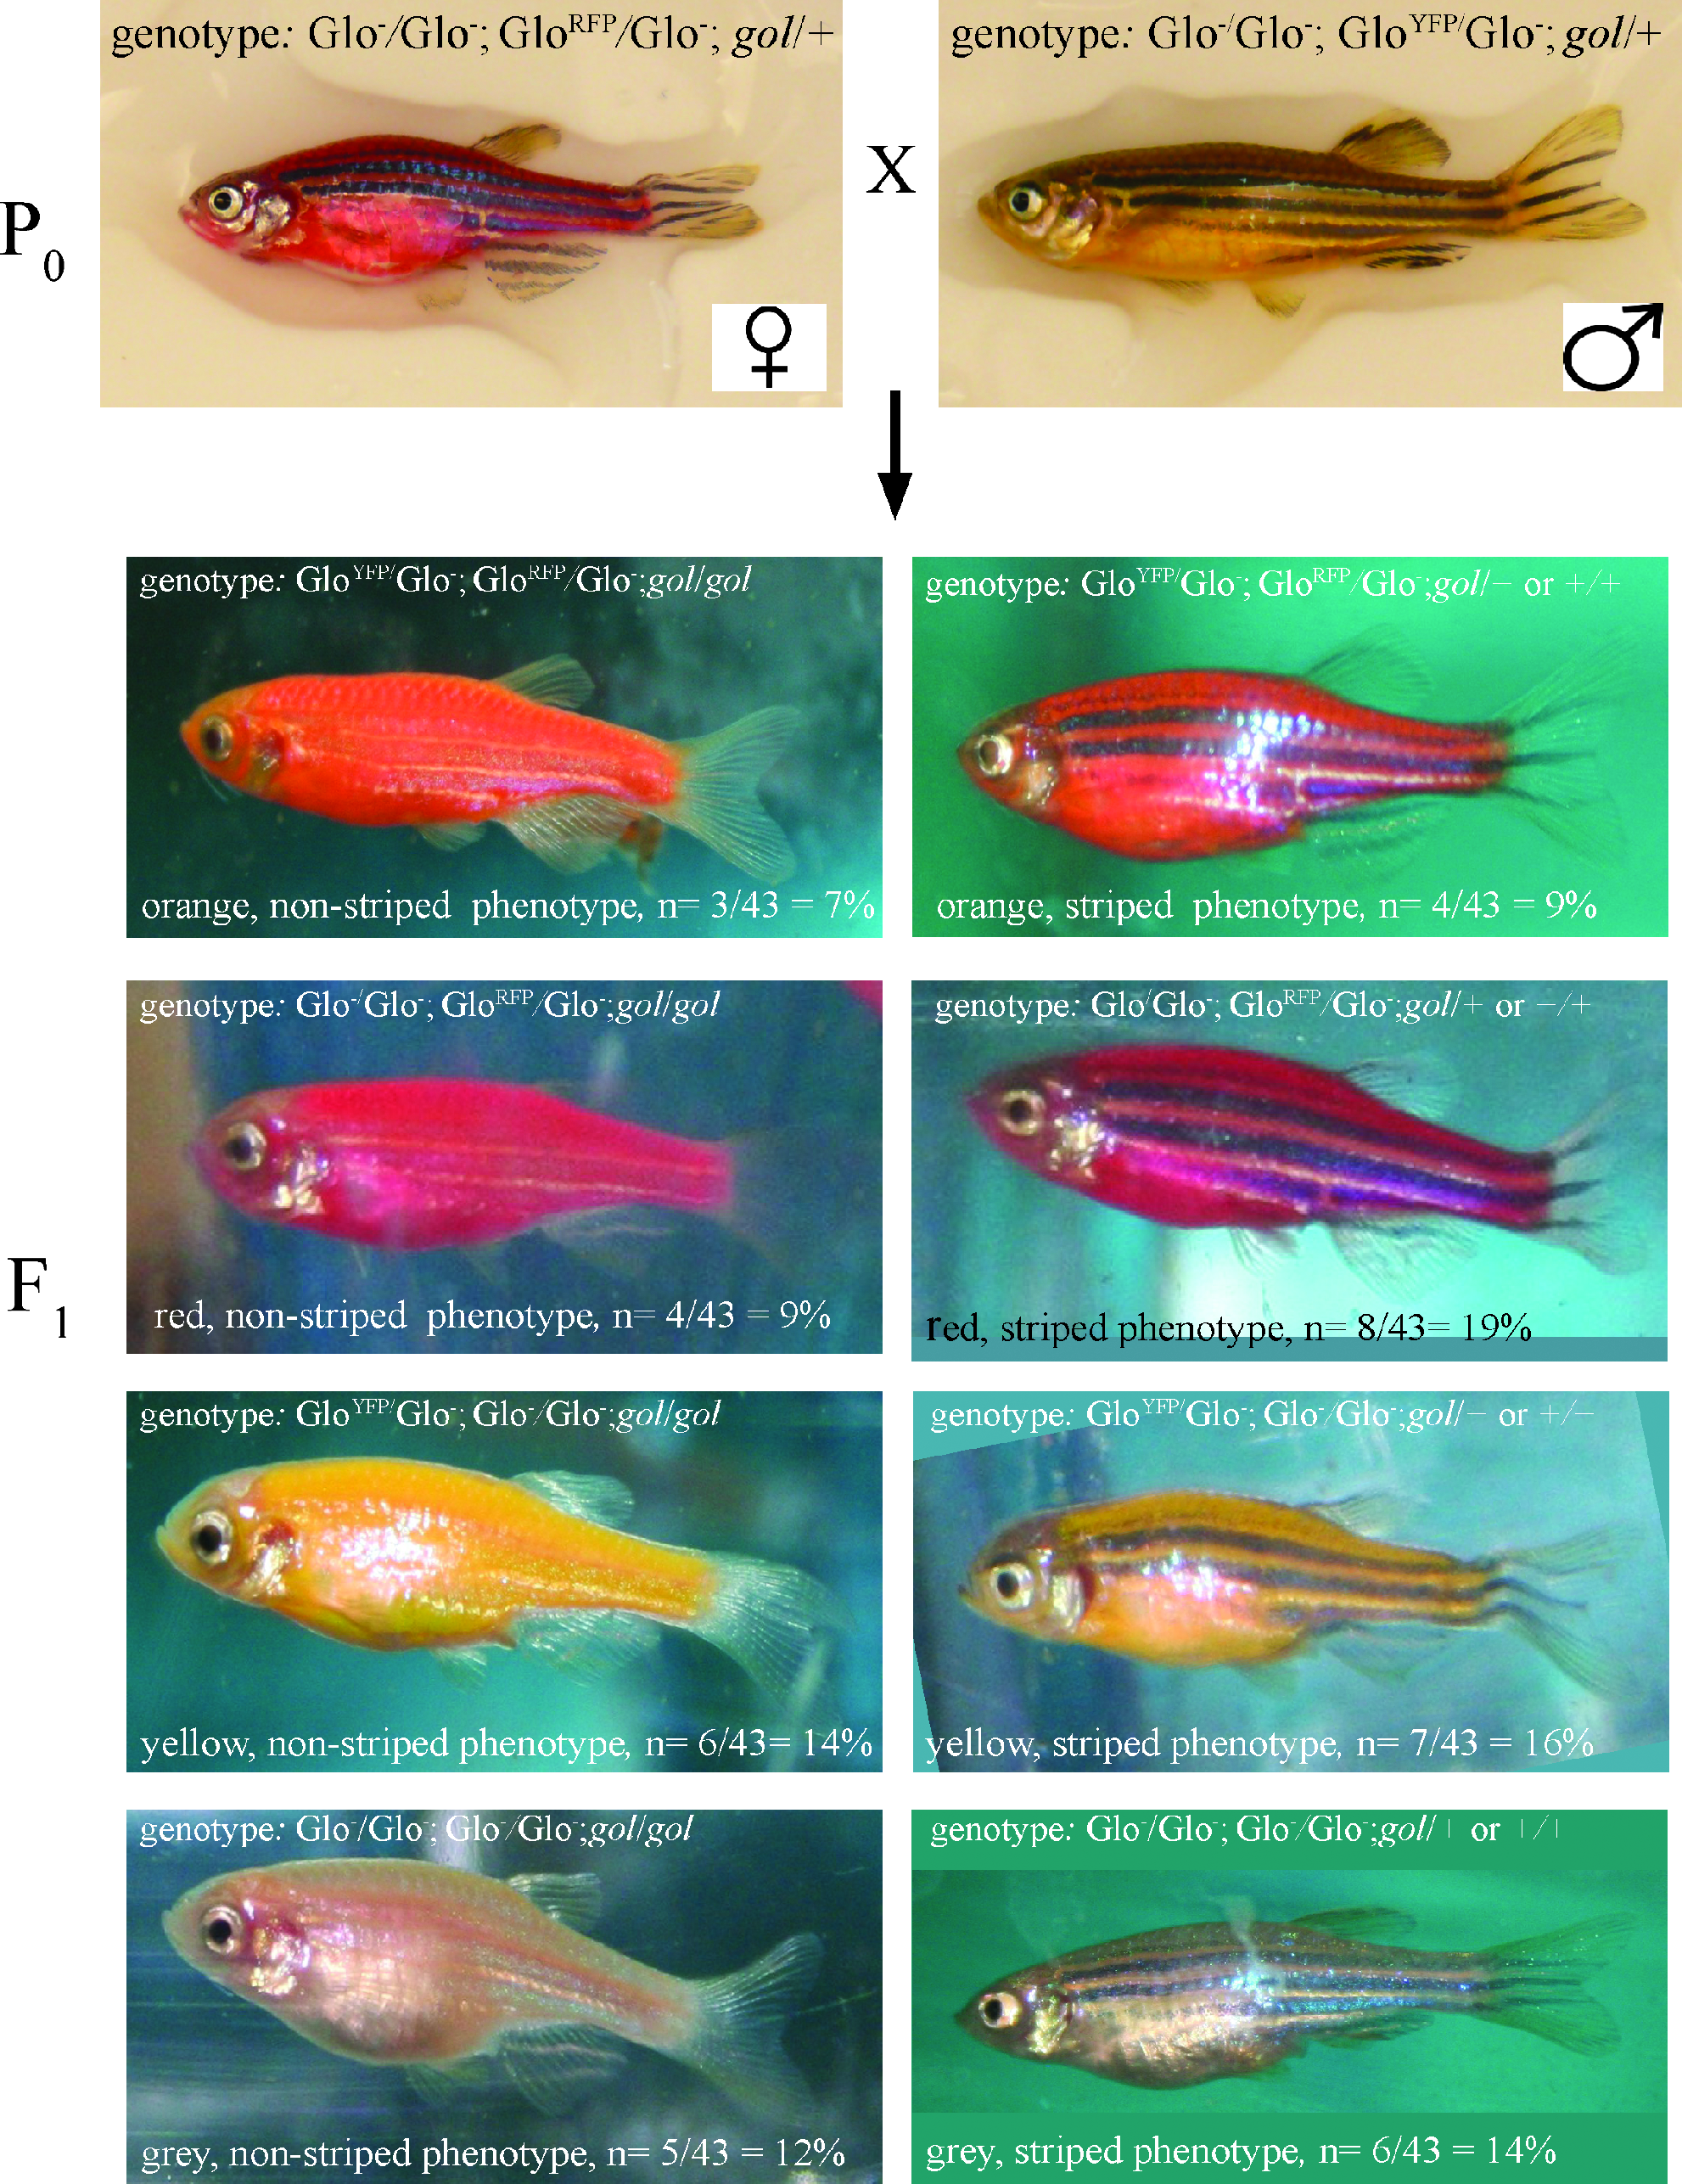
Trihybrid cross with fish carrying Glo transgenes and the gol mutation. The parental (P0) generation consisted of a female fish heterozygous for the GloRFP transgene and heterozygous for the gol mutation and a male fish heterozygous for the GloYFP transgene and heterozygous for the gol mutation. Genotypes at the different loci are separated by semicolons with the genotype at the GloYFP transgene locus listed first. The F1 generation was produced through a single mating of the P0 pair, with one progeny of each phenotype shown. Images are lateral views, anterior to the left and dorsal to the top. Images of all of the progeny are included in Supplementary Figure 3.
This cross also brings in a new inheritance pattern. The presence of orange fish should lead students to form the null hypothesis that the GloYFP and GloRFP transgenes are incompletely dominant with each other: blending of yellow and red produces orange fish, and orange is dominant over the normal gray color. The gol mutation, which causes loss of stripes, is recessive as in the dihybrid crosses. Together, these inheritance patterns lead to the expectation that the progeny will be divided equally among each body color, and that 75% of the fish will have stripes and 25% will be non-striped (Fig. 6). The chi-square test yields a p-value greater than 0.9, indicating any deviation from expected distributions is likely due to chance and the hypothesis is supported (Table 5).

Hypothesis for trihybrid GloYFP; GloRFP; gol cross. The hypothesis for the inheritance pattern of the trihybrid cross is presented as a trihybrid Punnett square generated as in Figure 2. Because there are three loci that must be followed in the cross, there are eight possible gamete genotypes for each parent. The hypothesis predicts that one-eighth of the progeny should have each of the F1 phenotypes shown in Figure 5.
Calculations for each column and row carried out as in Table 2.
Trihybrid cross 2
The second trihybrid cross enables students to practice their analysis skills, introduces a new phenotype and mutation, and explicitly tests whether orange fish are carrying both GloYFP and GloRFP transgenes. In this cross, an orange male with short fins, one of the progeny from Trihybrid cross 1, was mated with a gray female fish with long fins, producing fish that were gray, yellow, red, and orange, with either long or short fins (Fig. 7, Supplementary Fig. 4).
Trihybrid cross with fish carrying Glo transgenes and the lof mutation. The parental (P0) generation consisted of a female not carrying a transgene and heterozygous for the lof mutation and a male fish heterozygous for the GloRFP and GloYFP transgenes. Genotypes at the different loci are separated by semicolons, the GloYFP locus listed first. The F1 generation was produced through a single mating of the P0 pair, with one progeny of each phenotype shown. Images are lateral views, anterior to the left and dorsal to the top. Images of all of the progeny are included in Supplementary Figure 4.
The presence of red and yellow fish should lead to the hypothesis, as in the first trihybrid cross, that GloYFP and GloRFP are incompletely dominant with each other and individually dominant over a gray body color (Fig. 8). Presence of a long-finned phenotype in approximately half of the progeny should lead to the hypothesis that the lof mutation is dominant (Fig. 8). This hypothesis is supported by the chi-square test, which yields a p-value between 0.4 and 0.5 (Table 6).
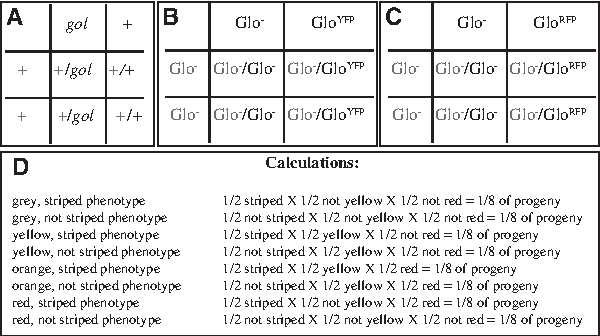
Hypothesis for trihybrid GloYFP; GloRFP; lof cross. The hypothesis for the inheritance pattern of each phenotype in the trihybrid cross is presented as Punnett squares generated as in Figure 2.
Calculations for each column and row carried out as in Table 2.
Laboratory 2: F3 genetic screen
Genetic screens are one of the most powerful techniques in biology. They have been used to identify hundreds of genes with key roles in development, disease, basic cellular functions, and a host of other biological processes and have been the foundations of many Nobel Prizes (for instance, see http://nobelprize.org/nobel_prizes/medicine/laureates/1995/ and http://nobelprize.org/nobel_prizes/medicine/laureates/2002/). This protocol gives students the opportunity to gain experience with forward genetic screens by doing a mock screen, biased so that students will successfully find interesting mutants. Because this F3 screen protocol is longer and requires more skills than the GloFish protocol, it has typically been done in the middle of the semester. It includes Mendelian genetics and the use of chi-square analysis as in the GloFish protocol, but in addition brings in the concepts of forward genetics and the use of model systems. Further, it builds skills in embryology, light microscopy, and even fish husbandry (Supplementary Materials 1, 7–13).
Zebrafish is a relatively new model system. When the field started, the first mutations were induced with gamma radiation. Gamma radiation causes large deletions or translocations in the genome (for instance, see ref. 31 ). Keeping some of these mutant lines going was quite difficult, as chromosome segregation during meiosis was often disrupted. In the mid-1990s, zebrafish research began its exponential growth with the completion of two very large forward genetic screens, one in Tubingen, Germany, and the other in Boston.32–34 These screens used the chemical N-ethyl-N-nitrosourea to induce point mutations, and then kept every mutant line that had a developmental defect (Development Vol. 123, published in December 1996).
The screening methods developed for these large screens are the basis for this protocol (Supplementary Materials 9 and 10). The screen is called F3 because it requires three generations of offspring (F1, F2, and F3) from the parental (P) generation. The students carry out the last step of an F3 screen, which takes three laboratory periods. On the first day of the protocol, students set up several single pair matings, called blind intercrosses, between fish in a tank that contains a mixture of fish heterozygous for a mutation and fish that are homozygous WT (Supplementary Materials 8 and 10). These groups of fish are the mock F2 families. Laboratories maintaining strains of zebrafish with recessive lethal mutations will typically have mixed tanks such as these available, as they are produced in the process of generating the next generation of fish (Supplementary Material 8).
On the second day of the protocol, which ideally would be the following day, students learn how to collect embryos and sort out debris and infertile embryos under a dissecting microscope (Supplementary Material 10). On the third day, which can be the next day or several days later, students screen the F3 embryos for phenotypes, count the ratio of normal to abnormal embryos, make hypotheses about what kind of mutation is present (recessive, dominant, etc.) and the genotype of the parents, and test their hypothesis using chi-square analysis (Supplementary Materials 10 and 11). The primary difference between this protocol and a real F3 screen is that we know that our mock F2 families are carrying mutations and what phenotypes to expect.
The example crosses we present here both use mutants in the Nodal signaling pathway (Figs. 9–12). Zebrafish have three Nodal signaling proteins: Sqt, Cyc, and Southpaw. Mutations in the genes encoding any of these proteins result in severe phenotypic defects and are ultimately lethal.35–38 The most obvious phenotype in cyc and sqt mutants is cyclopic eyes. At 3 days of development, the eyes are pigmented and very large, making the difference between the two eyes of the WT embryo and the cyclopic eye of the mutants easily distinguishable even to students who are observing embryos for the first time (Figs. 9 and 11, Supplementary Figs. 5 and 6).
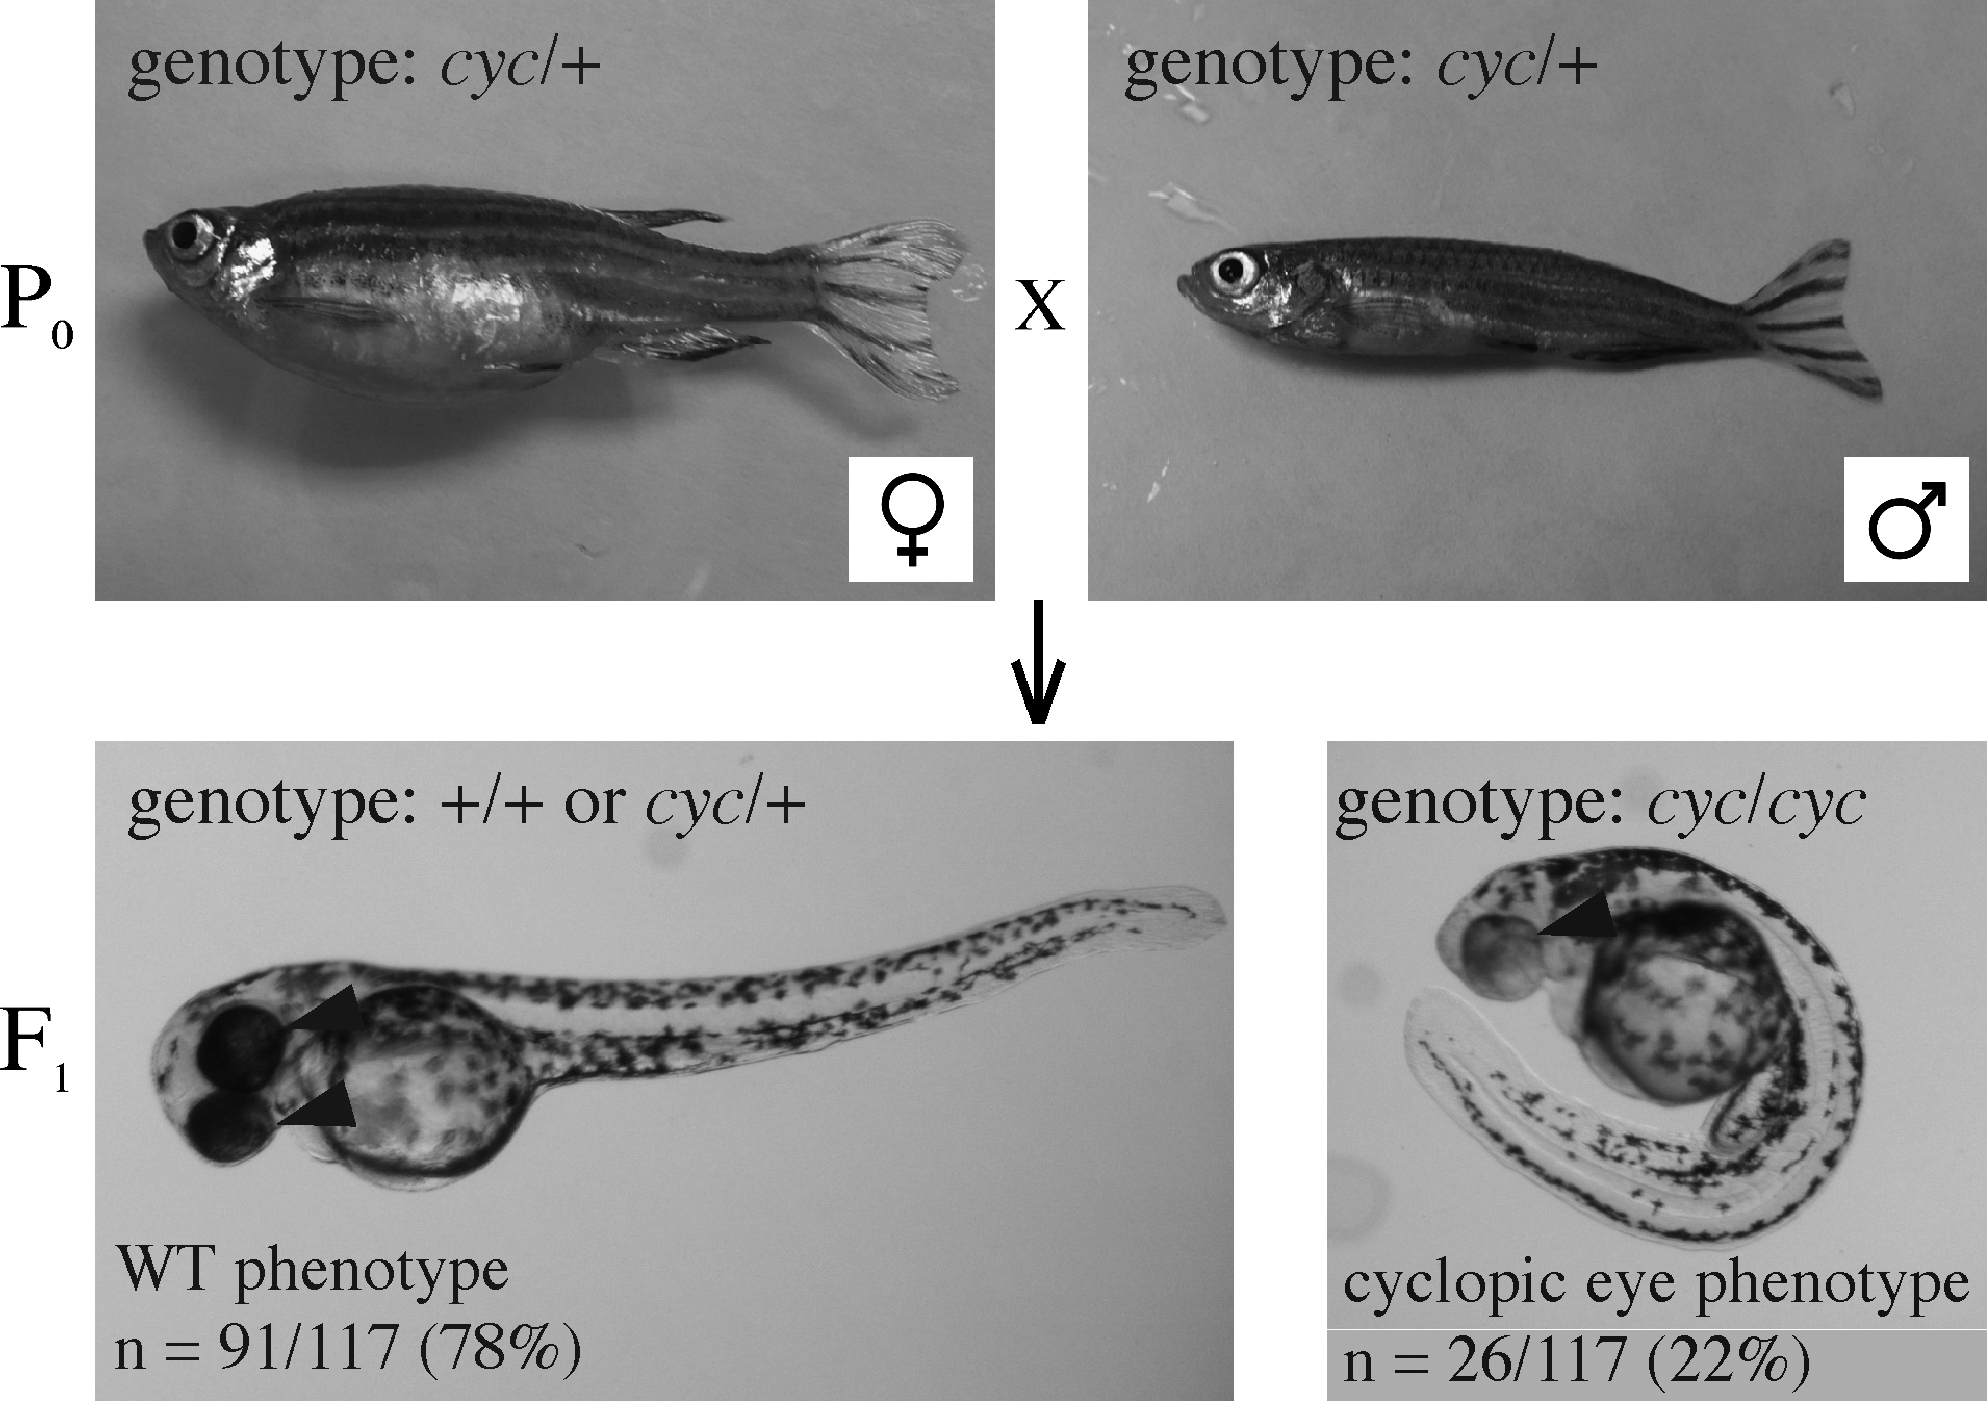
Cross of fish carrying the cyc mutation. The parental (P0) generation consisted of a female and a male fish heterozygous for the cyc mutation. A single natural mating of these fish produced progeny, the F1 generation, with two normal eyes or a single cyclopic eye. The fish with cyclopic eyes also had a severe ventral curvature in the anterior–posterior axis. A typical embryo at 3 days postfertilization is shown for each phenotype. All images are lateral views with anterior to the left and dorsal to the top. Images of all progeny from this cross are included in Supplementary Figure 5.

Hypothesis for cyc cross. The hypothesis for the inheritance pattern of the cyc cross is presented as a Punnett square generated as described for Figure 2. The hypothesized relationship of genotype to phenotype and the Punnett square together generate the prediction that three quarters of the progeny should have normal eyes and one quarter should have cyclopic eyes.

Cross of fish carrying the sqt mutation. The parental (P0) generation consisted of a female and male fish that were heterozygous for the sqt mutation. As with the cyc cross, a single natural mating of sqt heterozygotes fish produced progeny, the F1 generation, with two normal eyes or a single cyclopic eye. Adults are shown in lateral views, anterior to the left, embryos in ventral views with anterior to the left. Pictures of all of the progeny from this cross are included in Supplementary Figure 6.

Hypothesis for sqt cross. The hypothesis for the inheritance pattern of the sqt cross is presented as a Punnett square generated as described for Figure 2. As with the cyc cross, this hypothesis predicts that three quarters of the progeny should have normal eyes and one quarter should have cyclopic eyes.
As with the GloFish laboratory, students are encouraged to work together throughout the laboratory, but written assignments are to be completed individually by each student. The written assignments include the completion of a laboratory notebook entry for each week of the laboratory (Supplementary Material 7), and a homework assignment (Supplementary Materials 12 and 13).
Monohybrid cross using the cyclopsm294 (cyc) mutation
In this experiment, two adult fish heterozygous for the cyc mutation are crossed to produce a clutch of sibling progeny (Fig. 9). The progeny are then scored according to their eye phenotype using light microscopy and the number of progeny with each phenotype is counted. The first cross yields 78% progeny with two WT eyes, and 22% progeny with one cyclopic eye (Fig. 9, Table 7, Supplementary Fig. 5). After combining the progeny from several independent cyc crosses, 74% of the progeny have two normal eyes and 26% of the progeny have one cyclopic eye (Table 8).
Calculations for each column and row carried out as in Table 2.
Calculations for each column and row carried out as in Table 2.
The ratio of fish with a WT eye phenotype to those with a cyclopic eye phenotype is approximately 3:1 (Tables 7 and 8). This ratio should lead the students to pose the null hypothesis that the cyc mutation is recessive (Fig. 10). Chi-square analysis of the single cross generates a p-value between 0.5 and 0.6 (Table 7). The combined data from all the cyc crosses, which included 376 embryos, produces a p-value between 0.6 and 0.7 (Table 8). Thus, both chi-square tests support the hypothesis that cyc is a recessive mutation. Further, as expected, the p-value becomes higher, and the hypothesis more strongly supported, as the number of embryos included in the analysis increases.
Monohybrid cross demonstrating incomplete penetrance
The Sqt and Cyc proteins are 55% identical, and their genes are expressed in many overlapping domains in the developing embryo.39–42 Thus, it is not surprising that sqt mutants share many features in common with cyc embryos, including cyclopic eyes (Fig. 11, Supplementary Fig. 6). However, sqt mutants have some phenotypes that are distinct from cyc. For instance, cyc mutants are curved ventrally, whereas sqt mutants are straight or curved to the left or right (Figs. 9 and 11, Supplementary Figs. 5 and 6). 43
Also, like cyc, the sqt mutation is homozygous recessive. Therefore, the sqt mutant phenotype is observed only in fish with two copies of the mutant allele. However, the sqt inheritance pattern is different from cyc, and thus this cross brings a new aspect of Mendelian genetics to the classroom. The sqt phenotype is incompletely penetrant. In a cross between two heterozygous carriers of the sqt mutant allele, 0% to 25% of the offspring of fish heterozygous for the sqt mutation display the mutant phenotype. The expressivity of the mutant phenotype is also variable. Some homozygous mutants have severe defects, such as complete cyclopia and a curved body axis, some mutants have mild defects such as eyes that are closer together, and other homozygous mutants are indistinguishable from their WT siblings.44–46 The penetrance of the different aspects of each phenotype can also vary, with an embryo, for example, having a curved body axis but normal eyes.44–46
The percentage of homozygous mutants with an abnormal phenotype can vary greatly from clutch to clutch. Because the cyclopic phenotype is the most common and the easiest to identify, the embryos in this cross are scored only for their eye phenotype. In a single clutch generated by a single pair mating of adult fish heterozygous for the sqt mutation, 93% embryos have normal eyes, and 7% embryos have cyclopic eyes (Fig. 11, Table 9, Supplementary Fig. 6). From several combined crosses, there are 98% normal embryos and 2% cyclopic embryos (Table 10).
Calculations for each column and row carried out as in Table 2.
Calculations for each column and row carried out as in Table 2.
Students will likely find it challenging to generate a null hypothesis for these data, as it does not easily fall into a standard Mendelian ratio. In our class, students typically choose to test the hypothesis that sqt, like cyc, is inherited as a recessive allele with a 3:1 WT:sqt ratio expected in the progeny (Fig. 12). Chi-square analysis does not support this hypothesis. For the single cross, the p-value is between 0.01 and 0.02 and for the combined crosses, p is less than 0.001. The finding that the p-value decreases when increased numbers of embryos are analyzed also indicates that this hypothesis is not correct. This analysis of the sqt cross illustrates the ability of statistical analysis to disprove a null hypothesis.
To prompt students to generate possible explanations for the phenotype ratios in these crosses, they can be given a follow-up homework that challenges them to generate a hypothesis that better fits these data (Supplementary Material 13). When this homework is given, we stress that it is meant to be an ill-structured question with many potentially correct answers. Students typically do very well with this homework, with the most common answer being that this ratio comes from a dihybrid cross, with the parents being heterozygous for sqt and another recessive gene. Only embryos that are homozygous for both mutant alleles express the mutant phenotype. A discussion of this homework can serve as an excellent springboard for discussions aimed at designing experiments to distinguish between this and other possible explanations.
Student feedback and assessment
One of the key steps in both the GloFish and F3 Screen protocols is testing student-generated hypotheses using statistical analysis. This step in the protocols enabled students to make connections between their statistics courses and on-the-ground experimental biology. This seemed to be much needed, as informal surveys and our own postlaboratory assessment indicate that students find it challenging to match a p-value with a conclusion about the experiment (Fig. 13B). The GloFish and F3 Screen protocols introduce statistical analysis into a sophomore level course, offering the opportunity to build on this initial exposure in subsequent courses.
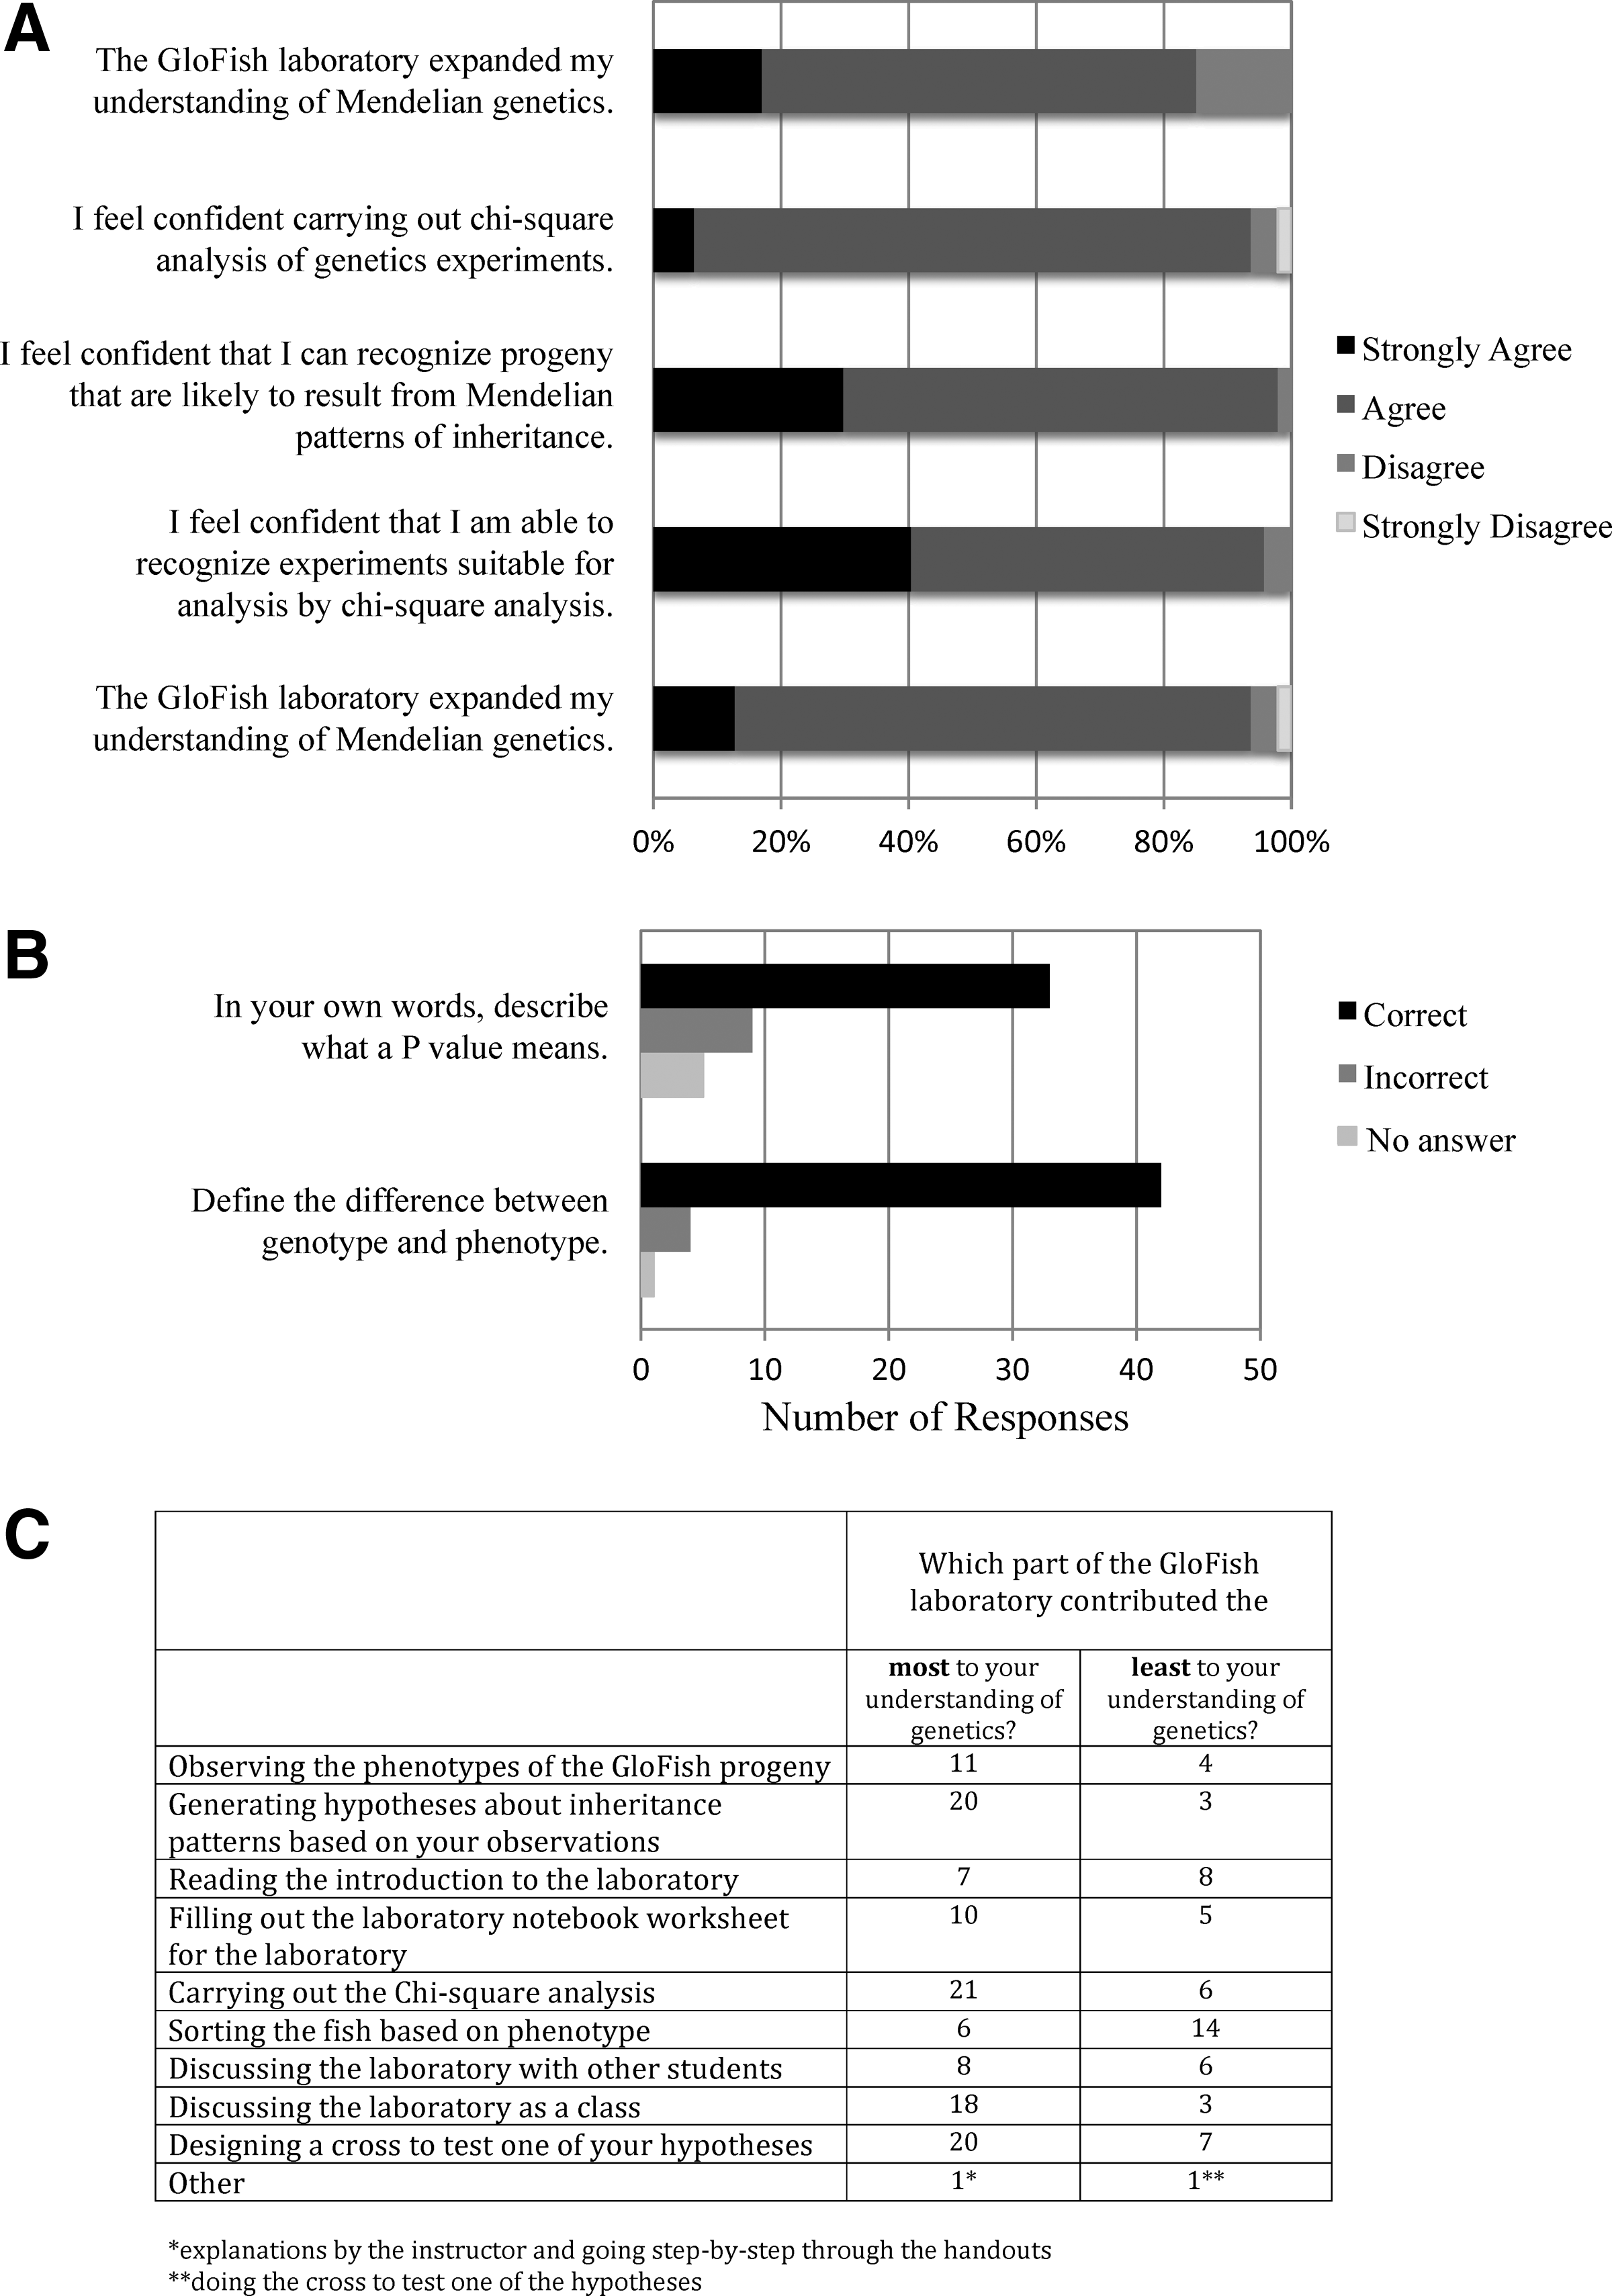
Student Assessment of the GloFish Laboratory. Students in the spring 2011 semester of Genetics Laboratory were asked to fill out an assessment of the GloFish laboratory approximately 4 weeks after they had completed all but the last step (observation of the progeny from their own cross, which does not take place until the end of the semester).
Students reported that the protocols presented here were valuable for cementing their learning of Mendelian genetics, as they complemented and built upon the concepts they learned in their genetics lecture course. Because the experiments in our protocols use real clutches of progeny, they bring the real complexity of genetic analysis into the classroom. For instance, in some crosses, more than one hypothesis is supported by statistical analysis (eg., GloFish Dihybrid cross 1). In other crosses, the ratios of phenotypes in the progeny do not fit well into any Mendelian ratio, and no hypotheses are supported (eg., F3 Screen sqt crosses). Many students found the lack of a clear outcome frustrating. Instructors could avoid this frustration by bringing only sibling groups that fit well into Mendelian ratios and support only one hypotheses. Alternatively, this frustration can be a good learning experience for the students as it offers the opportunity to think creatively. For instance, students very much enjoyed designing and carrying out their own GloFish cross (Fig. 13C, Supplementary Materials 5 and 6).
A voluntary assessment survey completed by students after finishing all but the last step of the GloFish laboratory (they had not yet observed the progeny from their own crosses) indicated a positive experience (Fig. 13). This feedback suggested that students found the analysis and thinking parts of the laboratory most valuable for their understanding of genetics, and the work needed to gather the data the least valuable (Fig. 13C). Most students agreed or strongly agreed that the laboratory increased their confidence with the concepts used, suggesting that it enhanced student learning (Fig. 13A).
Discussion
Building on the GloFish laboratory
The difficulty of this GloFish protocol can be adapted for students carrying out their first experiments in genetics to students beginning their graduate studies. For elementary school students, the simplest GloFish crosses (such as Dihybrid cross 1) can be used to illustrate how a single gene can dramatically change the phenotype of an organism. For middle and high school students, GloFish can be used to explore how genes interact to produce phenotypes. Further, because this protocol includes only pre-algebra mathematics, the use of Mendelian ratios to calculate expected proportions of progeny phenotypes and statistical testing of hypotheses could be easily introduced into pre-college science courses.
This protocol could also be expanded by including analysis of traits that are not only influenced by genetics. Rather than the simple X/X = female, X/Y = male sex determination in mammals, sex determination in fish is extremely varied. 47 In the case of zebrafish, there are no sex chromosomes. Whether a fish is female or male is determined by multiple genes located on autosomes, although the specific genes are just starting to be isolated.48,49 Environmental factors, such as temperatures outside of the normal range and addition of hormones, can also influence gender. 49 Because of these many contributing factors, it is quite common for clutches of sibling fish to be mostly male or mostly female, even when fish are raised in a relatively controlled laboratory setting. Thus, comparing the gender ratios in different clutches can illustrate that the inheritance of even some major phenotypes, like whether a fish is male or female, may defy analysis by Mendelian genetics (Supplementary Figs. 1, 7–9, Supplementary Tables 1 and 2). Uncovering the explanation for the variation in gender ratios from clutch to clutch can form a challenging puzzle for upper-level students. Their research into this subject could be an entry into the sophisticated approaches that have been used to uncover traits and diseases that are controlled by multiple genes.
Finally, our protocol is aimed at early stage college students, but there are many other possibilities for building GloFish into upper level undergraduate and even graduate courses. For instance, the GloFish transgenes encode GFP and other related fluorescent proteins (Fig. 14). In 2008, Drs. Osamau Shimomura, Martin Chalfie, and Roger Tsien won the Nobel Prize in Chemistry for their research on GFP (http://nobelprize.org/nobel_prizes/chemistry/laureates/2008/). This protocol on GloFish could serve as an introduction to this Nobel Prize–winning research and how transgenic/genetic engineering approaches are being used to treat human disease.

GloFish fluorescence.
Building on the F3 genetic screen laboratory
The F3 Genetic Screen protocol can be used to introduce the concept of model organisms and to teach developmental genetics, embryology, and the genetics of human birth defects and human disease. For instance, many disease genes, like sqt, have incomplete penetrance. Mutations in the BRCA1 and BRCA1 genes are associated with increase risk of breast cancer, but are in no way indications that 100% of the women carrying these mutations will develop the disease. 50 Environmental influences as well as genetic background influence whether the women carrying the mutation will go on to develop breast cancer. 50 Likewise, studies by Dr. Ben Feldman and colleagues have shown that environmental factors and genetic background similarly affect the penetrance of the sqt mutant phenotype. 46
The F3 Genetic Screen protocol is used as part of a larger set of laboratories that give students exposure to forward and reverse genetics (Supplementary Material 9). To complement these experiments in zebrafish, students also carry forward genetics experiments on Drosophila. In particular, we have found that the antennapedia mutant flies available from Carolina Biological (www.carolina.com) have characteristics similar to sqt: the phenotype (antennas are replaced by legs) is incompletely penetrant and has variable expressivity. Since Drosophila have the advantage of a very fast generation time, students are able to follow the penetrance and expressivity of the phenotype over several generations and generate and test hypotheses about the underlying causes of the variability. Students gain experience in reverse genetics by feeding C. elegans worms with bacteria carrying different constructs that make double-stranded RNA, and by injecting antisense morpholinos into zebrafish (www.zfic.org/classroom%20experiments/microinjectionindex.html).51–53
Footnotes
Acknowledgments
This work was supported in part through University of Minnesota Undergraduate Research Opportunity (UROP) Awards to S.L. and J.S. Publication costs were supported by the UROP Program, and the University of Minnesota Duluth Swenson College of Science & Engineering and Department of Biology. We would like to thank Dr. Paul Bates for his many excellent suggestions for improving the article, Tonya Connor for her expert advice on the student assessment survey for the GloFish protocol, and Adelle Schumann for her technical support. In addition, we would like to thank the teaching assistants and students of the Genetics Laboratory course for piloting this protocol and for all of their valuable ideas for improvement, and all of the students who have helped with maintenance of the fish and fish facility.
Disclosure Statement
No competing financial interests exist.
References
Supplementary Material
Please find the following supplemental material available below.
For Open Access articles published under a Creative Commons License, all supplemental material carries the same license as the article it is associated with.
For non-Open Access articles published, all supplemental material carries a non-exclusive license, and permission requests for re-use of supplemental material or any part of supplemental material shall be sent directly to the copyright owner as specified in the copyright notice associated with the article.