
Abstract
Abstract
Welfare of fish is commonly neglected when they are transported. This study examines the effect of a 72-h mock transport on certain aspects of the stress physiology of two groups of zebrafish—the first transported in water enriched with a nitrifying bacterial consortium and the second in water without the enrichment.
Zebrafish were examined at different time points—before packing (BP), immediately after packing them in transport bags (AP), at the end of transport (AT), and 72 h thereafter (PT)—to assess the primary (cortisol) and secondary (glucose) stress responses. In addition, the relevant genes in hypothalamic-pituitary-interrenal (HPI) axis (crf in brain, mc2r, star, cyp11c1, and hsd11b2 in kidney), including that of mineralocorticoid receptor (mr in kidney), were studied.
Procedures during packing caused an increase in whole body cortisol levels of both fish groups. Only in the fish transported without the bacterial consortium, an increase in the levels of whole body cortisol as well as blood glucose was observed at the end of the transport. At the same time point and in the same fish group, the transcripts of mr and hsd11b2 were enhanced, probably to cope with the stress and to maintain homeostasis. The mRNA levels of the other genes in the HPI stress axis (crf, mc2r, star, and cyp11c1) were not significantly altered. Zebrafish transported in water enriched with the bacterial consortium exhibited a speedier stress acclimation. Nevertheless, only through in-depth studies the beneficial effect of the consortium can be confirmed.
Introduction
The response to stress in fish is primarily mediated by the neuroendocrine system involving chromaffin tissues 24 and the hypothalamic-pituitary-interrenal (HPI) axis. 25 HPI axis controls the release of cortisol in response to stress.25,26 This stress response starts with the release of corticotropin releasing factor (CRF) from hypothalamus, which in turn stimulates the release of adrenocorticotropic hormone (ACTH) from the anterior pituitary. 25 This hormone binds to melanocortin 2 receptor (MC2R) on the interrenal steroidogenic cells and activates corticosteroid biosynthesis. 27 Several enzymes catalyze the biosynthesis of corticosteroid—the pathway that starts with the rate-limiting step in steroidogenesis, during which steroidogenic acute regulatory protein (StAR) regulates the transport of cholesterol to the inner mitochondrial membrane, ends with the mediation of 11β-hydroxylase (CYP11C1) to convert 11-deoxycortisol to cortisol.18,28,29 The level of cortisol that is in circulation will be regulated by the enzyme 11β-hydroxysteroid dehydrogenase 2 (HSD11B2), which facilitates the conversion of cortisol to inactive cortisone. 30 The mineralocorticoid receptor (MR) that is also activated by cortisol in fish is involved in osmoregulation and control of stress axis,31–35 and its overstimulation is restricted by HSD11B2. 36
The main objective of this mock transport study on zebrafish (Danio rerio) was to assess the effect of the transport process on the primary (cortisol) and secondary (glucose) stress responses of the fish and link them to certain molecular mechanisms by targeting the relevant genes involved in the HPI axis (crf, mc2r, star, cyp11c1, and hsd11b2) and that of the mineralocorticoid receptor (mr), which specifies the function of cortisol. In addition, as we have already clarified that the application of a nitrifying bacterial consortium in transport water could ease ammonia accumulation in zebrafish transport units, 10 the plausible differences in stress responses upon application of this bacterial consortium were also investigated.
Materials and Methods
Experimental fish
The zebrafish used in the study were purchased from a local supplier (Febo Norge AS, Oslo, Norway) who imported them from Singapore. Fish that ranged in size from 4 to 4.3 cm were initially maintained for 1 week in a 200-l glass aquaria equipped with a water recirculation system before being transferred to 10-l tanks (60 fish/tank) on an Aquatic Habitat bench-top recirculation system (Aquatic Eco-Systems Inc., Apopka, FL) where they were maintained for 2 weeks. To maintain good water quality, 10% of water in the system was replaced daily with fresh water, as per the instructions of the manufacturer (Aquatic Eco-Systems, Inc). Temperature was monitored daily and total ammonia nitrogen (TAN), nitrate (NO3), pH, and oxygen saturation were monitored thrice every week using the methods described in the section Water Quality Parameters. The recorded average water quality parameters were: TAN, 0.11 mg l−1; NO3, 35 mg l−1; pH, 7.5; and oxygen saturation, 93%. A photoperiod regime of 12 h light–12 h dark and water temperature of 26°C were maintained in the rearing system. The fish were fed twice a day (morning and evening) to apparent satiation, with commercial flakes (Tetramin Tropical Flakes; Tetra Werke, Melle, Germany), but were starved for 24 h prior to the transport experiment. The study was approved by the National Animal Research Authority (FDU) of Norway, and the reference number is ID 2455. Rearing and handling of the fish were carried out according to the guidelines of FDU (www.fdu.no; see “Forskrift om forsøk med dyr”).
Design of the transportation experiment and sample collection
Two groups of fish were considered for the mock transport study—one group with the nitrifying bacterial consortium added to the transport water (Nbc1) and another group without the addition of bacteria (control). Nbc1 was earlier found to effectively control the accumulation of ammonia during transport. 10 It is a commercial liquid product that contains Nitrosomonas spp. as ammonia-oxidizing bacteria and Nitrobacter spp. as nitrite-oxidizing bacteria, details of which were presented in our previous study. 10
Five-liter plastic bags fitted with spigots were used for the transport study. These bags were filled with 1.5-l water and charged with 3.5-l pure oxygen, according to industry practice. 1 Forty-five fish were randomly transferred from the individual tanks of the bench-top recirculation system to each of the transport bags, maintaining a stocking density of 30 fish l−1 in each bag. Sixteen bags were used for the experiment—eight bags each for the control and treatment groups. The dosage of nitrifying bacterial consortium (10.5 ml to yield a final concentration of 7 ml l−1 in the transport water) employed was the same as reported earlier. 10 A mock transport study was conducted, generally in accordance with the shipping practices adopted by the ornamental fish trade industry. 37 The 72-h study was performed in a temperature-controlled (26°C) dark room to avoid temperature-induced stress on fish. Different time points that are considered in this study include before packing (BP; considered as the prestress group), immediately after packing fish in transport bags (AP), at the end of transport (AT), and 72 h thereafter (PT; considered as the recovery group). Undisturbed fish (24) from two individual tanks of the bench-top system were sampled prior to the transport experiment, representing fish prior to stress BP.
From each of the control and Nbc1 groups, 24 fish were randomly collected from two bags selected at random at AP and at AT. The bags that were opened at AP were removed from the set-up. At AT, two bags that were unopened during the study, from both control and Nbc1 groups, were placed in individual 10-l tanks of the bench-top system for 15 min to acclimatize the fish to the temperature of the rearing system. Immediately after opening the bags, all fish (45) in a particular bag were released into separate tanks of the bench-top system. These fish were fed until the evening before PT sampling. Fish collected at all time points were terminally anaesthetized with a lethal dose (200 mg l−1) of tricaine methanesulfonate (MS222; Argent Chemical Laboratories, Redmond, VA). The fish that were to be used for whole body cortisol measurements (6 fish) and mRNA expression analysis (8 fish) were immediately frozen in liquid nitrogen and stored at −80°C. Blood, drawn using a capillary tube after caudal incision from the remaining 10 fish at different time points, was straightaway used for blood glucose measurements, as described later.
Water samples were collected via the spigot (AP, 8 bags, and AT, 6 bags each in control and Nbc1 groups). These water samples were stored at −40°C until they were used for analysis. At each time point, temperature and oxygen saturation of the water in the bags were also measured when they were opened for sampling.
Water quality analysis
TAN was determined using ammonia high-performance, ion-specific electrodes (9512HPBNWP; Thermo Fisher Scientific, Beverly, MA), and nitrate was measured using the nitrate combination ion-specific electrode (3021; EDT Direct Ion Ltd., Dover, United Kingdom), following the manufacturer's instructions. Oxygen was measured using a portable dissolved oxygen meter (OxyGuard International AS, Birkeroed, Denmark) and pH was measured employing a pH meter (Mettler-Toledo International Inc, Columbus, OH).
Blood glucose and whole body cortisol analysis
Briefly, 2 μl of the fresh blood sample was placed on a test strip of the glucose monitoring system (FreeStyle Lite® system; Abbott Norge AS, Fornebu, Norway), as per the instruction of the producer, to measure the blood glucose level.
For the whole body cortisol analysis, individual zebrafish were weighed and partially thawed. Each fish was then cut into several small pieces and homogenized with 1 ml of ice cold phosphate-buffered saline (Sigma-Aldrich Cheme GmbH, Munich, Germany) for 30 s using a tissue homogenizer (VWR®VDI 12 Adaptable Homogenizer; VWR, Oslo, Norway). Cortisol was extracted from the homogenate three times using 5 ml of diethyl ether (Sigma-Aldrich). For each extraction, the glass tube containing ether and the homogenate was vigorously vortexed for 30 s and briefly centrifuged (600×g for 2 min) to separate the aqueous and ether layers. The ether layer was decanted into a separate tube after freezing the aqueous layer using dry ice. The ether in the tube was then allowed to evaporate completely by placing the tubes first in a water bath at 40°C for 1 h and overnight at room temperature under a hood. The steroid along with the fat collected after the evaporation was again dissolved in 5 ml of ether. From this, 1 ml was transferred into a separate tube that was placed in a water bath at 40°C for approximately 30 min to remove the ether. The residue was then reconstituted in 1 ml of assay buffer from the cortisol enzyme immunoassay kit (Cayman Chemical Company, Ann Arbor, MI). Cortisol was analyzed using the colorimetric 96-well assay plate following the manufacturer's protocol. All samples were analyzed in duplicates. Extraction efficiencies were calculated after performing three extractions with the addition of known amounts of cortisol. The mean recovery efficiencies of samples spiked with 4 ng of cortisol (resultant average body cortisol of three fish was 16.5 ng g−1) was 103%, and therefore the values reported were not corrected for efficiency.
RNA extraction
The mRNA level of crf was analyzed in the brain while those of mc2r, star, and cyp11c1 were analyzed in the kidney. The expression of mr was examined in the kidney, a key mineralocorticoid target tissue. The gene responsible for the metabolism of cortisol, hsd11b2, was also studied in the kidney. Total RNA was extracted from whole brain and kidney using QIAzol lysis reagent (Qiagen AB, Sollentuna, Sweden) according to manufacturer's instructions. Tissues were homogenized for 15 s at 6000×g with approximately 100–200 mg zirconium oxide beads (1.4 mm; Precellys, Montigny-le-Bretonneux, France) using the tissue MagNALyser (Roche, San Francisco, CA). The integrity of RNA was confirmed by 1.2% (w/v) agarose gel electrophoresis, and the RNA quantity was measured using Qubit™ fluorometer (Invitrogen, Eugene, OR). After removing the possible genomic DNA contaminations using gDNA wipeout buffer (Qiagen), cDNA was synthesized from 1 μg of RNA using QuantiTect reverse transcription kit (Qiagen) following the manufacturer's protocol.
Quantitative real-time polymerase chain reaction
Primers used for the quantitative real-time polymerase chain reaction (qPCR) studies are listed in Table 1. At least one primer in each pair was designed to span one intron/exon border, as detailed elsewhere. 38 A reaction mixture containing 5 μl Power SYBR® Green PCR master mix (Applied Biosystems, Warrington, United Kingdom), 4 μl template (1:20 dilution), and 0.5 μl of each primer (250 nmol) was used to perform qPCR analysis on a StepOne Plus™ instrument (Applied Biosystems). The cycles, thermal profile, and time used were as follows: initial activation of 2 min at 50°C and 10 min at 95°C, followed by 40 cycles of 15 s at 95°C, 20 s at 60°C, and 30 s at 72°C. A dissociation profile was determined after each run to ensure the specificity of the primers and to detect the presence of primer dimers. Six-point standard curves were prepared for the cDNA obtained from three-fold serially diluted pooled RNA of all the samples from a particular tissue, and this curve was used to estimate the PCR efficiency of each amplicon as described by Fernandes et al. 39 Negative controls employed were: i) minus reverse transcription to ensure that there was no genomic contamination and ii) no template to confirm that there was no reagent contamination. All the reactions were carried out in duplicate and Cq values were averaged. The stability of four reference genes (Table 1) in each tissue was evaluated using geNorm, 40 as follows: i) eef1a, g6pd, b2m, and tbp for brain and ii) eef1a, g6pd, bactin1, and tuba1 for kidney. The normalization factor corresponded to the geometric average of the most stable genes from the brain, g6pd and b2m, and kidney, g6pd and eef1a. These factors were used for normalization of the expression level of target genes from corresponding tissues. Relative quantification method as reported in Fernandes et al. 38 was used to evaluate the expression of crf in whole brain, as well as star, mc2r, cyp11c1, hsd11b2, and mr in whole kidney tissues.
Crf, corticotropin releasing factor; mc2r, melanocortin 2 receptor; star, steroidogenic acute regulatory protein; cyp11c1, 11β-hydroxylase; hsd11b2, 11β-hydroxysteroid dehydrogenase 2; mr, mineralocorticoid receptor; eef1a, elongation factor 1-alpha; g6pd, glucose-6-phosphate dehydrogenase; b2m, beta-2-microglobulin; tbp, TATA-box-binding protein; tuba1, tubulin alpha 1.
Statistical analysis
The transport bags were considered as the experimental units for analyzing the data on water quality parameters. The data from the fish from these bags were analyzed to understand the effect on the selected physiological and molecular markers. For stress indicators such as body cortisol, blood glucose, mc2r, cyp11c1, hsd11b2, mr, and for TAN two-way analysis of variance (ANOVA; time points×treatments of control group and Nbc1 group) was used to analyze the data. Bonferroni multiple comparison post-hoc tests were employed to find the significant differences between the means of interest. All pertinent assumptions were checked before performing each analysis and data were transformed whenever necessary. For water quality parameters (nitrate and pH) and genes (crf, star), Kruskal-Wallis test with Dunn's multiple comparison post-hoc test was employed to find the differences among the means of interest. Graph Pad Prism v5.0 software (Graphpad Software Inc., La Jolla, CA) was used for statistical analysis, and the significant differences are reported when p<0.05.
Results
Water quality parameters
The values of water quality parameters recorded for the rearing system at BP and PT were as follows: TAN, 0.13 and 0.15 mg l−1; NH3, 0.0025 and 0.0018 mg l−1; nitrate, 33.6 and 35 mg l−1; pH, 7.5 and 7.3; temperature, 26°C and 26°C; and oxygen saturation, 94% and 93%, respectively. The corresponding measurements, connected to transportation, in control and Nbc1 groups at AP and AT are given in Table 2. The average of the measured water quality parameters in the two randomly selected units of the control and Nbc1 group, from which fish were collected for studying the physiological markers and gene expressions, are also included in Table 2 (within brackets). The average temperature in both the control and Nbc1 groups was 23.9°C at AT (Table 2).
The values within parentheses are the average measurements of the water quality parameters from the two randomly selected transport units of the control group and the group transported in water enriched with the bacterial consortium (Nbc1 group), from which fish were collected for studying the physiological markers and gene expression.
Values are presented as means±SEM; n=8 at AP and n=6 at AT.
Indicates significant differences (p<0.05) between AP and AT within each treatment group. bIndicates significant differences (p<0.05) from the control.
As for the TAN data, interaction of time point and treatment was significant (p<0.0001). Further, TAN was affected by both factors. Compared to the control group, transport water of Nbc1 group had a significantly lower (p<0.0001) TAN concentration and an increase in nitrate concentration (p>0.05) at AT. At the same time point, pH values of the transport water for the two groups did not differ. Both groups had significantly high TAN (p<0.0001) and nitrate concentrations (control, p<0.01; Nbc1, p<0. 05) at AT when compared to AP. A significant decrease (p<0.01) in pH at AT, compared to AP, was noted only for the transport water of the Nbc1 group (Table 2).
Physiological parameters
For most of the physiological parameters, including gene expression, time point×treatment interaction was not detected. The exception was for blood glucose.
Whole body cortisol
Cortisol values were affected by the time point (p<0.001) and treatment (p<0.05). At AT the whole body cortisol of fish from Nbc1 group was significantly lower (p<0.05) than that of fish from the control group (Fig. 1). Both groups of fish had significantly high (p<0.0001) cortisol levels at AP compared to those at BP. At AT, whole body cortisol of fish in Nbc1 group returned to the pre-stress levels but not that of control fish, which remained significantly high (p<0.01).
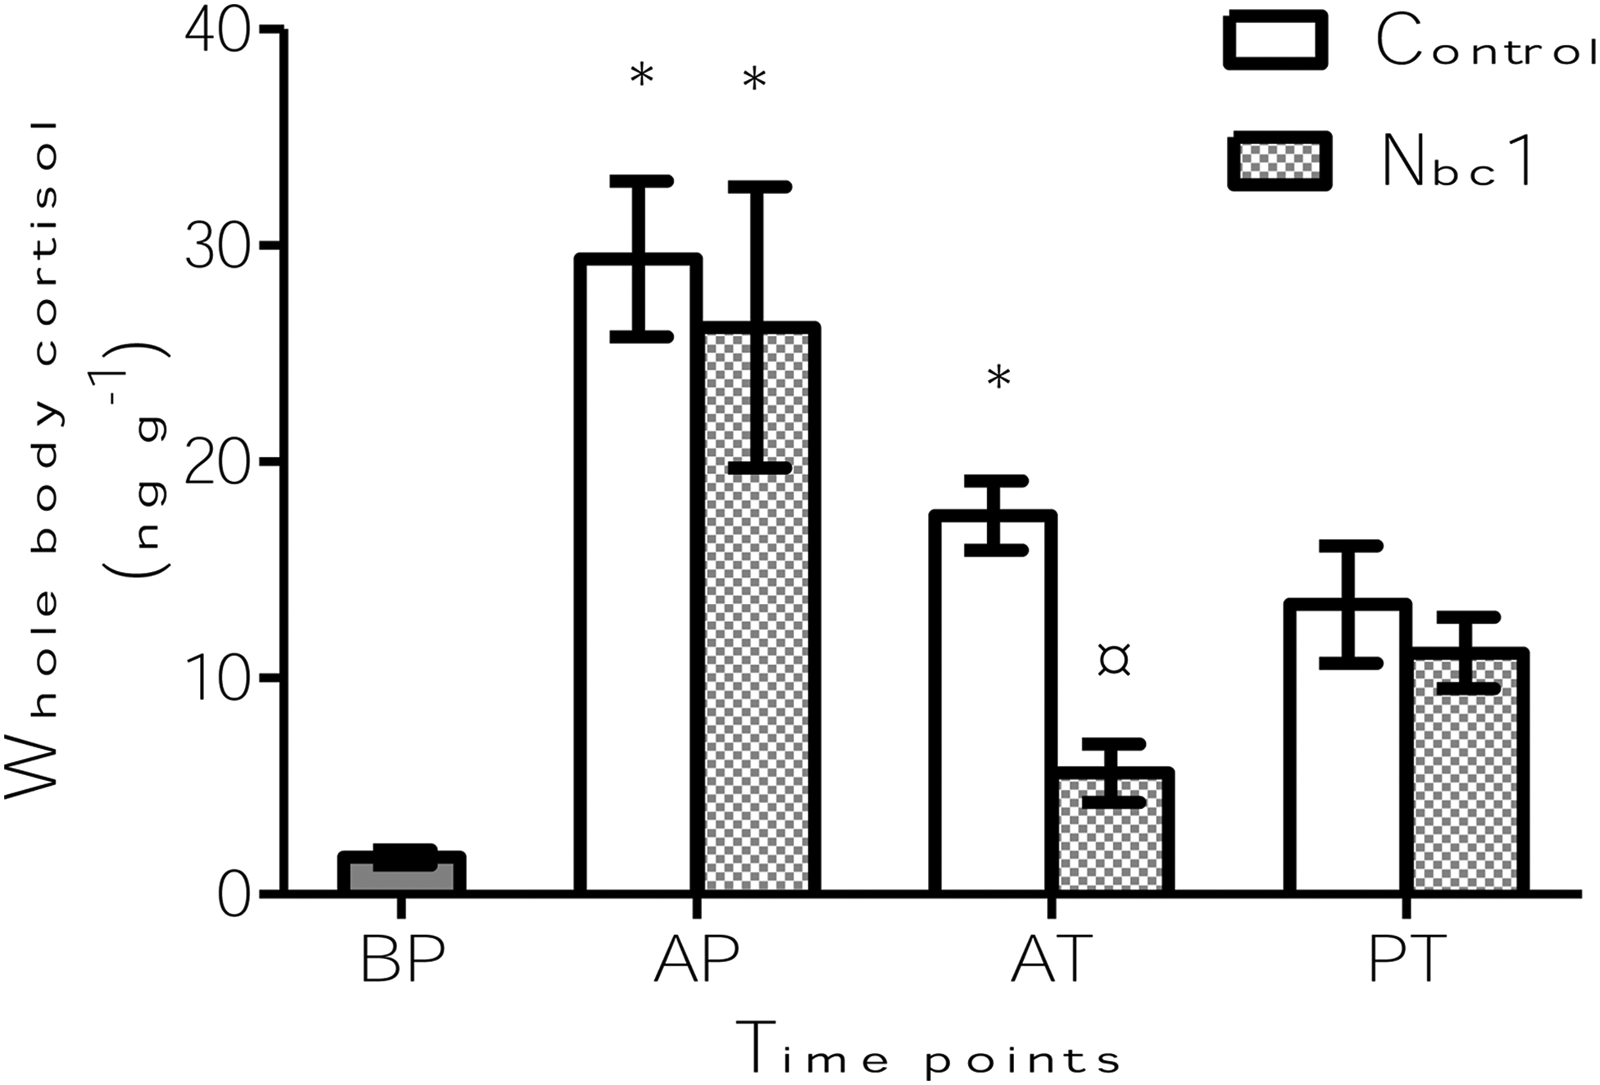
Whole body cortisol levels of zebrafish in transport units with (Nbc1) and without (control) the addition of nitrifying bacterial consortium. A total of six fish were sampled from two transport units per group at each of the time points: immediately after packing the fish in transport bags (AP), at the end of transport (AT), and 72 h thereafter (PT). Measurements were taken from six fish before packing (BP) to understand the prestress levels. *Indicates significant differences (p<0.05) from prestress levels within a particular group. ¤Indicates significant differences (p<0.05) from the control, at a particular time point. Values are presented as means±s.e.m.
Blood glucose
Interaction of time point and treatment was detected to be significant (p<0.0001). Glucose levels were also affected by both the factors (time point p<0.001 and treatment p<0.01). As in the case of cortisol, at AT, the blood glucose levels of the fish in Nbc1 group were significantly lower (p<0.0001), compared to that in the control fish (Fig. 2). The glucose levels in the fish from Nbc1 group remained unchanged during the transport, while significantly high levels were seen in control fish (p<0.0001) at AT, which returned to the prestress levels at PT (Fig. 2).
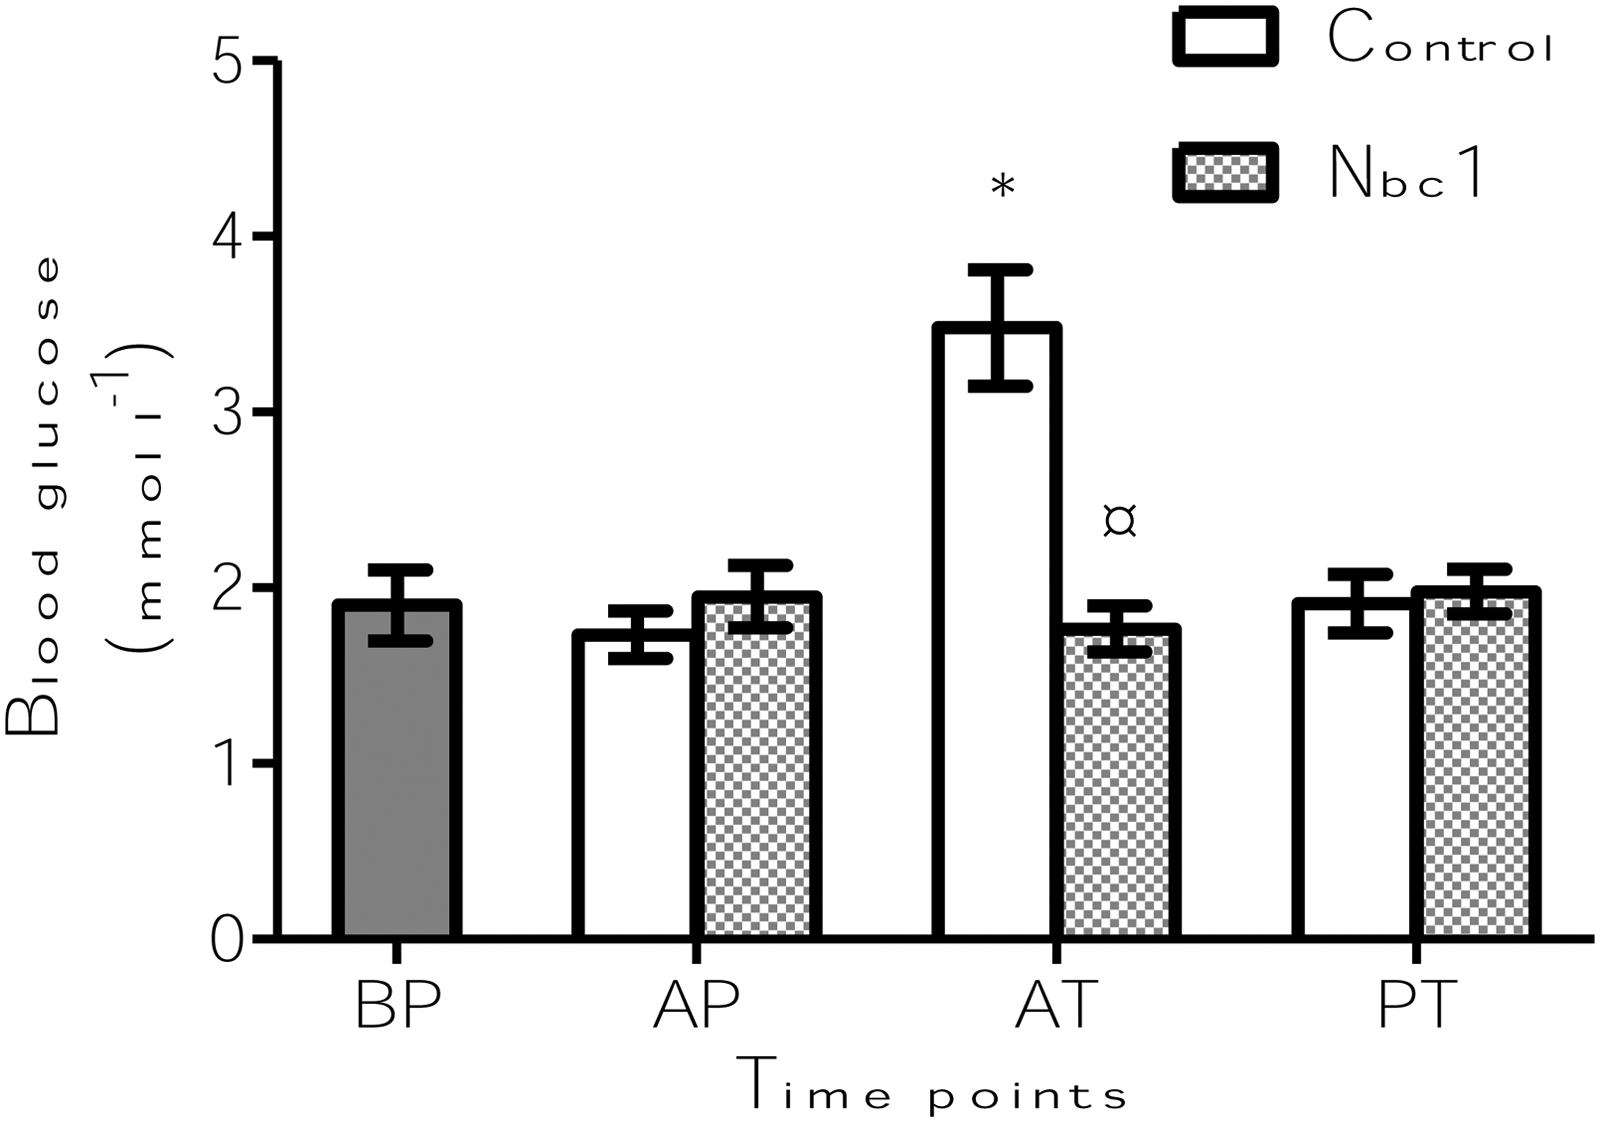
Blood glucose levels of zebrafish in transport units with (Nbc1) and without (control) the addition of nitrifying bacterial consortium. Blood samples were taken from a total of 8–10 fish from two transport units per group at each of the time points: immediately after packing the fish in transport bags (AP), at the end of transport (AT), and 72 h thereafter (PT). Measurements were taken from 10 fish before packing (BP) to understand the prestress levels. *Indicates significant differences (p<0.05) from prestress level within a particular group. ¤Indicates significant differences (p<0.05) from the control, at a particular time point. Values are presented as means±s.e.m.
Relative expression of genes involved in HPI axis and mineralocorticoid receptor
The mRNA levels of crf in the brain and mc2r, star, and cyp11c1 in the kidney of fish from both groups were not significantly altered at any of the time points (Fig. 3a–d). Further, the levels in fish from control and Nbc1 groups were not different at AP, AT, and PT.

Relative expressions of crf in the brain
As for hsd11b2 in the kidney, the gene expression was not significantly influenced by the two factors. Nevertheless, as evidenced from the post-hoc tests, the expression of hsd11b2 in control fish, increased significantly (p<0.05) at AT compared to the values at both BP and AP (Fig. 3e).
The mRNA levels of mr were significantly influenced by treatment (p<0.01). At AT the expression of mr in fish of Nbc1 group was significantly lower (p<0.01) compared to those in control fish (Fig. 4). The expression of mr in fish from Nbc1 group did not change significantly during the transport while, as revealed from the post-hoc tests, in control fish the value increased significantly at AT (p<0.05) compared to both BP and AP, which later returned to the prestress levels at PT.

Relative expressions of mr in the kidney of zebrafish in units with (Nbc1) and without (control) the addition of nitrifying bacterial consortium. A total of eight fish were sampled from two transport units per group at each of the time points: immediately after packing the fish in transport bags (AP), at the end of transport (AT), and 72 h thereafter (PT). Measurements were taken from eight fish before packing (BP) to understand the prestress levels. Transcripts were quantified by qPCR and normalized using the geometric average of suitable reference genes. *Indicates significant differences (p<0.05) from prestress levels within a particular group. ¤Indicates significant differences (p<0.05) from the control, at a particular time point. Values are presented as means±s.e.m.
Discussion
The results from this study on zebrafish that analyzed the water quality parameters, stress indicators in fish, and expression of genes related to them indicated that the pretransport procedures and subsequent transport can be stressful to fish. Further, the application of nitrifying bacterial consortium in transport water resulted in a stress response distinct from that in the control group of zebrafish. However, further in-depth studies on the use of this consortium and the effect of different water quality parameters on stress responses are necessary.
The increase in cortisol levels, in both groups, at AP, indicates that fish were stressed by pretransport procedures. Cortisol (primary stress indicator) and glucose (secondary stress indicator) levels that were significantly reduced only in the group that was transported in bags with Nbc1 indicate that the consortium helps not just to contain ammonia accumulation. The transcript levels of hsd11b2 and mr in the kidney of zebrafish from the control group alone were significantly upregulated by AT, probably to cope with the different types of stress, including that caused by high total ammonia levels. On the other hand, the transcription of most of the studied genes involved in the HPI stress axis (crf, mc2r, star and cyp11c1) did not have a relationship with cortisol and blood glucose levels. The expression of the key genes involved in the HPI stress axis and corticosteroid signaling has hitherto not been analyzed in connection with the transport of fish.
During transport, fish are confined to closed systems and subjected to several physical and chemical stressors including handling, high packing density, movements, temperature fluctuations, oxygen supersaturation, water quality changes, and starvation.1,10 The stress response in fish during transport may be the cumulative effect of these stressors.
In aquaria and ponds, ammonia accumulation mainly occur due to excretion from fish and other livestock and degradation of uneaten food or dead livestock. 11 High ammonia exposure can lead to ammonia accumulation in the body, and elevated body ammonia levels are highly toxic to fish.19,21,22 The equilibrium between toxic NH3 and less toxic NH4+ in water depends on pH, temperature, ionic strength, and pressure—pH having a marked role. 41 At AT, although the toxic form of ammonia is higher than the maximum admissible concentration for cyprinid species (0.05 mg l−1) 42 in both groups (control, 0.078 mg l−1 and Nbc1, 0.088 mg l−1), the pH in the units lies within the 6.8–7.8 range recommended for freshwater aquaria. 43 Moreover, the recommendation to reduce ammonia toxicity is to lower the pH values to 7. 43 The fraction of NH3 increases with a rise in temperature; for example, 10°C increase in temperature can approximately double the NH3 levels. 21 The temperature differences detected are the same in both groups at AT and are ≈2°C compared to that at BP or AP. Therefore, impact of temperature on the NH3 fraction would be the same for both groups at AT. Low oxygen levels in water can increase ammonia toxicity, as in such condition even lower NH3 levels can kill the fish. 42 At AT, both groups showed oxygen saturation above 200%, indicating that oxygen may not have been a detrimental factor for ammonia toxicity in the present case. Moreover, in oxygenated water, ammonia is efficiently converted to less toxic nitrate via nitrite with the action of nitrifying bacteria. 42
The oxygen saturation values noted in the present study might not have impacted the fish's cortisol levels and ammonia production, as it has been reported that supersaturation (as much as 223%) does not affect these parameters under rearing conditions. 44 However, we could not ignore the fact that hyperoxia can induce oxidative stress in fish. 23 The starvation period in the present study followed the industry practice adopted6,37 to minimize the ammonia accumulation resulting from excretion by fish. Starvation up to 4 days, as employed in this study, may not have any impact on cortisol levels, similar to the observation made in rainbow trout (Oncorhynchus mykiss) after 48 h starvation 45 or in channel catfish (Ictalurus punctatus) after 14 days of starvation. 46 This period is also much less than that employed by Drew and colleagues, 47 where zebrafish were starved for 21 days to understand the effects of starvation on various metabolic pathways. They found that the transcriptome of whole zebrafish brain was not affected by the prolonged starvation period, while the hepatic transcriptome revealed a decrease in most of the metabolic processes.
Carbon dioxide from respiration is accumulated in the transporting systems. In closed systems, water PCO2 (toxic unionized CO2) and pH are closely related,13,48 and therefore changes in water PCO2 are readily reflected by changes in water pH. 48 Moreover, carbon dioxide is rarely directly toxic to fish if the pH of the water is close to the pH of fish blood (i.e., near to 7 or 8) and not below 5. 49 Therefore, from the pH values recorded in this study (control: 6.7; Nbc1: 7.07) that are within the normal range for zebrafish, 50 we can presume that CO2 levels may not have harmed the fish. At AT, the levels of TAN in the water of both groups were much higher than the safe limits suggested by the Ornamental Aquatic Trade Association (OATA) 11 at 25°C and 6.5 pH. However, TAN content in the bags of the control group were significantly different from those of Nbc1 group. In previous trials on zebrafish, we have shown that TAN concentrations increased significantly at 24 h intervals along the 72 h transport period in control groups (without nitrifying bacterial consortia), and TAN concentration in the control and Nbc1 groups were significantly different at 48 h as well as 72 h. 10 At AT the whole body cortisol level of the Nbc1 fish was significantly lower than that of the control fish. It should be noted that at AT, Nbc1 bags were associated with significantly lower TAN (48% reduction from control values) and an increased nitrate concentration compared to the control bags, indicating the enhanced nitrifying activity facilitated by the bacterial consortium. Moreover, the reduction in total ammonia nitrogen (13.37 mg l−1) associated well with increased nitrate nitrogen (11.75 mg l−1). Nitrate is less toxic to fish due to its lower branchial permeability compared to that of ammonia or nitrite, and therefore the safe nitrate level for holding fish is as high as 400 mg l−1, which is higher than the nitrate values in the transport water of Nbc1 bags (average 58 mg l−1).51,52 Further, as nitrites are unstable and their concentrations are usually low in aerobic or oxidizing aquatic systems (<0.005 mg 1−1), they will get converted to nitrate efficiently by nitrifying bacteria.42,52,53 In addition, either short-term exposure (48 h) of sea bass (Dicentrarchus labrax) to 100 and 700 mg l−1 nitrate 54 or chronic exposure (42 days) of turbot (Psetta maxima) to ≥125 mg l−1 nitrate 55 did not affect health indicators.
It has been reported that high ammonia levels can lead to increased cortisol production in fish.15,17,56 Accumulation of total ammonia nitrogen in the Nbc1 bags was low and may not have been stressful enough to fish so as to produce a cortisol response. Stressful conditions increase protein catabolism, 18 which leads to greater ammonia excretion, and stressed fish are more sensitive to ammonia toxicity than unstressed fish. 56 Therefore, high stress in the control fish deserves attention. In comparison with the prestress fish, the significantly high cortisol levels observed in both groups of fish just at AP could be attributed to handling stress. This observation corroborates the findings in other fish transportation studies.3,4 More importantly, the cortisol level of fish in the Nbc1 group returned to prestress levels at the end of the transport (AT), a possible outcome of the application of the nitrifying bacteria. In contrast, the cortisol level of fish from the control group remained significantly higher than that in the prestress fish, even at AT, indicating an extended stress effect. This implies that higher total ammonia levels in the transport water of the control bags compared to that of the Nbc1 bags might have triggered a stress response. As we have already reported a positive correlation between ammonia in water and its accumulation in fish during transport, 20 a similar situation might have evoked a stress response among the control fish in the present study. Transportation studies on other fish, under various conditions, have reported that cortisol levels return to prestress levels at different time points after transport.4,57,58 In the current study at PT, cortisol levels in the control or Nbc1 group were not significantly different from the levels at BP.
During the short unpacking period after the transport, confounding factors including temperature change after transport, toxic spike of NH3 possibly arising from sudden dissipation of CO2 and rise in pH in the transport bags, 59 air exposure, and handling while fish are transferred to the rearing system3,60 might have influenced the stress response in fish. Abrupt changes from hypercapnic water to normocapnic water is reported to be stressful to fish. 61 The stress induced by the above-mentioned factors could have contributed to the observed cortisol levels at PT, which needs verification through extended studies incorporating additional sampling points.
At times of stress, blood glucose levels increase to meet the high energy demand, and this is regarded as a secondary stress response.18,26 The glucose levels in the blood of zebrafish from the two groups exposed to the handling stress at packing remained unaltered, which is comparable to an earlier observation about olive flounder, Paralichthys olivaceus, 3 subjected to water level reduction after selection process prior to transport. This indicates that these pretransport procedures are unlikely to elicit a change in glucose levels in olive flounder and zebrafish. At AT, only blood glucose levels of fish in the control group differed from that of the fish at BP. Moreover, at AT, the blood glucose levels of the control group were significantly higher than that of the Nbc1 group. This indicates the higher energy demand that's necessary to cope with stress. As mentioned for cortisol in one of the previous paragraphs, blood glucose levels that are elevated during transport returned to their prestress levels at different time points after transport.5,57,58 In the present study, blood glucose of fish from the control group returned to prestress levels at PT.
In order to understand the molecular mechanism underlying the stress response, we analyzed the levels of mRNA of some of the genes related to the HPI axis and corticosteroid signaling pathways in zebrafish subjected to stress caused by transport and pre- and post-transport procedures. Corticotropin releasing factor (CRF) plays an important role in stress responses as it is the main mediator that activates HPI axis. High cortisol levels in zebrafish have been linked to a rapid transient increase in the levels of crf mRNA during the first 10 min of a 60 min application of vortex stressor. 62 Chronic stress, on the other hand, was also found to cause an increase in crf expression in several fish.63,64 In the present study, the mRNA levels of crf remained unchanged at AP and at AT, though the corresponding cortisol levels were higher. Similar to our observations, crf mRNA levels remained unchanged in another cyprinid fish, common carp (Cyprinus carpio), even after being subjected to an acute stressor for 30 min, 63 and the initiation of stress response was assumed to be dependent on stored CRF protein as the release of ACTH by CRF occurred within 1 min of the application of stressor. In the same study it was pointed out that the amount of peptide utilized to withstand a typical acute stressor could be smaller compared to the stored protein, and therefore, the additional gene transcription initiated on top of the constitutive gene expression would be untraceable. In the present study too, we did not detect an increase in crf mRNA levels at AP, possibly due to the changes that may have occurred at the early stages of handling or as a result of the stored CRF protein. Previous studies have revealed that chronic exposure of rainbow trout to high ammonia levels for 96 h increased plasma cortisol levels as well as crf mRNA levels in preoptic area of the fish by 24 h, which returned to values similar to those of the control fish by 96 h. 17 In the present study, even the high ammonia levels at AT in the control group did not trigger an increase in crf mRNA in zebrafish brain in conjunction with the elevation in cortisol level.
The expression of key genes such as mc2r, star, and cyp11c1, associated with steroid biosynthesis, and hsd11b2, involved in cortisol metabolism, was investigated in the kidney of zebrafish. The mc2r mRNA levels in zebrafish did not show any significant change along with the cortisol levels. It is speculated that the preexisting MC2R protein may be adequate to activate corticosteroid biosynthesis in zebrafish during handling stress, similar to the observation in common carp after 24 h restrained stress. 65 Mammalian studies indicated that shortly after ACTH binding, downregulation of MC2R normally occur with the desensitization and sequestration process,66,67 which is followed by the upregulation of MC2R protein and mRNA levels.67–69 Therefore, it is likely that in the present study too, new protein synthesis would have taken place in the later stages to replenish MC2R, with a subsequent increase in transcript levels, which our sampling regime was unable to detect. However, it has to be emphasized that these speculations must be confirmed through further studies. In a study on rainbow trout, although the cortisol levels were elevated by 1 h after the application of the stressor, the mc2r transcripts were upregulated only by 4 h, indicating a delay in its expression. 28 On the other hand, when zebrafish were subjected to 60 min of vortex stressor, an increase in mc2r expression occurred within 10 min of application of the stressor, as well as a subsequent decrease, indicating the transient increase of the transcripts. 62
StAR protein that contains a hydrophobic tunnel 70 controls the key rate-limiting step in steroid biosynthesis. 29 Previous studies that analyzed the star mRNA levels of fish subjected to various acute and chronic stressors revealed ambiguous observations even within the same species. In rainbow trout, acute stress triggered by confinement and anaesthesia; 71 or handling, confinement, and anaesthesia; 72 or 5-min chasing 73 was reported to cause an increase in star expression. On the other hand, a 3 h confinement of common carp, 74 a 30 min exposure of white sturgeon (Acipenser transmontanus) to air, 75 and chasing of gilthead seabream 76 and rainbow trout 72 for 5 min did not elicit any response in star expression. In our study on zebrafish, star expression in the kidney was unaltered, though cortisol levels were elevated. In contrast, a vortex stressor increased star expression in zebrafish. 62 An in vitro study on interrenal cells of rainbow trout has revealed that a high dose of ACTH (1500 ng ml−1) was required to increase star mRNA levels significantly, while low doses of ACTH (5 ng ml−1) was sufficient to induce cortisol production. 77 Moreover, incubation of rainbow trout interrenal tissues with a high dose of ACTH (0.5 IU ml−1; approximately 5000 ng ml−1) increased star expression in the study of Aluru and Vijayan, 73 while such an increase was not reported upon intraperitoneal injection of rainbow trout with lesser quantity of ACTH. 72 Apparently a substantial amount of ACTH is needed to increase star mRNA levels, in contrast to cortisol levels, which are elevated by very small amounts of ACTH. In the present study, the release of ACTH could have been sufficient enough to elicit a response in cortisol levels but not in star mRNA levels. Elevated cortisol levels that occurred in rainbow trout, upon application of different stressors, were assumed to be due to transcriptional and post-transcriptional activation of proteins rather than transcriptional regulation of star mRNA.72,77 Therefore, star mRNA transcription may not be the sole mechanism behind the increase in cortisol levels in zebrafish.
The final step in the cortisol synthesis, the conversion of 11-deoxycortisol to cortisol, is catalyzed by the enzyme 11β-hydroxylase, the production of which is instructed by the gene cyp11c1. As in the case of crf and star, an increase in mRNA levels of cyp11c1 in connection with the elevated cortisol levels was not evident. However, cyp11c1 mRNA levels that increased 3.4- and 2.4-fold in the kidney of zebrafish from control and Nbc1 group, respectively, at AP compared to the prestress levels at BP (although the changes were not statistically significant) is noteworthy. Another study on zebrafish noted a rapid increase in the expression of cyp11c1 within 10 min of application of a 60-min vortex stressor and a subsequent decrease—even below the levels in the control fish—after 30 min recovery, suggesting that upregulation occurs only during the acute phase of the stress. 62 In rainbow trout, a rapid increase in cyp11c1 mRNA levels as a consequence of chasing was found to continue for 24 h, implying that the upregulation extended beyond the acute stress phase. 73 However, Hagen and colleagues 77 have noted that only a quarter of the cortisol production is linked to increase in mRNA levels of P450 11β (cyp11c1), and therefore the gene may not be the rate-limiting factor in the acute stimulation of cortisol synthesis. Thus, in the present study too, the stimulation of cortisol synthesis in zebrafish may not be linked to cyp11c1 expression.
The enzyme 11β-hydroxysteroid is crucial in the conversion of cortisol to inactive cortisone, which mainly occurs in the kidney.30,78 The expression of hsd11b2 in this organ of zebrafish from the control group increased significantly at the 72 h time point during transport (AT) compared to those in fish prior to transport (BP) and after packing (AP), while the transcript in the fish from the Nbc1 group remained unchanged during the transport. The increased expression of hsd11b2 in the control fish is indicative of the homeostatic role of the enzyme HSD11B2 to regulate circulating cortisol levels. The findings in the present study are comparable with the time-delayed relationship observed between cortisol levels and hsd11b2 mRNA levels, upon application of a vortex stressor on zebrafish 62 and a 3 h net confinement stress on common carp 74 and subsequent recovery. Although at AP the cortisol level in the fish from the Nbc1 group were higher than the prestress levels, the difference became insignificant at AT. At this time point, the cortisol level in fish from Nbc1 group was different from that in the control fish, which may explain the insignificant mRNA levels of hsd11b2 in fish from the Nbc1 group.
We have also analyzed the expression of mineralocorticoid receptor mr in the kidney, a key mineralocorticoid target tissue. In mammals, aldosterone controls water and mineral balance via mineralocorticoid receptor. 79 Teleosts lack the ability to synthesize aldosterone, 80 and previous studies have shown that cortisol influences osmoregulation via both GR81–83 and/or MR.34,84,85 Further, deoxycorticosterone (DOC) can also act as a ligand for MR, similar to mammalian aldosterone.32,81,86 However, since the level of circulating cortisol is much higher than that of DOC, cortisol would be the main occupant of MR under normal physiological conditions.31,32 Osmoregulatory disturbances occur as a secondary stress response 26 in fish during transport.4,8 Further, upregulation of mr has been observed in the kidney of fish experiencing salinity changes.34,85 Therefore, to understand the importance of mr in osmoregulation of transported fish, the expression of this gene was analyzed.
In the present study, the transcript level of mr in the kidney was significantly higher in the control fish at AT. It should be noted that handling and packing did not cause any increase in mr levels, tallying with the peak cortisol values in both groups, at AP. At AT, a significant difference between the control and Nbc1 groups was evident for the transcript levels of mr in the kidney, cortisol levels in the body, and total ammonia levels in water. High ammonia exposure can cause disturbances in ion balance, increase in plasma osmolality, and gill Na+ K+ ATPase activity, denoting ammonia-induced osmoregulatory disturbances.87–91 The control zebrafish exposed to higher ammonia levels as well as high stress may have experienced osmoregulatory disturbances, thereby upregulating the mr expression.
As a study on zebrafish larvae revealed that cortisol-mediated Na+ uptake occurs via the activation of gr, not by mr, 83 future studies should examine the role of gr in adult zebrafish during transport. Moreover, upregulation of hsd11b2 was also observed in the kidney at AT. In mammals, in order to eliminate the binding of cortisol and to facilitate the binding of another ligand—mineralocorticoids (aldosterone)—to MR, coexpression of MR with HSD11B2 was observed in typical mineralocorticoid target tissues like the kidney.92,93 Therefore, further studies are needed to ascertain the possible involvement of increased mr and hsd11b2 transcripts in regulating stress during transport.
Thus, based on the observations of the selected stress markers, it can be stated that live fish transport procedures elicit a stress response in zebrafish. The transport stress has influenced the transcript levels of mr and hsd11b2 in the kidney of zebrafish, probably to cope with different stressors including high ammonia levels and to maintain homeostasis. On the other hand, the expressions of several genes involved in the HPI stress axis (crf, mc2r, star, and cyp11c1) were not affected. The application of bacterial consortium during transport resulted in a different stress response in zebrafish. Nevertheless, only through in-depth studies can the beneficial effect of the consortium be confirmed.
Footnotes
Acknowledgments
This study is part of a project “Developing an entrepreneurial university based on local opportunities and knowledge” (NUFUPRO-2007/10102) funded by the Norwegian Center for International Cooperation in Higher Education. The authors are grateful to the project coordinator, Bjørn Willy Åmo, Associate Professor, Bodø Graduate School of Business, University of Nordland, Norway, for his constant support. The first author (AKD) would like to express her gratitude to the University of Ruhuna, Sri Lanka, for granting the study leave to undertake the PhD program at the Faculty of Biosciences and Aquaculture, University of Nordland, Norway. Christopher M.A. Caipang is thanked for his advice on the cortisol analysis. Technical support from Ingvild Berg during different stages of this study is acknowledged.
Author Disclosure Statement
No competing financial interests exist.