




Abstract
The traditional thesis of the osmorespiratory compromise is that low branchial water and ion permeability would be traded off for increased O2 permeability at times of elevated O2 demand. However, there is growing evidence of independent regulation of these permeabilities in hypoxia-tolerant fish. Using 0.5-g zebrafish previously maintained under normoxia at 25°C, we investigated responses to acute temperature challenges (15°C or 35°C), acute hypoxia (15 min at 10% or 5% air saturation), as well as longer-term exposures to 10% hypoxia, on O2 consumption (MO2), diffusive water flux, and net sodium loss rates. Exposure to 35°C increased, and 15°C decreased all three rates, with diffusive water flux showing the lowest temperature sensitivity, and Na+ loss the greatest. Acute 10% and 5% hypoxia increased diffusive water flux and net Na+ loss, and it reduced MO2. All these responses reflected the traditional osmorespiratory compromise. However, during prolonged 10% hypoxia, MO2 recovered, diffusive water flux decreased below control levels, and Na+ loss rate remained elevated, even during posthypoxia recovery. Overall, zebrafish do not fit standard patterns previously seen in either hypoxia-tolerant or -intolerant fish but are clearly able to adjust the effective permeabilities of their gills to O2, water, and ions independently during acute temperature and hypoxia exposures.
Introduction
The general concept of the osmorespiratory compromise stipulates that under situations of high tissue O2 demand such as exercise, hypoxia, or elevated temperature, low permeability of the gills to ions and water would be traded off for an increase in O2 permeability so as to improve O2 uptake (MO2) from the environment.1–10 As a result, the increased MO2 would be accompanied by increases in both ion loss and water gain in freshwater fish. All these adjustments in fluxes are due, in part, to the increase in the effective permeability of the branchial epithelial membranes11–14 to meet mitochondrial O2 demand for cellular metabolism.15–18 However, differences exist both within and among fish species as to how they regulate these fluxes under variable conditions such as hypoxia, salinity, or temperature.8–10,19–24
Temperature, for example, has been shown to increase MO2 at high temperature and decrease MO2 at low temperature in many aquatic organisms.25–29 As with MO2, diffusive water flux rate increases at high temperature and decreases at low temperature during acute challenge.9,10,19,22,30–32 Unlike temperature effects on MO2 and diffusive water flux rates, responses in net sodium flux rates have been only sparsely studied,30,33 with minimal effects observed. Two recent investigations similarly reported that the net sodium loss did not change with acute temperature challenges in rainbow trout.10,22 In most of these studies, MO2, diffusive water flux, and net sodium loss rates were studied independently, making it difficult to draw conclusions on relationships among the regulatory patterns of these fluxes.
Similar to increasing temperature, hypoxia is another worldwide problem threatening the aquatic environment.34,35 Hypoxia has also been shown to trigger the traditional osmorespiratory compromise in fish with evidence of both increased ion losses8,10,36,37 and increased diffusive water fluxes10,31 in a number of species, including trout and goldfish. However, in several very hypoxia-tolerant species, there is now evidence of a rather different osmorespiratory compromise in which the fish actually avoids increased ion losses and/or decreases diffusive water fluxes during hypoxia (oscar23,38–40; tambaqui 8 ; Pacific hagfish 20 ; Atlantic killifish21,24,41; tidepool sculpin 32 ) despite evidence of attempts to improve MO2 by hyperventilation in most of these studies. In both of these types of osmorespiratory compromise response to hypoxia, there is also some limited evidence that over time, diffusive water flux rates can be regulated independently from the O2 regime (oscar 23 ; trout 10 ; Atlantic killifish 24 ).
Taken together, it seems reasonable to suggest that a common pattern of regulation occurs during temperature stress in all species (increased MO2, increased diffusive water flux rates, little change in net ion flux rates). However, under hypoxia stress, variation appears to exist, with hypoxia-tolerant species differing from other species in controlling ion fluxes and reducing diffusive water fluxes during exposure.
The zebrafish is a model organism that has been widely used in biomedical and environmental studies,42,43 yet the nature of their osmorespiratory compromise is poorly understood. Zebrafish thrive under harsh environmental conditions such as low oxygen and severe temperatures.42,44,45 Specifically, zebrafish have a wide temperature range (10°C–38°C), with 25°C being ideal for this species. 42 Zebrafish are also known to be very hypoxia tolerant.44–47
A priori, we might expect them to respond to increased temperature with elevated MO2 and diffusive water flux rates, but little change in net Na+ flux rates, the common pattern shown by most fish. In contrast, based on their documented hypoxia tolerance, we also might expect them to avoid increased Na+ losses and to decrease diffusive water flux rates during hypoxia. However, surprisingly, the only relevant study 8 reported that ion flux rates increased during hypoxia in zebrafish. We are aware of no measurements of diffusive water flux rates in this species during either hypoxia or temperature challenges.
In view of this background, and the very limited knowledge of how zebrafish regulate O2, ion, and water flux rates under temperature and hypoxia challenges, we decided to investigate how zebrafish would trade off ion and water permeabilities for MO2 under these treatments. Our first prediction was that increases in temperature would result in corresponding increases in MO2 and diffusive water flux rates but little change in net Na+ loss, which is the common pattern in most fish. Our second prediction, based on the results, 8 was that despite their hypoxia tolerance, zebrafish would exhibit decreased MO2 but both increased net Na+ loss and increased diffusive water flux rates during hypoxia. Our final prediction, based on the recent findings,10,24 was that by varying the time course of hypoxic exposure and posthypoxia recovery in normoxia, we would see evidence that diffusive water flux can be regulated independently from the O2 regime in zebrafish.
Materials and Methods
Ethics
All the experimental procedures used in these investigations were approved by the University of British Columbia Animal Care Committee (certificates A14-0251 and A18-0271) in accordance with the Canadian Council on Animal Care guidelines.
Fish
Zebrafish (Danio rerio) weighing 0.51 ± 0.06 g (standard error of the mean [SEM]) were purchased from the Little Fish Company, Surrey, Canada. A minimum of 2 weeks of maintenance in a 20-L aquarium at 25°C was allowed before commencement of experimentation. The aquarium was supplied with constant aeration, with twice-a-week exchange of 80% of the water with aged water.
Dechlorinated Vancouver tap water, which is a very soft, ion-poor water (composition reported 22 ), was used for both holding and experimentation. Zebrafish were fed ad libitum three times a week with Nutrafin Max (Rolf C. Hagen, Inc., Montreal, Canada). If fish sampling for experiments coincided with feeding, the fish intended for experimentation were first removed, and the remaining fish were then fed as outlined earlier. Therefore, all experimental fish had been fasted for at least 24 h before experimentation.
General experimental protocol
We measured diffusive water flux rate as a measure of overall permeability to water. Unlike net water flux rate, which can be measured only indirectly in intact fish (e.g., by urine flow rate), diffusive water flux is a unidirectional flux rate that can be measured directly by using tritiated water ( 3 H2O). Diffusive water flux rates are several orders of magnitude higher than net water flux rates and quantitatively very similar in the influx and efflux directions. Thus, they can be measured as either influx or efflux rates, yielding indistinguishable values (see discussion 24 ). The efflux method, used in the current study, is easier, more accurate, and nondestructive.
All the experimental procedures were based on the methods, 10 with slight modifications. Briefly, covered, darkened containers fitted with aeration and sampling ports were used for both the 3 H2O loading and the subsequent 3 H2O washout recording. To maintain the desired experimental temperature during measurements, a water bath was used in which the containers were submerged. In each experimental run, three to five fish were loaded simultaneously with 3 H2O in a 200-mL water volume that contained 40 μCi of 3 H2O. Preliminary experiments showed that exchange rates were very high and that loading to diffusive equilibrium was complete within 2 h in these small fish. At the end of the 2-h loading period, zebrafish were gently netted individually from the loading container, and they were quickly rinsed with dechlorinated water to remove any external 3 H2O on the body surface before transfer to a 100-mL volume of water free of 3 H2O for the washout recording.
For the washout, 1-mL samples of water were taken every 1 min for 15 min, with the last water sample taken after 2 h, when the washout was complete. The 1–15 min samples were used for diffusive water flux measurements, and the 2-h sample was used to calculate the initial dose of 3 H2O in the fish. Since the efflux of 3 H2O was very rapid in zebrafish, it was important to ensure that all experimental measurements were done during the 15-min period immediately after removing the fish from the loading container. For the acute hypoxia measurements, zebrafish were transferred to water that was already set to the desired oxygen level (e.g., 10% air saturation).
In the prolonged hypoxia (30–60 min) and recovery measurements (Series 3), the hypoxia was started during the loading period and in some cases the normoxic recovery was also started during the loading period, as explained later in Series 3: Time Course of Hypoxia and Normoxic Recovery Effects on Diffusive Water Flux, Net Sodium Loss and Oxygen Consumption Rates Section. In these cases, the water PO2 in the loading bath was brought to the desired PO2 in less than 1 min by bubbling in N2 gas or air.
To determine the net sodium flux rates, additional 2-mL water samples were taken at 0 and 15 min. Both net sodium flux and diffusive water flux rates were measured simultaneously on the same fish.
For MO2 measurements, separate fish were used, but the experimental treatments were done as similarly as possible to those of the diffusive water flux measurements (except no 3 H2O was used), so as to account for any effects of handling. In this regard, three to five fish were sampled and rested for 2 h in the same 200-mL “loading” volume before gently transferring them to the 100-mL respirometers for MO2 measurements. In all treatments, MO2 was measured over the 15-min post-transfer period.
Series 1: Effects of acute thermal stress on diffusive water flux, net sodium loss, and oxygen consumption rates
In this series, zebrafish were first loaded with 3 H2O in the standard fashion under normoxic conditions (>80% air saturation) at the 25°C prior maintenance temperature, then acutely transferred to 25°C (maintenance control [N = 8]), or acutely decreased temperature (15°C, N = 8), or acutely increased temperature (35°C, N = 8) for both diffusive water and net sodium flux measurements in the standard fashion. For MO2, zebrafish were first confined in the loading container under prior maintenance conditions for 2 h, before acute transfer to 25°C (maintenance control (N = 8), or acutely decreased temperature (15°C, N = 8), or acutely increased temperature (35°C, N = 8) for MO2 measurements in the respirometers.
Series 2: Effects of different hypoxia levels on diffusive water flux, net sodium loss, and oxygen consumption rates
In this series after the 2-h loading under the standard normoxic conditions (25°C), zebrafish were then transferred to normoxic water >80% air saturation (N = 6), 10% air saturation (N = 6), or 5% air saturation (N = 6) for both diffusive water and net sodium flux rate measurements in the standard fashion. In the case of MO2 measurement, zebrafish were similarly confined for 2 h, then transferred to normoxic water >80% air saturation (N = 6), 10% air saturation (N = 6), or 5% air saturation (N = 6) for MO2 measurements in the respirometers.
Series 3: Time course of hypoxia and normoxic recovery effects on diffusive water flux, net sodium loss, and oxygen consumption rates
In this series, the durations of the hypoxic exposure and normoxic recovery periods were varied. Table 1 summarizes the protocols of these experiments. Zebrafish were exposed to 10% air saturation for short durations (15 min, N = 5), and also longer durations (30 min, N = 5 or 60 min, N = 5) with fluxes and MO2 recorded in the final 15 min. The effects of short-duration exposure of 15 min to 10% air saturation +15 min normoxic recovery (N = 5), 15 min exposure to 10% air saturation +30 min normoxic recovery (N = 5), and 15 min exposure to 10% air saturation +60 min normoxic recovery (N = 5) were also investigated.
Schematic Table Showing the Layout of the Real-Time Scales of Normoxia, Hypoxia, and Recovery Treatment Conditions
Further, prolonged exposures of 60 min to 10% air saturation +15 min normoxic recovery (N = 5), 60 min to 10% air saturation +30 min normoxic recovery (N = 5), and 60 min to 10% air saturation +60 min normoxic recovery (N = 5) were also tested. Diffusive water flux rate, net sodium loss, and MO2 were measured in all these trials, with fluxes and MO2 recorded in the final 15 min.
As diffusive water flux rate could only be measured in the 15-min period immediately after transfer from the 3 H2O loading container to the washout recording containers, the following procedures were employed (Table 1). It is important to note that diffusive equilibrium was reached within 2 h of loading, so longer loading periods have no effect on loading 3 H2O efficiency. In the short-duration exposure (15 min) to 10% air saturation, the methods were the same as in Series 2. However, in the longer duration exposures to 10% air saturation, zebrafish were loaded for either 2 h in normoxia +15 min at 10% air saturation, or 2 h in normoxia +45 min at 10% air saturation, in the same media, before transfer to the hypoxic washout containers. These represent the 30 and 60 min exposures to 10% air saturation, respectively.
For the 15 min of hypoxia plus 15 min recovery period treatment, zebrafish were loaded for 2 h of normoxia +15 min of 10% air saturation in the same media; then, they were directly transferred to the normoxic washout containers. In the 15 min hypoxia +30- or 60-min recovery period treatments, zebrafish were loaded with 3 H2O for 2 h in normoxia +15 min hypoxia +15 min or 45 min recovery in normoxia in the same media, before transfer to the normoxic washout containers.
In the longer duration 60 min exposure to 10% air saturation plus 15 min recovery treatment, zebrafish were loaded for 2 h in normoxia +60 min at 10% air saturation in the same media before transfer to the normoxic washout containers. Similarly, in the longer duration 60 min exposure in 10% air saturation plus 30 or 60 min normoxic recovery treatments, fish were loaded with 3 H2O for 2 h in normoxia +60 min in 10% air saturation +15 or 45 min of normoxic recovery in the same media before transfer to the normoxic washout containers. In all these cases, measurements of 3 H2O washout, net Na+ fluxes, and MO2 were done over 15 min.
Analytical procedures and calculations
The calculations of MO2 were done as described by Onukwufor and Wood. 22 Briefly, after conversion of PO2 to O2 concentrations (in μmol/L) by using solubility coefficients tabulated, 48 the change in O2 concentration was multiplied by respirometer volume (0.1 L) and divided by time (0.25 h) to yield MO2 in μmol O2/h. The resultant fish-specific rates were used to account for the influence of body mass on MO2. The logarithm of MO2 was regressed against the logarithm of fish weight to yield the allometric mass scaling coefficient, which was then used to adjust the MO2 value of each individual fish to that of a standard 0.5-g zebrafish. Final rates were expressed as μmol O2/[g·h].
The concentrations of 3 H2O in the water samples were analyzed by using a scintillation counter (LS6500; Beckman Coulter, Fullerton, CA, USA) as described. 10 Briefly, 2 mL of Optiphase 3 fluor (Perkin-Elmer, Wellesley, MA, USA) was added to the 1-mL water sample and vortexed before loading into the scintillation counter. Quenching was constant as demonstrated in our internal standardization tests so there was no need for quench correction.
The rate constant (k in h−1) of 3 H2O efflux was calculated as described. 10 In brief, using the final amount of 3 H2O at the end of the 2-h washout period when the body water pool of the fish had equilibrated with the external water pool, it was possible to back-calculate the amount of 3 H2O radioactivity remaining in the fish at each 1-min time point during the 15-min efflux period. Regressing the natural logarithm (ln) of these amounts against time on a linear scale yields the fractional rate constant k for water turnover.
The product of k × 100% provides the percentage of body water turned over per hour. The rate constant was then multiplied by an estimated exchangeable water pool amounting to 0.8 mL/g of body mass49–51 to yield the actual diffusive water flux rate in mL/h. To adjust for differences in body mass, the logarithm of diffusive water flux rate was regressed against the logarithm of fish weight. 10 The allometric mass scaling coefficient obtained was then used to adjust the diffusive water flux rate of each individual fish to that of a standard 0.5-g zebrafish. Final rates were expressed as mL/[g·h].
The Na+ concentrations in the water samples were analyzed by using flame atomic absorption spectrophotometry (AAnalyst 800; Perkin-Elmer, Wellesley, MA, USA) with the limit of quantification at 0.5 μmol/L. Both the certified reference materials BURTAP-05 (Environment Canada, Burlington, Canada) and blanks were analyzed together with experimental samples. No sodium was detected in the blank, and the recovery of sodium from the BURTAP-05 was 95%–103%. Since the regression of logarithm of net Na+ loss against that of fish weight was not significant, the net Na+ flux rate was directly divided by the body weight to yield values in μmol/[g·h], as previously described.10,22
The temperature coefficients (Q10 values) for MO2, diffusive water flux rates, and net Na+ flux rates for acutely temperature-challenged fish were calculated for the temperature ranges 15°C −25°C, 25°C −35°C, and 15°C–35°C as described. 22 As different fish were used in each trial, we used mean values of MO2, diffusive water flux rates, and net Na+ flux rates in calculating Q10 values for fish subjected to acute temperature challenge.
Statistical analyses
Data were first tested for normality and homogeneity of variances. In cases where data failed these tests, square root transformation was applied. Some data passed after transformation, and the remaining failing data were analyzed by using Kruskal–Wallis one-way analysis of variance on ranks. All the data were expressed as the mean ± SEM (N). One-way analysis of variance (ANOVA) was used to compare all data, with temperature and hypoxia as independent variables in different analyses. Tukey's post hoc test was used to identify significantly different means at p < 0.05. Statistical analysis, linear regression analysis, and curve fitting were done by using SigmaPlot 11 (Systat Software, San Jose, CA, USA).
Results
Scaling coefficients of MO2 and diffusive water flux rates
When the logarithm of MO2 was plotted against that of fish weight (Fig. 1A), the relationship was linear with an R2 = 0.39 (p < 0.001) and a scaling coefficient of 0.83. Similar to MO2, when the logarithm of diffusive water flux rate was plotted against that of body mass, the relationship was linear with a similar scaling coefficient of 0.84, but with a much higher R2 = 0.82 (p < 0.001) (Fig. 1B). In both cases, these coefficients were used to scale the data to those of a 0.5-g zebrafish. These values were then divided by 0.5 to yield either a rate in μmol O2/[g·h] for MO2 or mL/[g·h] for diffusive water flux.
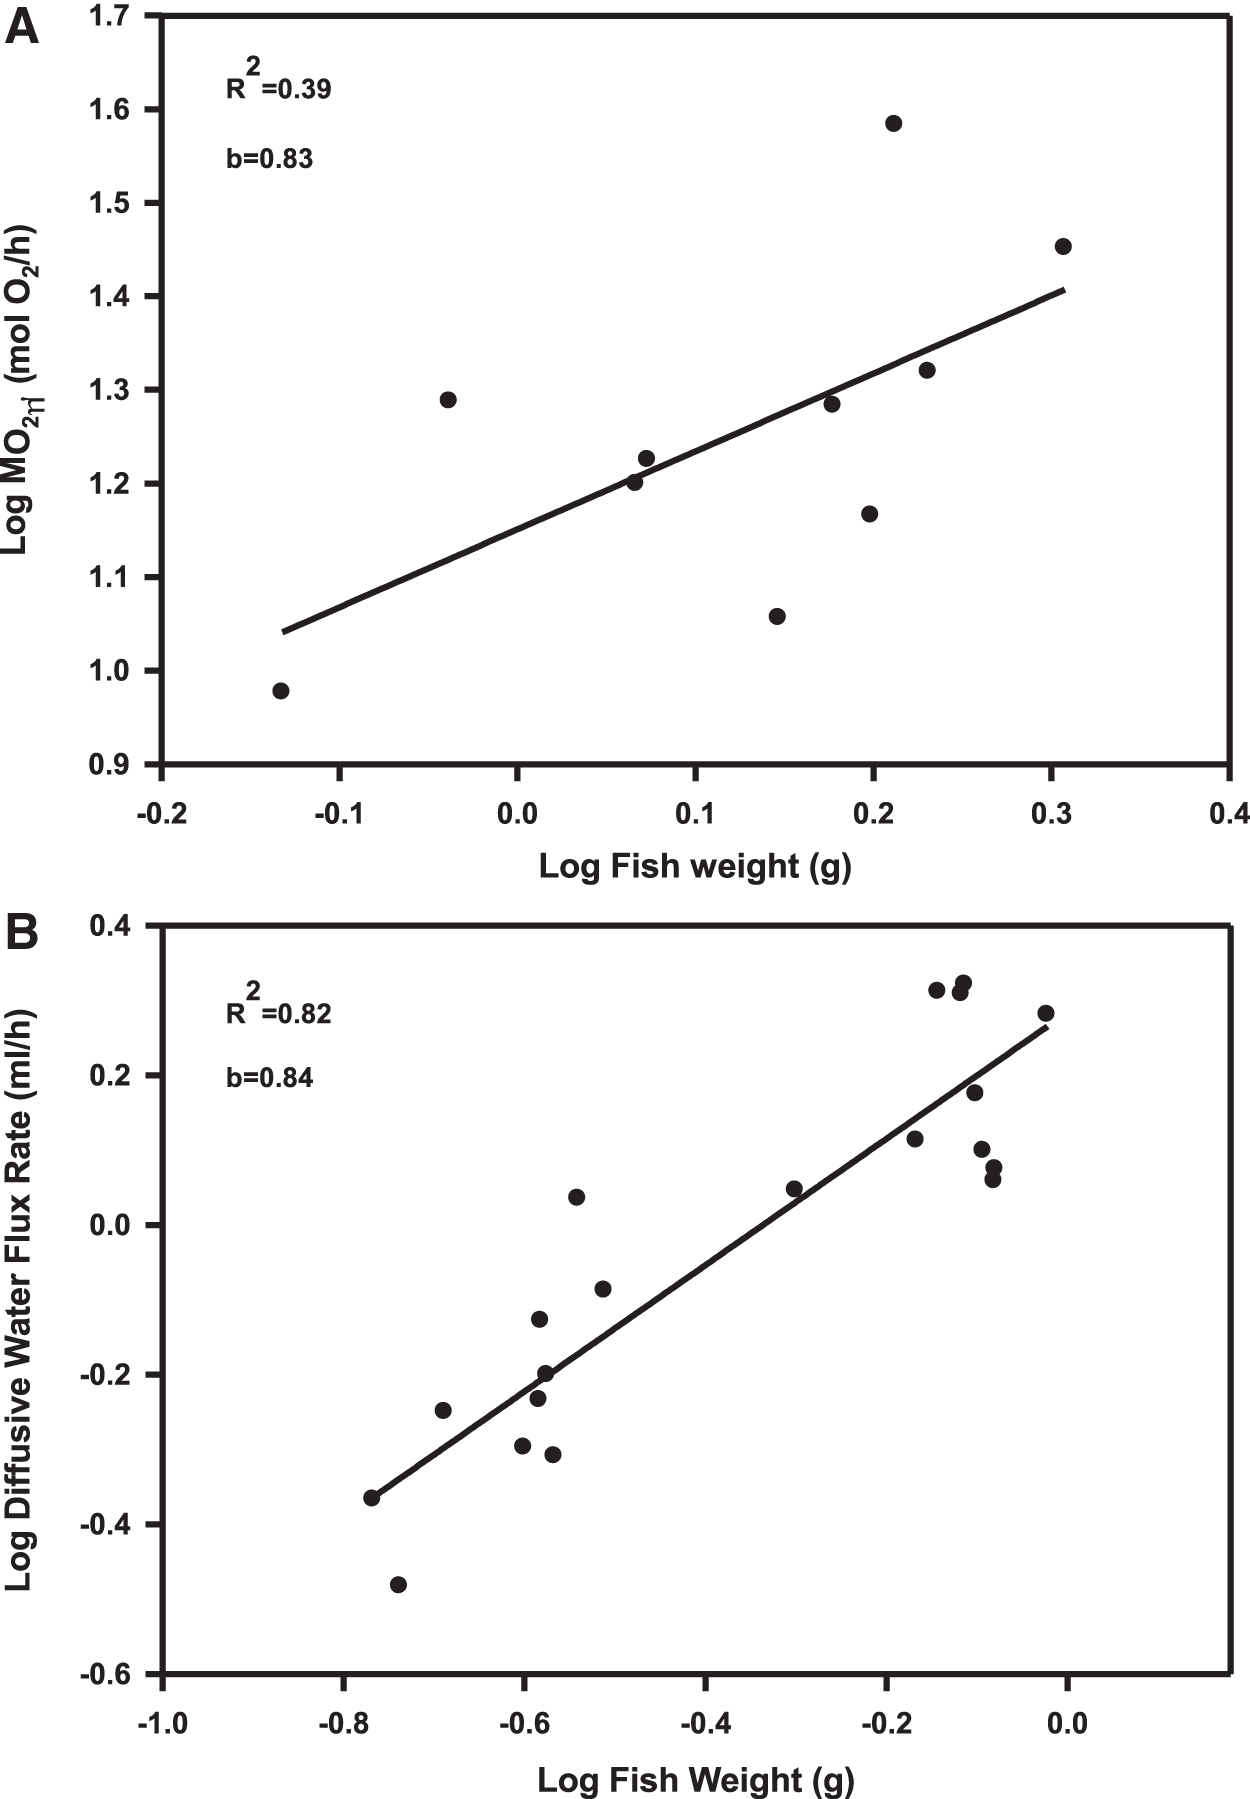
Derivation of the allometric mass scaling coefficients for MO2 and diffusive water flux rates. All measurements were made at 25°C under normoxic conditions (>80% air saturation).
In all the scaling, we used values from the 25°C measurements as these represent the prior maintenance condition and the ideal temperature of zebrafish. The relationships between net Na+ flux and body weight were not significant (data not shown). Therefore, scaling was not done for net Na+ flux and individual rates were simply divided by body mass.
Series 1: Effects of acute thermal challenge on MO2, diffusive water flux, and net sodium loss rates under normoxia
Temperature had a significant effect (p < 0.001) on MO2 (Fig. 2A), with the highest MO2 rate observed in 35°C exposed fish and the lowest in 15°C exposed fish. When the temperature was acutely lowered from 25°C to 15°C, zebrafish reduced their MO2 rate by 76%. In contrast, when the temperature was acutely increased from 25°C to 35°C, they increased their MO2 by 71%. Although the average Q10 value for MO2 was 2.70 for 15°C–35°C, there was a very high value of 4.25 at the lower range of 15°C–25°C and a much lower value of 1.71 at the upper range of 25°C–35°C.
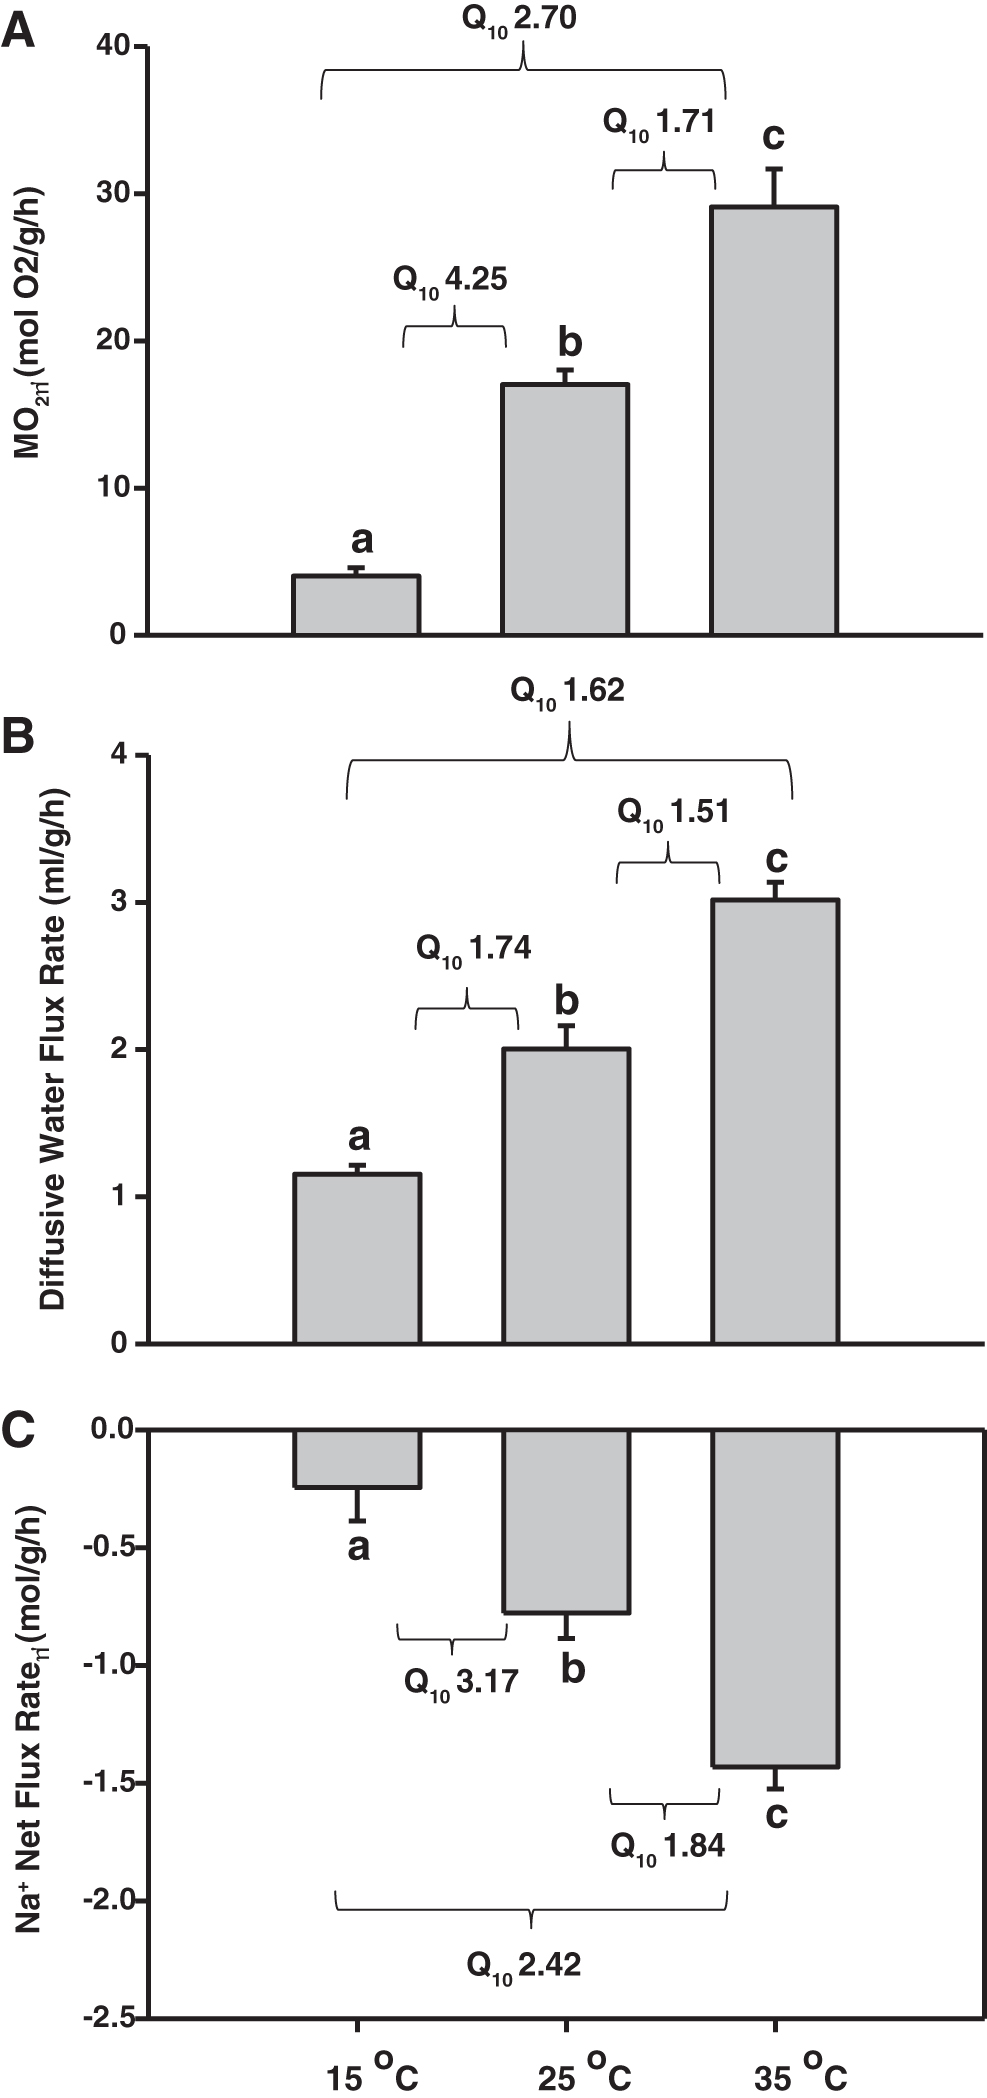
Effects of temperature under normoxic conditions (>80% air saturation) on
Diffusive water flux rates were remarkably high and were also significantly affected (p < 0.001) by acute changes in temperature (Fig. 2B). At the prior maintenance temperature of 25°C, zebrafish exchanged about 2 mL/[g·h] (250% of their total body water pool per hour). When the temperature was acutely lowered from 25°C to 15°C, they reduced the turnover rate of their body water pool by 42%, to 115% per hour. On the other hand, when the temperature was acutely increased from 25°C to 35°C, zebrafish increased the turnover rate of their total water body pool by 50%, to 300% per hour. The temperature sensitivities of diffusive water flux rate during acute challenges were much lower than those of MO2, with an overall Q10 value of 1.62, with a marginally higher value of 1.74 for 15°C–25°C and a marginally lower value of 1.51 for 25°C–35°C.
Net Na+ loss rate was significantly influenced (p < 0.001) by acute changes in temperature (Fig. 2C), with the highest loss rate observed in 35°C fish and the lowest loss rate in 15°C fish. When the temperature was acutely lowered from 25°C to 15°C, the net Na+ loss rate decreased by 69% whereas acute elevations from 25°C to 35°C increased the net Na+ loss rate by 84%. These changes yielded an overall Q10 value of 2.42 for the 15–35°C range, with a higher value of 3.17 at the low range of 15°C–25°C and a lower value of 1.84 at the upper range of 25°C–35°C.
Series 2: Effects of different hypoxia levels on MO2, diffusive water flux, and net sodium loss rates at 25°C
Different levels of acute hypoxia challenge (15 min) had significantly different effects (p < 0.001) on MO2 (Fig. 3A). When the oxygen level was acutely reduced from the normoxic control level (>80% air saturation) to 10% saturation, there was a 64% reduction in MO2, with an even greater 86% reduction at 5% air saturation. However, acute exposure to hypoxia had qualitatively opposite effects on diffusive water flux rates, which increased significantly (p < 0.001) by 27% at 10% air saturation, and only slightly more (by 30%) at 5% saturation (Fig. 3B). Acute hypoxia challenge also had significant (p < 0.001) stimulatory effects on the net Na+ loss rate, with increases of 43% at 10% air saturation and 50% at 5% air saturation (Fig. 3C).
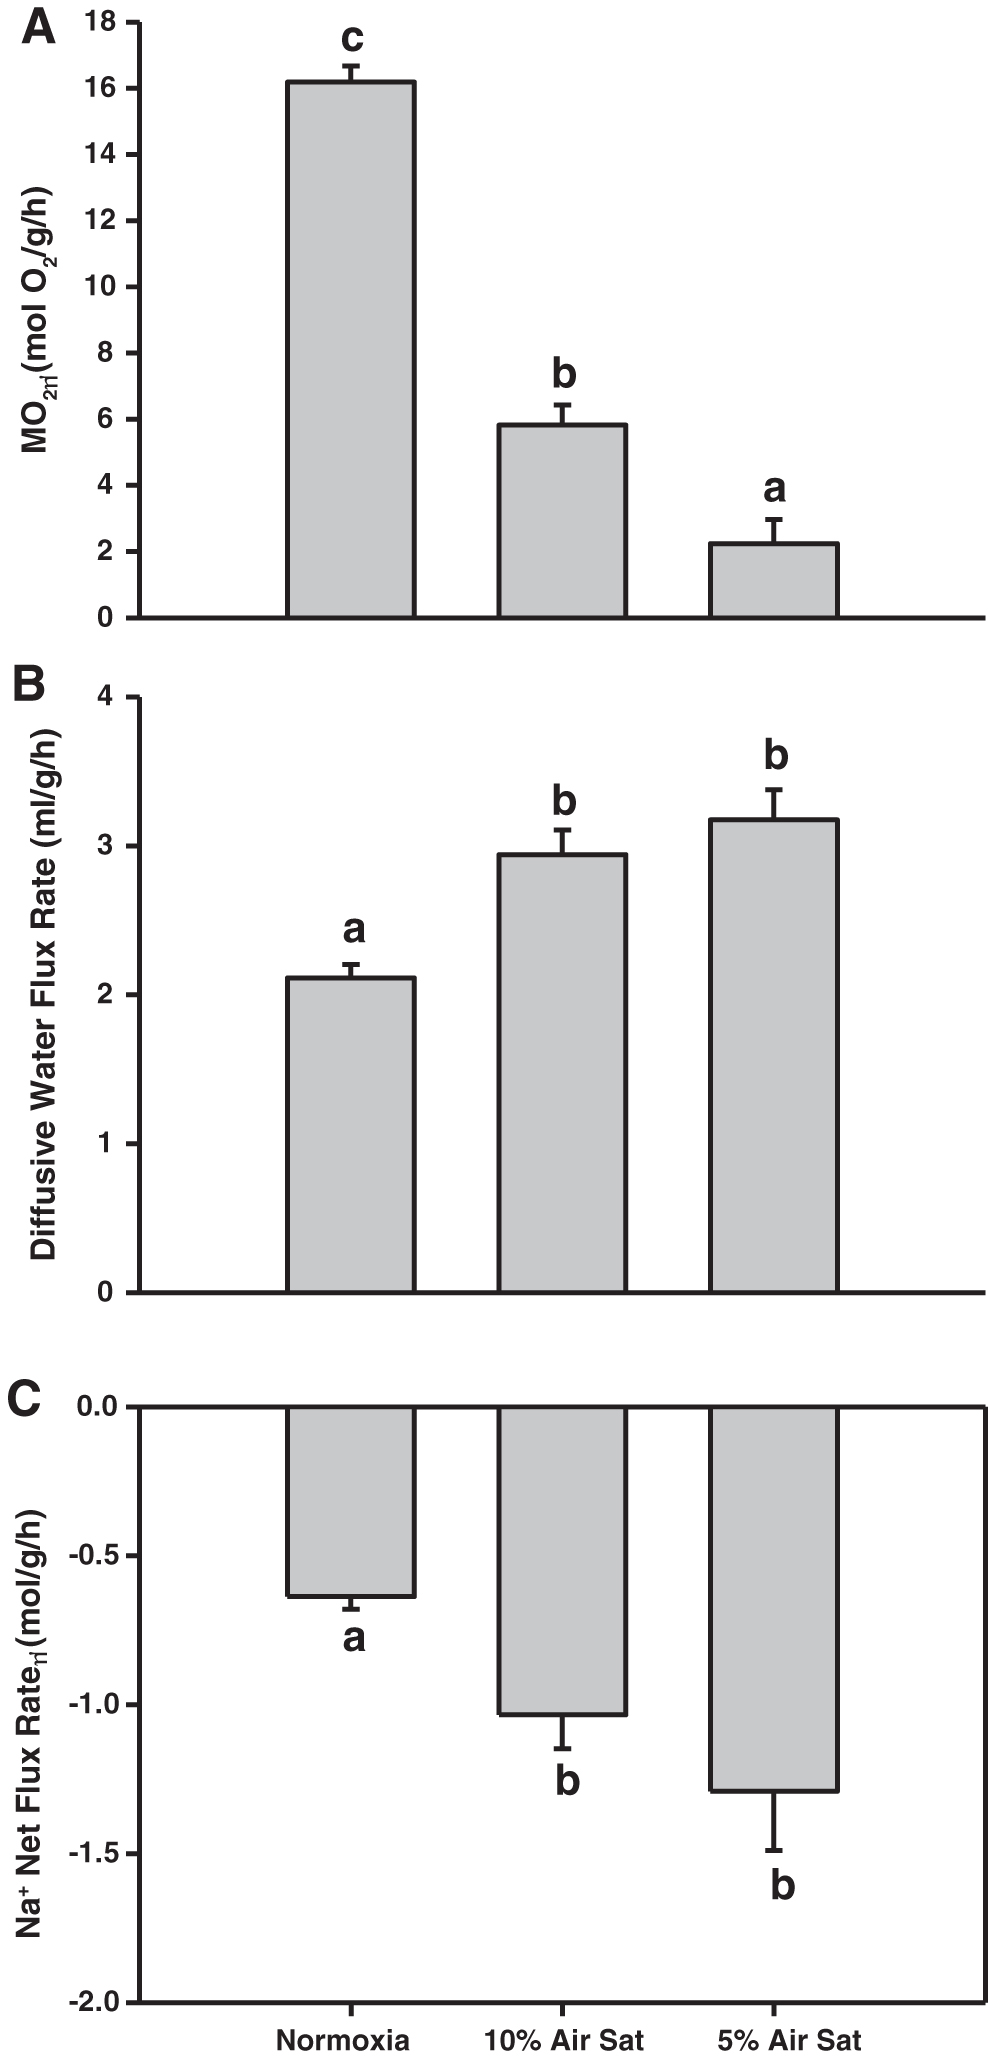
Effects of different levels of hypoxia at 25°C on
Series 3: Time course of hypoxia and normoxic recovery effects on MO2, diffusive water flux, and net sodium loss rates at 25°C
The time course effects of hypoxia and normoxic recovery on MO2 were significant (p < 0.001) (Fig. 4A). When oxygen level was reduced from >80% to 10% air saturation for 15 min, there was again a marked reduction (67%) in the MO2 (Fig. 4A). However, when the hypoxic exposure period was extended to 30 or 60 min, in both cases MO2 values were restored back to control levels. This stability of control values of MO2 continued during 15, 30, and 60 min of normoxic recovery after 60 min of exposure to 10% air saturation (Fig. 4A). For diffusive water flux, there was also a significant (p < 0.001) effect of the time course (Fig. 4B). Specifically, when oxygen levels were reduced from >80% air saturation to 10% air saturation for 15 min, diffusive water flux increased by 40% relative to the control in this experiment.
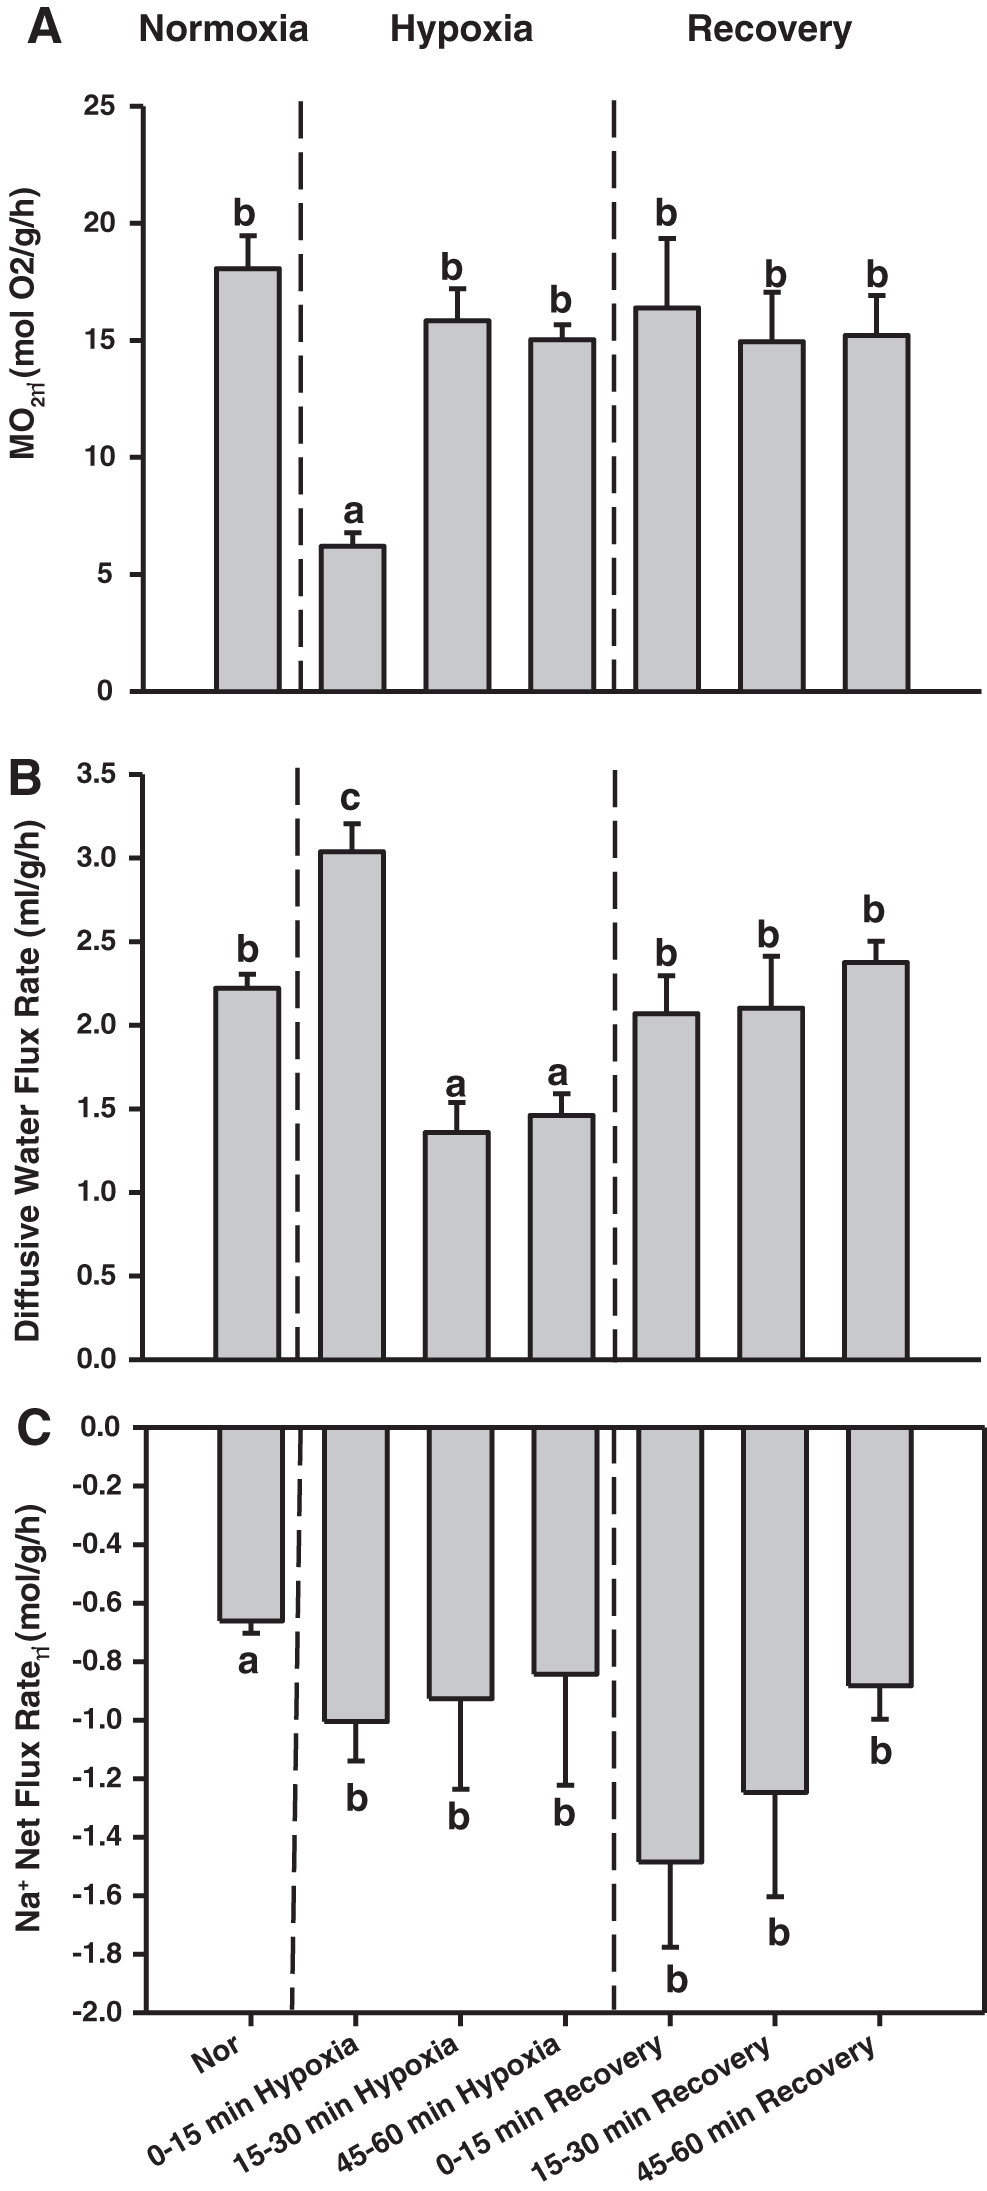
Effects of the time course of hypoxia exposure and recovery at 25°C on
In contrast, prolonged exposure (30 or 60 min) to 10% air saturation reduced the rate of diffusive water flux by 35% relative to the control rate. On return to normoxia after 60 min of hypoxia exposure, diffusive water flux returned to control rates at 15, 30, and 60 min of normoxic recovery (Fig. 4B). For net Na+ flux rate, there were also significant (p < 0.001) but rather different effects of the time course (Fig. 4C). When the oxygen level was reduced from >80% to 10% air saturation for 15 min, there was a 50% increase in the rate of net Na+ loss, which remained fairly stable during longer durations of hypoxia exposure (30 or 60 min). However, when normoxia was reinstituted after 60 min of hypoxia, there was a tendency for further increases at 15, 30, and 60 min of normoxic recovery (Fig. 4C).
We also evaluated whether the effects seen during recovery from 60 min of hypoxic exposure would be the same if normoxic recovery started after only 15 min of hypoxic exposure, a time when MO2 was still depressed and both diffusive water flux rate and Na+ net loss rate were elevated (Fig. 4A–C). The responses in all three parameters during normoxic recovery after this shorter period of hypoxia were essentially identical to those after longer hypoxia—a complete restoration of control values for MO2 and diffusive water flux rate, and a tendency for further elevation of net Na+ loss rate at 15, 30, and 60 min of normoxic recovery (Table 2).
MO2, Diffusive Water Flux Rates, and Net Na+ Flux Rates of Zebrafish During Normoxic (Control) and Recovery Periods After Exposure to 15 Min of Hypoxia
Data are mean ± SEM (n = 5). Means not sharing the same letters within a column are significantly different (p < 0.05).
SEM, standard error of the mean.
Discussion
Overview
Diffusive water flux rates were exceptionally high in zebrafish, a finding that can be largely explained by their small size and the effects of allometry. With respect to our predictions, the first was validated, at least in part, for MO2 and diffusive water flux rates, both of which increased with elevations in temperature, suggesting that these fluxes are regulated in a qualitatively similar pattern under acute temperature challenge. However, their relative temperature sensitivities were quite different from those of trout 22 and tidepool sculpins. 32 Specifically, zebrafish had higher temperature sensitivity for MO2 compared with diffusive water flux rate, whereas in trout and sculpins the opposite was the case. However, contrary to our prediction that the net Na+ flux rate would remain largely unchanged with acute temperature challenge based on previous reports in a few other species (see the Introduction section), we saw quite the opposite.
Indeed, not only did net Na+ loss rates increase with acute temperature elevation (and vice versa), but also their temperature sensitivity was particularly high. This suggests that zebrafish regulation of net Na+ flux rates does not fit the common pattern seen in other fish during acute temperature stress. Our second prediction, that under acute hypoxic exposure, the zebrafish would decrease their MO2 while increasing both diffusive water flux and net Na+ loss rates, was confirmed. This agrees with the earlier report 8 of increased unidirectional and net Na+ flux rates in zebrafish during hypoxia and is in accord with the traditional osmorespiratory compromise (see the Introduction section). Lastly, by varying the time course of hypoxic exposure and posthypoxia recovery, we confirmed our prediction that diffusive water flux can be regulated independently from the O2 regime in zebrafish.
For example, although diffusive water flux increased initially during hypoxia, it was subsequently reduced below the normoxic control level as hypoxia exposure continued, and then was restored to the control level immediately on restoration of normoxia. These changes occurred even though the initially inhibited MO2 was restored during continuing hypoxia, and then did not exhibit further change during normoxic recovery. The restorations of both diffusive water flux rate and MO2 were maintained during both short and prolonged recovery periods.
The mechanisms involved are unknown. However, what is obvious is that the zebrafish has the ability to adjust diffusive water fluxes over the time course of hypoxic stress, even though it apparently cannot do the same with net Na+ loss rates that remain elevated throughout hypoxia and normoxic recovery periods of different durations. Overall, these data suggest that zebrafish are able to regulate both MO2 and diffusive water flux independently from the net Na+ flux. In support of this notion, we found that that although both MO2 and diffusive water flux rate exhibited significant scaling coefficients with body mass, this did not occur with net Na+ flux rate. This finding is consistent with our earlier studies on trout.10,22
High diffusive water flux rates in zebrafish
We were initially surprised by our finding that these adult zebrafish, at their control maintenance temperature (25°C), were turning over about 2 mL/[g·h] (i.e., 250% of their body water pool per hour)! However, our calculations suggest that this high flux rate can largely be explained by their small size and high gill surface area-to-volume ratio, as captured by classic allometric scaling. For example, in our recent study 22 with a much larger freshwater species, the rainbow trout acclimated to 18°, a 100-g trout turned over about 0.943 mL/[g·h] (i.e., 94.33 mL/[fish·h]). Applying the allometric scaling coefficient (0.87) measured at 18°C in that study, which was very similar to the present value in zebrafish at 25°C (0.84; Fig. 1B), a 0.5-g rainbow trout would have a diffusive water flux rate of about 1.868 mL/[g·h] (i.e., 0.934 mL/[fish·h]). The minor differences can be explained by differences in temperature.
Temperature altered gill permeability to MO2, diffusive water flux, and net Na+ flux rates
Similar to other aquatic organisms, the zebrafish responded to acute temperature challenges by increasing MO2 with increases in temperature and the reverse with decreases in temperature (Fig. 2A). Others have also reported similar patterns in zebrafish, 52 killifish, 19 tidepool sculpins, 32 Atlantic cod,27,28 salmon,25,29 and trout.22,26 The response, at least in part, is probably due to temperature effects on the effective permeability of the gills to O2, as mediated by changes in water and blood flow distribution, water-to-blood diffusion distance, and effective gill surface area, the traditional elements of the osmorespiratory compromise.1,2 These will facilitate increases or decreases in O2 uptake to meet the rapid increase or decrease in metabolic demand with acute temperature challenge at the mitochondrial level in the tissue.16,18
Similar to MO2, diffusive water flux rate exhibited parallel responses to either increases or decreases in temperature, and similar mechanisms may apply (Fig. 2B). This again aligned with findings in other fish species.30,31,50 However, there was one noticeable difference from several previous investigations where both MO2 and diffusive water flux were measured (dogfish sharks 9 ; rainbow trout 22 ; tidepool sculpins 32 ).
In the current study on zebrafish, diffusive water flux was less sensitive to temperature (i.e., lower Q10) than MO2 (higher Q10), in contrast to these studies. This could be a trait in zebrafish to minimize the temperature sensitivity of water flux rate at higher temperature and therefore control osmoregulatory costs, especially in view of their small body size and high flux rates, while at the same time increasing the temperature sensitivity of O2 uptake that is in high demand due to higher metabolic need.
Previous workers interpreted the greater sensitivity of diffusive water flux rates in other species to the participation of aquaporin proteins (facilitated diffusion channels) in the unidirectional water fluxes, so this may suggest that under this condition, aquaporins make a less important contribution in the zebrafish, despite considerable evidence for their functional presence.53,54 The lower Q10 values for both MO2 and diffusive water flux rates in the upper temperature range (Fig. 2A, B) constitute a common finding for many processes in animals, and this is often attributed to a general decline in relative performance when the optimal temperature is exceeded. 55
Surprisingly, net Na+ loss rate increased with temperature (Fig. 2C), with an even greater temperature sensitivity than MO2 (Fig. 2A) or diffusive water flux rate (Fig. 2B), as indicated by higher Q10 values. This is completely different from reports in other species10,22,30,33 that show minimal or lack of sensitivity of net Na+ flux rate to acute temperature challenge. Interestingly though, the pattern is very similar to that seen for trout that had been long-term acclimated to different temperatures, with net Na+ flux rate measured at the acclimation temperature. 22
Mechanistic interpretation is difficult because net Na+ flux rate, unlike MO2 or diffusive water flux rate, represents the difference between unidirectional Na+ influx rate (active uptake) and unidirectional Na+ efflux rate (passive loss), each of which may be independently regulated.3,8,23,38 However, 56 again in acclimated rainbow trout, it was reported that Na+ efflux rate increased greatly with acclimation temperature, whereas Na+ influx rate was approximately constant, a pattern that could explain our present results (Fig. 2C). There was also evidence of a strong correlation (R 2 = 0.70, p < 0.0001) between simultaneous measurements of diffusive water flux and net Na+ loss rates in individual fish across temperatures (Fig. 5).
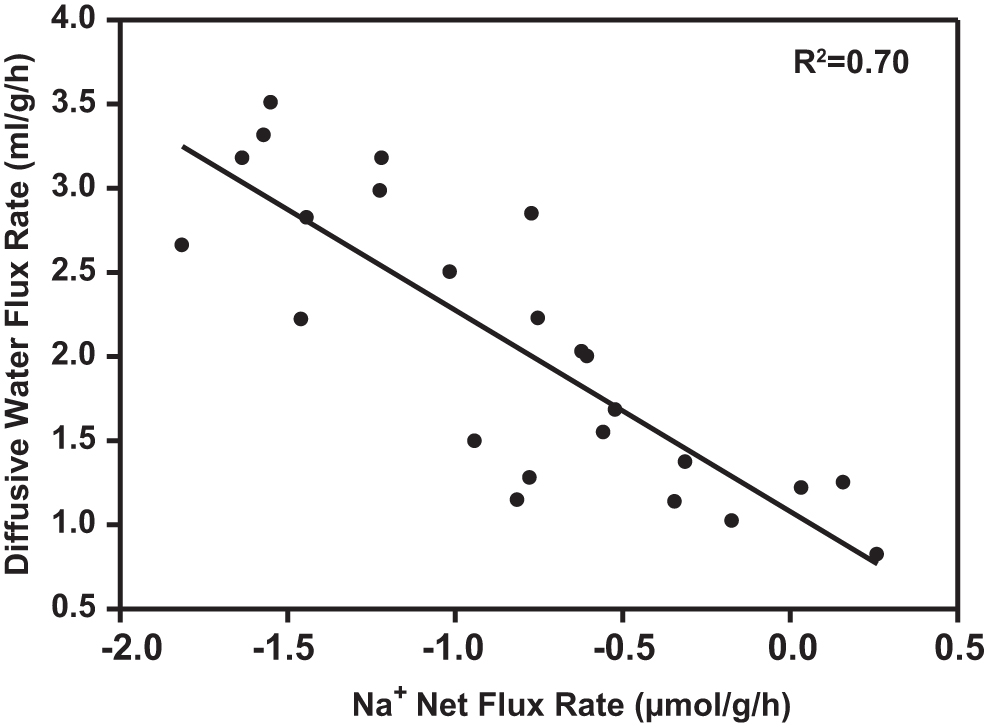
Correlation of diffusive water flux rate (mL/[g·h]) versus Na+ net flux rate (μmol/[g·h]) in individual zebrafish exposed to different temperature regimes. Data from Figure 2 (N = 24). Values are means ± SEM. Statistically significant correlation at p < 0.0001 with R2 = 0.70.
The same analysis could not include MO2 values in individual fish, as these were measured in separate experiments. Nevertheless, greater MO2 as temperature increased was clearly associated with greater Na+ loss rates and greater water flux rates (Fig. 2). These high loss rates of Na+ and water turnover may represent a significant energetic cost that zebrafish are willing to trade for an increase in MO2, in accord with the classical osmorespiratory compromise as originally formulated. 1
Complex regulation of MO2, diffusive water flux, and net Na+ loss during hypoxic stress
Teleost fish have evolved different ways that enable them to handle both short-term and prolonged hypoxic stress in their environment. As in most fish, MO2 dropped precipitously during short-term exposure to severe hypoxia (Fig. 3A), but the zebrafish was unusual in exhibiting a complete recovery of MO2 after 15 min even though hypoxia persisted (Fig. 4A). Further, there was no evidence of an O2 debt as MO2 remained unchanged during normoxic recovery (Fig. 4A; Table 2). In contrast, the Atlantic killifish exhibited only a partial restoration of MO2 after 2–3 h, 24 whereas the tidepool sculpin exhibited no recovery of MO2 after the same duration of hypoxia exposure, 32 even though both are very hypoxia-tolerant species. In both, there was no evidence of repayment of an O2 debt during normoxic recovery, so metabolic depression probably occurred.
In the zebrafish, the diffusive water flux rate increased during the initial period of exposure to hypoxia (Fig. 3B), just as seen in the goldfish 31 and trout, 10 but very different from the killifish21,24 and sculpin 32 where it decreased. Further, Na+ loss rate was elevated (Fig. 3C), again similar to the trout,8,10,36,37 and confirming a previous report on zebrafish. 8 During the initial period of exposure to hypoxia, there was again a significant correlation between simultaneous measurements of diffusive water flux and net Na+ loss rates in individual fish, in this case across O2 levels (R 2 = 0.27, p = 0.026; Fig. 6), though the correlation was not as strong as that seen across temperature (R 2 = 0.70, p < 0.0001; Fig. 5). Potentially, this weaker correlation was due to the start of regulation of diffusive water flux during hypoxia. To test this, we exposed zebrafish to more prolonged periods of hypoxia and recovery.

Correlation of diffusive water flux rate (mL/[g·h]) versus Na+ net flux rate (μmol/[g·h]) in individual zebrafish subjected to short-term exposure (15 min) to different levels of hypoxia. Data from Figure 3 (N = 18). Values are means ± SEM. Statistically significant correlation at p = 0.026 with R2 = 0.27.
Our results show a complex response pattern of the three flux rates over time in zebrafish, which do not fit standard patterns previously seen in either hypoxia-tolerant or -intolerant fish. As the period of hypoxia exposure was extended, the initially elevated diffusive water flux rate dropped significantly below control normoxic levels, indicative of regulation and uncoupling from MO2, and then returned to control levels during various periods of recovery (Fig. 4B; Table 2). However, Na+ loss rates remained high, and they increased even further during various durations of normoxic recovery, suggesting lack of regulation of this parameter. Others have also reported cases in which fish are able to reduce diffusive water flux rates below control levels during hypoxia.21,23,24,32
In all cases, the species (oscars, killifish, sculpins) were very hypoxia-tolerant, such as the zebrafish, but even the hypoxia-intolerant trout was able to reduce initially elevated diffusive water flux back to control levels during prolonged hypoxia. 10 Recently, 57 studying the killifish in freshwater presented the first evidence that downregulation of aquaporins at the protein level in the gill may play a role in reducing diffusive water flux rates during hypoxia. Clearly, this is a topic that should be pursued in future studies on the zebrafish and other species.
The lack of regulation of Na+ flux rates over time in the zebrafish, and apparent uncoupling from MO2 (Fig. 4A, C; Table 2) differs from the patterns seen in hypoxia-tolerant oscars8,23,38 and killifish 21 where Na+ flux rates were reduced during hypoxia. Indeed, the zebrafish pattern is reminiscent of the lack of regulation seen in the hypoxia-intolerant trout, where high Na+ loss rates similarly persisted during normoxic recovery. 10 This emphasizes the point made earlier that entirely different pathways must be involved but raises questions as to why this apparently nonadaptive response should occur, especially during recovery, when MO2 has returned to normal. Overall, we demonstrate that zebrafish are able to adjust the effective permeabilities of their gills to O2, water, and ions independently during acute temperature and hypoxia exposures.
Footnotes
Authors' Contributions
The study was conceived by C.M.W. and J.O.O. J.O.O. performed all experiments and analyses; C.M.W. obtained funding; and J.O.O. wrote the first draft of the MS, and C.M.W. edited it.
Disclosure Statement
No competing financial interests exist.
Funding Information
This study was supported by an NSERC Discovery grant (grant RGPIN-2017-03843) to C.M.W.