




Abstract
The order Elopiformes includes fish species of medium to large size with a circumglobal distribution, in both the open sea, coastal, and estuarine waters. The Elopiformes are considered an excellent model for evolutionary studies due to their ample adaptive capacity, which allow them to exploit a range of different ecological niches. In this study, we analyzed the karyotype structure and distribution of two classes of repetitive DNA (microsatellites and transposable elements) in two Elopiformes species (Elops smithi and Megalops atlanticus). The results showed that the microsatellite sequences had a very similar distribution in these species, primarily associated to heterochromatin (centromeres and telomeres), suggesting these sequences contribute to the chromosome structure. In contrast, specific signals detected throughout the euchromatic regions indicate that some of these sequences may play a role in the regulation of gene expression. By contrast, the transposable elements presented a distinct distribution in the two species, pointing to a possible interspecific difference in the function of these sequences in the genomes of the two species. Therefore, the comparative genome mapping provides new insights into the structure and organization of these repetitive sequences in the Elopiformes genome.
Introduction
The superorder Elopomorpha is one of the three largest extant lineages of teleost fish, which diversified 150–200 million years ago.1,2 Recent molecular and genomic studies have identified the Elopiformes as one of the first orders to diverge within the Elopomorpha. 2 The Elopiformes also present a high level of ecological diversity, being adapted to intense variations in salinity and oxygen concentrations, which enables species to inhabit environments ranging from coral reefs in the open sea to coastal waters and estuaries. 3
In comparison with the other orders of the Elopomorpha, the Elopiformes is made up of a relatively small number of extant species, arranged in two families, the Megalopidae and the Elopidae, found in both coastal and estuarine zones. 3 There are only two valid megalopid species, Megalops atlanticus (Valenciennes, 1847) and Megalops cyprinoides (Broussonet, 1782). M. atlanticus, in particular, is exploited indiscriminately by commercial fisheries, which caused the decline of its natural stocks, and the current classification of the species as vulnerable by International Union for Conservation of Nature. 3
In contrast, there are few data available on the biology of the seven species of Elopidae: Elops affinis (Regan, 1909), Elops hawaiiensis (Regan, 1909), Elops lacerta (Valenciennes, 1847), Elops machnata (Forsskal, 1775), Elops senegalensis (Regan, 1909), Elops saurus (Linnaeus, 1766), and Elops smithi (McBride et al., 2010). 4
Currently, although there are data describing karyotypic aspects and the organization of repetitive DNA sequences (18S, 5S, and telomeric sequences) in Elopiformes, there is still a limitation regarding the use of this type of DNA sequences. 5 Hence, given the evolutionary, ecological, and economic importance of the Elopiformes, and the paucity of molecular data on this group, there is considerable interest in the molecular analysis of these species, including cytogenetic research. 3
Repetitive DNAs are present in large quantities in the eukaryote genome. 6 These repetitions may be arranged directly adjacent to each other or tandem repeats or dispersed in the genome, as in the case of the transposons and retrotransposons. 7 Analyses of molecular organization and distribution of repetitive DNAs, such as satellite DNAs, multigene families, and microsatellite repetitions have provided important data and valuable insights into the process of karyotype differentiation in fish. 8 Recent studies have shown that this information can contribute to the detection of possible genomic alterations related to environmental impacts and the identification of the sex chromosome system in fishes, as well as provides basic data for the understanding of the genomic evolution in these organisms.9–11
Considering the effectiveness of repetitive DNAs in detecting genomic variation, the aim of this study was to analyze the karyotype structure and the distribution of repetitive DNA—microsatellite sequences and transposable element—in E. smithi and M. atlanticus, to contribute to a better knowledge concerning the dynamics of these two different classes of repetitive sequences in the karyotypic evolution of Elopiformes.
Materials and Methods
Collection of samples and chromosomal preparations
A total of 10 specimens—5 M. atlanticus (3 females and 2 males) and 5 E. smithi (1 female and 4 males) were collected in Ajuruteua, northern Brazil (License ICMBIO/SISBIO, 60197/2017) by local fisherman through hand net or trawl net. The specimens were identified based on morphological and molecular criteria.4,12 Kidney biopsies were used to obtain mitotic chromosomes using the cell culture procedure described by Sasaki et al. 13 and Rábová. 14 Animal handling procedures were conducted in accordance with the Brazilian National Council for the Control of Animal Experimentation (CEUA no. 9847301017/2018).
Probe labeling and fluorescent in situ hybridization
The probe of transposable elements sequence was generated through polymerase chain reaction using the primers described by Volff et al., 15 with the DNA template of M. atlanticus. All the probes used in this study were marked directly with Cy3, in the 5′ terminal region, during synthesis (Sigma, St. Louis, MO).
Microsatellite mapping was performed using sequence probes (A)30, (C)30, (CA)15, (GA)15, (TA)15, (GC)15, (CAA)10, (CAG)10, (CAT)10, (CGG)10, (GAA)10, (GAC)10, (GAG)10, (CAC)10, (TAA)10, and (TAC)10, and the Rex1 and Rex3, directly labeled with CY3, following the procedures adopted by Kubat et al., 16 with the modifications described in Cioffi et al. 17
Microscopic analysis and image processing
Approximately 30 metaphases were used to confirm the diploid number, chromosome structure, and the results of fluorescent in situ hybridization (FISH) experiments. Metaphases with the best dispersal and visualization of the chromosomes were selected for the photographic record, with the images being obtained using a Zeiss Axion Imager 7.2 epifluorescence microscope, and analyzed using Axionvision 4.8 software (Zeiss, Jena, Germany). Karyotypes were organized using the Adobe Photoshop 7.0 software. Chromosome morphology was classified based on Levan et al. 18 Fundamental numbers (FN) were calculated by total the number of arms of chromosomes, considering metacentric, submetacentric, subtelocentric chromosomes as biarmed and acrocentric as uniarmed. 19
Results
The karyotypic dates observed for M. atlanticus and E. smithi were similar to those described by Sousa et al., 5 being the diploid number (2n) recorded for M. atlanticus was 2n = 50 and the FN was FN = 50, given that all the chromosomes were acrocentric. In E. smithi, it was observed 2n = 50 and FN = 60, given that 6 of the chromosomes are metacentric, 4 are subtelocentric, and 40 are acrocentric chromosomes (Fig. 1).

Karyotypes of
Fifteen and 14 of the 16 microsatellite sequences used as probes generated distinct signals in the chromosomes of M. atlanticus and E. smithi, respectively (Table 1). Probes corresponding to Rex1 and Rex3 transposable elements produced signals in the genomes of both species.
Distribution Profile of the Microsatellites and Transposable Elements Probes in the Genomes of Elops smithi and Megalops atlanticus
The results of FISH experiments with microsatellite probes revealed that M. atlanticus and E. smithi had a highly similar distribution of these sequences. Sequences (C)30, (CA)15, (TA)15, (GA)15, (GC)15, (CAA)10, (CAC)10, (CAG)10, (TAC)10, and (CAT)10 hybridized preferentially in the telomeric and centromeric regions of M. atlanticus, although some of the signals produced by (C)30, (TA)15, (GA)15, (GC)15, (CAC)10, (CAG)10, and (TAC)10 were more concentrated in the euchromatic regions of the chromosomes of this species.
The remaining sequences—(A)30 (GAC)10, (GAG)10, (GAA)10, and (TAA)10—produced signals dispersed along the arms of most chromosome pairs (Fig. 2). It is important to note that sequences (C)30, (TA)15, (CAC)10, (CAT)10, and (CAG)10 were also accumulated in the secondary constrictions of pair 20. Finally, Rex1 and Rex3 probes hybridized primarily in a dispersed pattern in the chromosomes of M. atlanticus, with the most intense signals being found in the largest chromosome pairs, with some signals also being associated with the telomeric regions (Fig. 2).
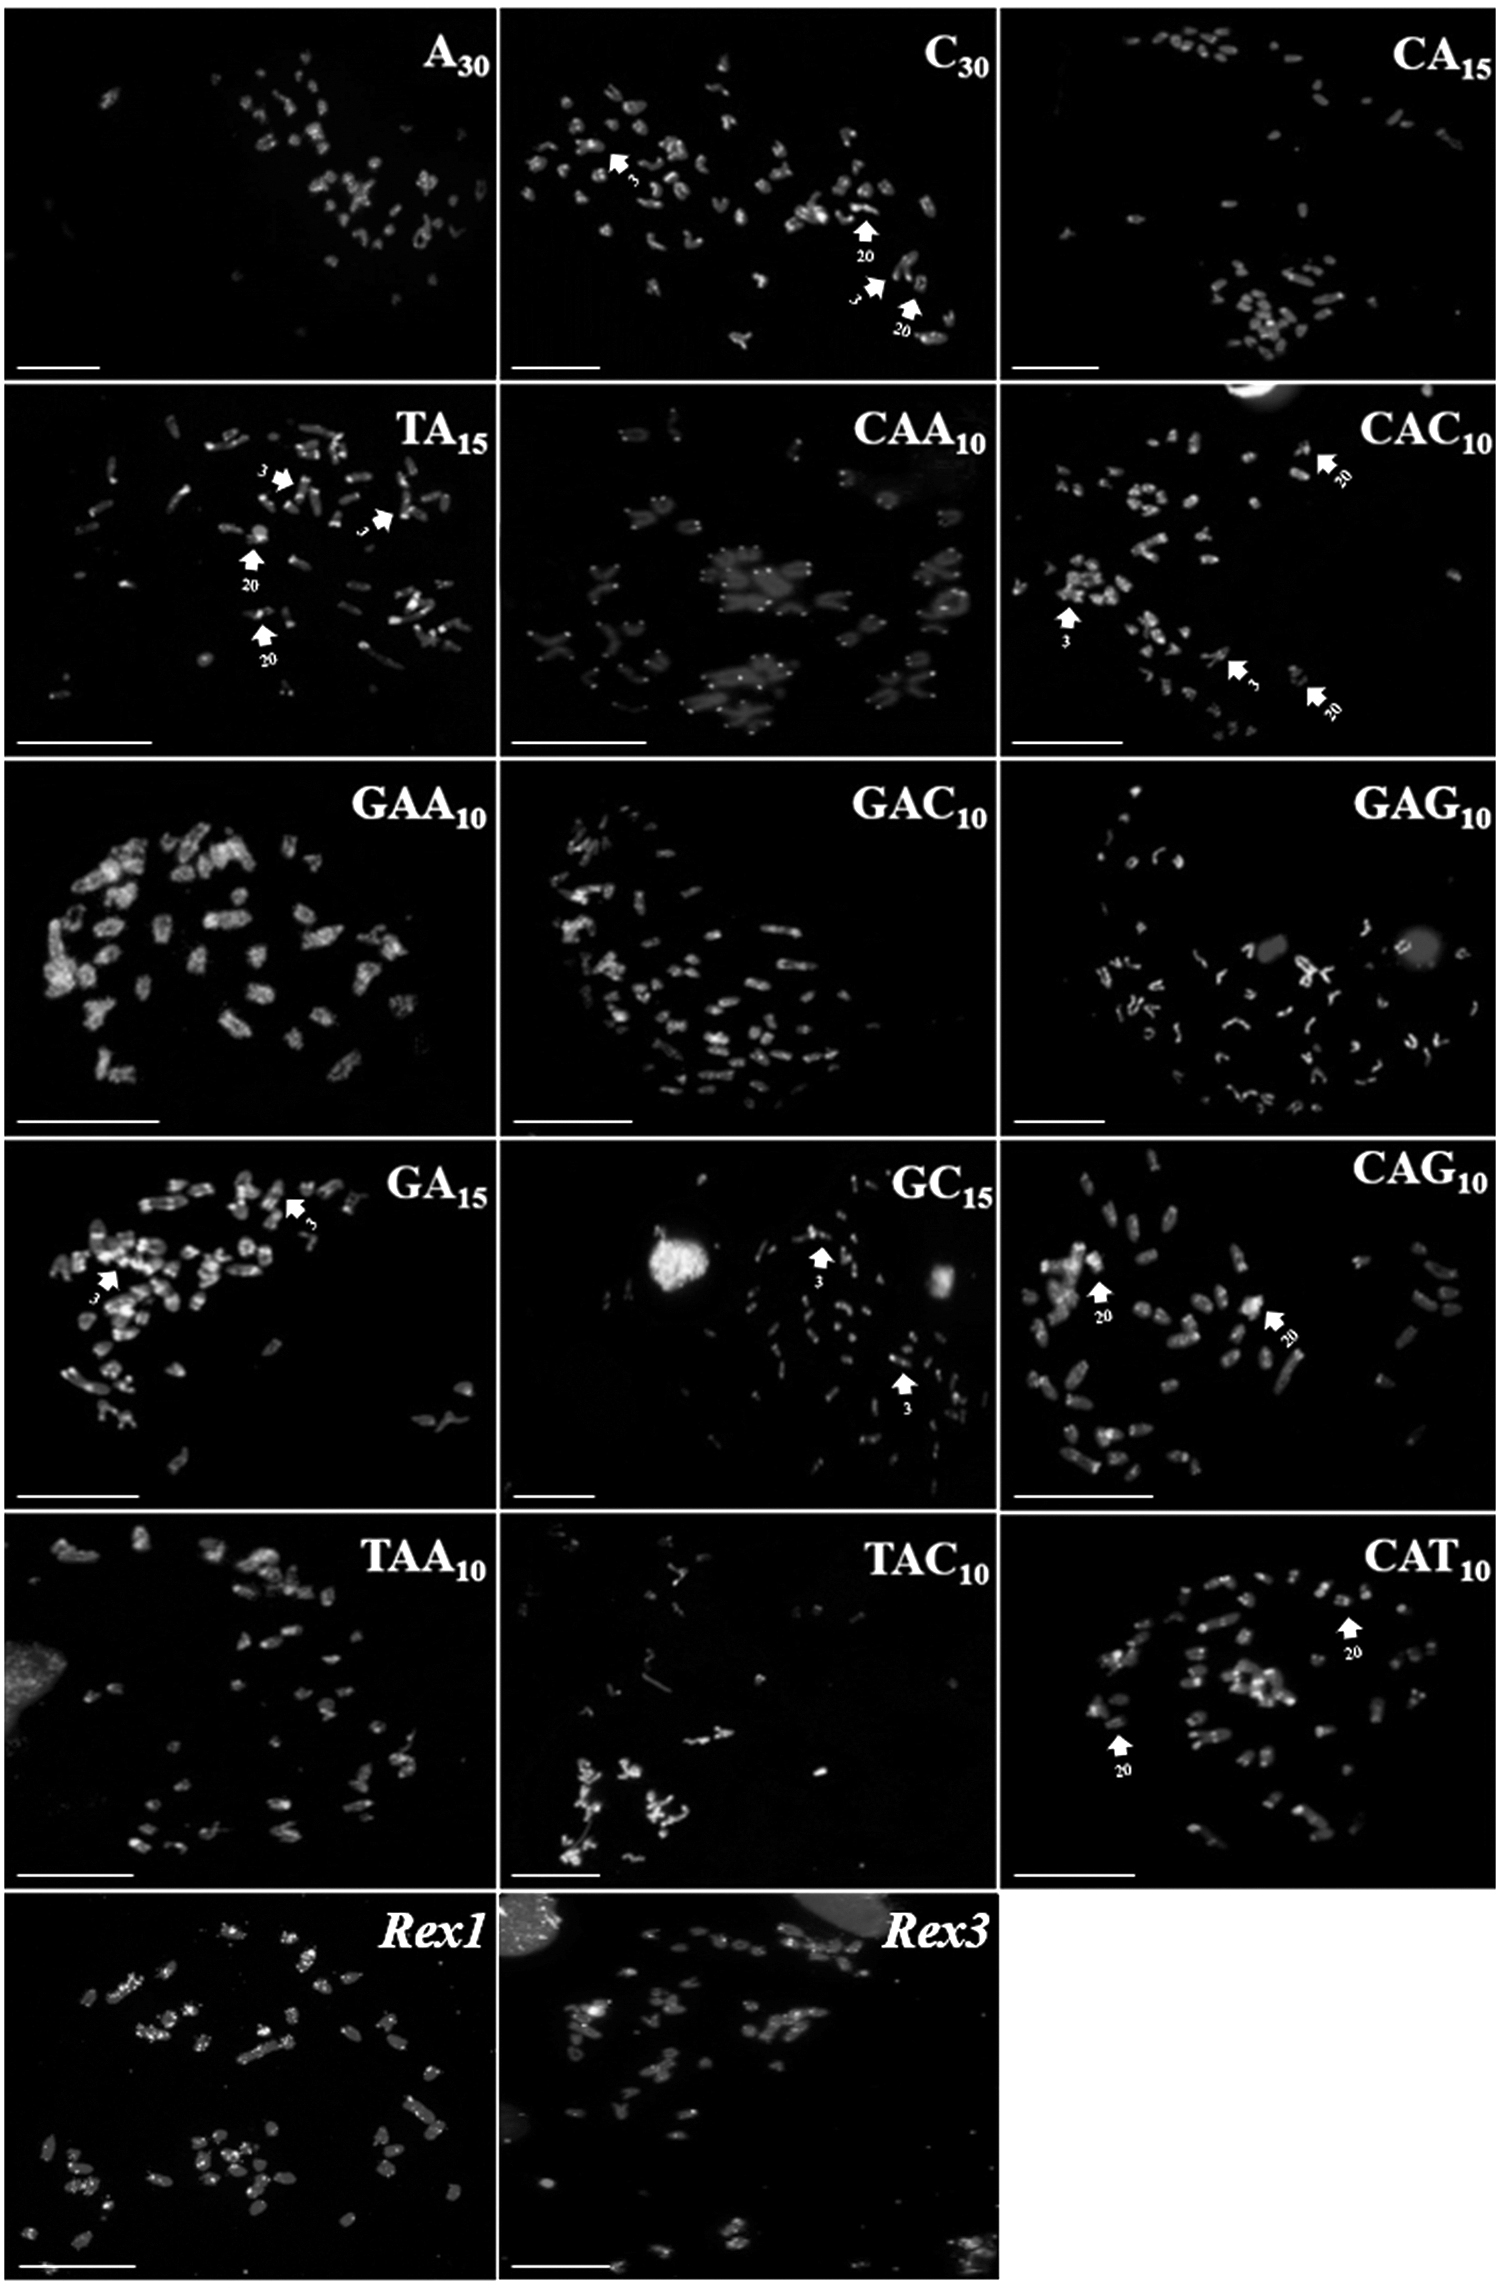
Distribution of the microsatellites and transposable elements in the genome of Megalops atlanticus. Scale bar = 10 μm.
In E. smithi, sequences (C)30, (CA)15, (GA)15, (GC)15, (CAT)10, and (CAA)10 were observed in the telomeres and centromeres of the chromosomes, with signals of (C)30, (CA)15, (GA)15, and (CAT)10 probes also found in the euchromatic regions (Fig. 3). Sequences (A)30, (TA)15, (GAC)10, (GAG)10, and (CGG)10 were also distributed throughout the long arm of all the chromosomes, whereas the signals produced by (CAG)10, (CAC)10, and (GAA)10 probes were located in specific chromosomes, in regions of heterochromatin and euchromatin, with an accumulation of signals in pair 4 and in the secondary constrictions of pair 20. Rex1 and Rex3 probes were observed in the centromeric and telomeric regions of the chromosomes of E. smithi (Fig. 3).
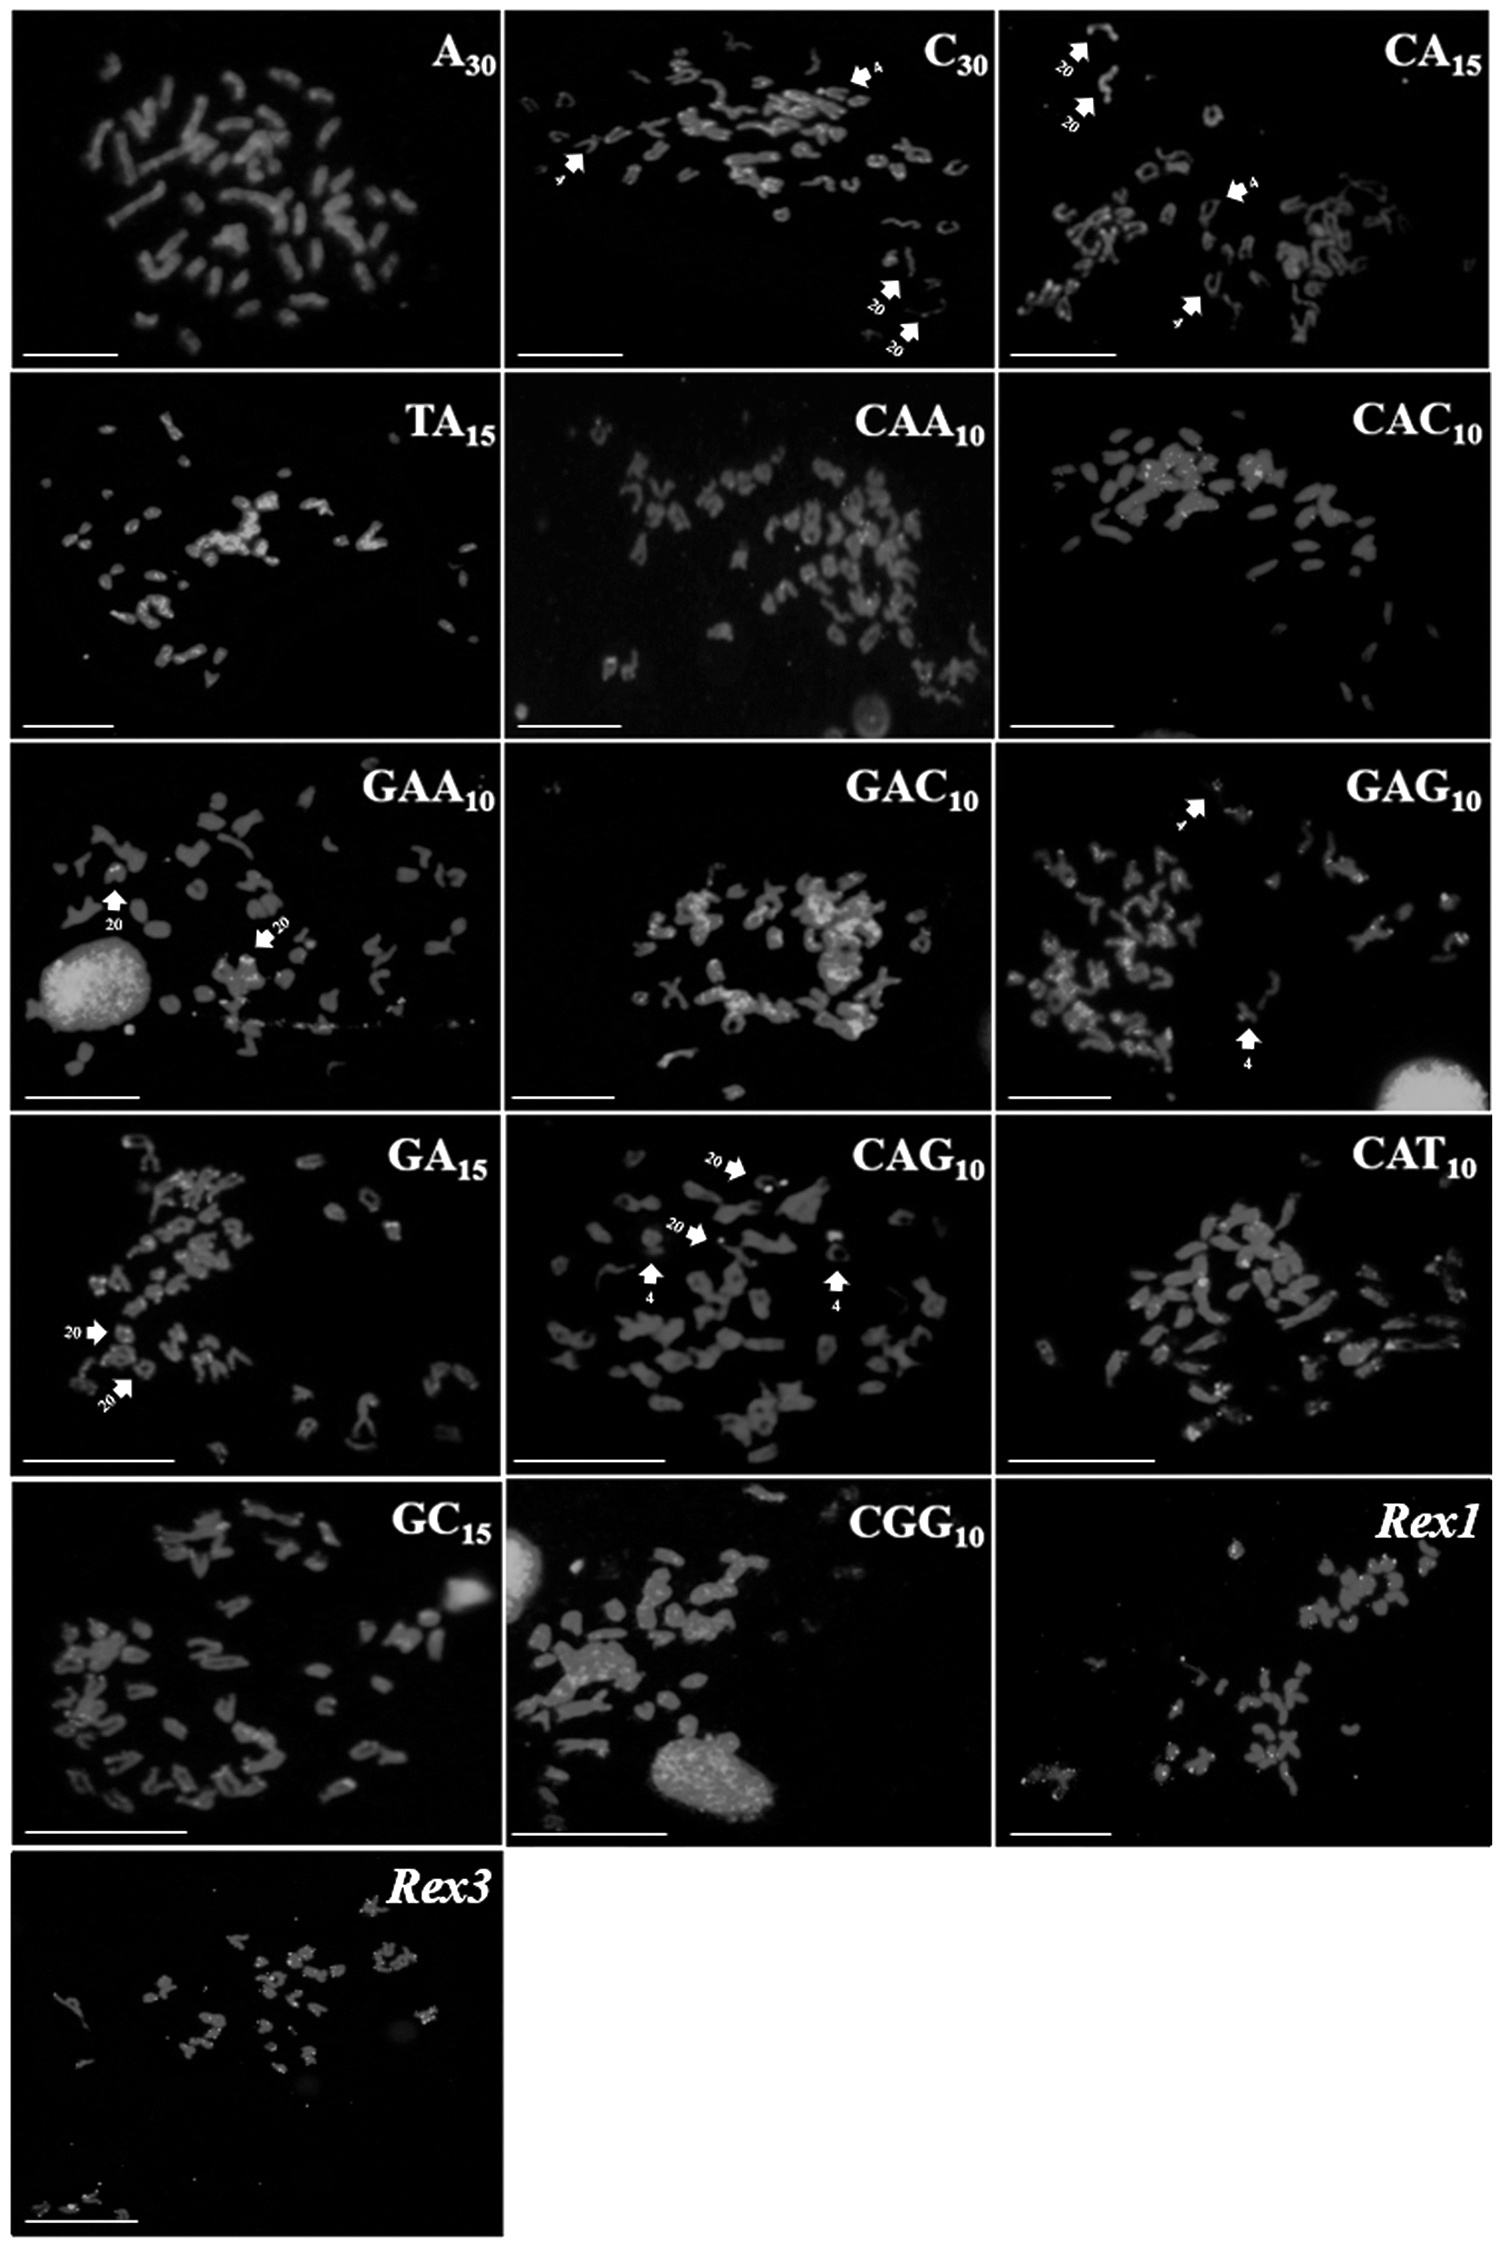
Distribution of the microsatellites and transposable elements in the genome of Elops smithi. Scale bar = 10 μm.
Discussion
The expansion of the genomic database on the repetitive DNA sequences in the Elopiformes may contribute to a better understanding of the role of these sequences in the evolution and organization of the chromatin in this group.
The microsatellites were observed in both heterochromatic and euchromatic regions, with a strong tendency to accumulate in the heterochromatic regions (Fig. 4). These results corroborate the idea that the accumulation of microsatellites is found mainly in hotspots for chromosomal rearrangements. In addition, this concentration of repetitive sequences may also correspond to regions in which chromosomal rearrangements, such as inversions and fusions, have occurred.11,20 For instance, Sousa et al. 5 identified vestiges of interstitial telomeric sequences in pair 3 of M. atlanticus (Fig. 2), which may have resulted of a tandem fusion in the genome of this species, and the location of some microsatellites in this region reinforces this hypothesis.
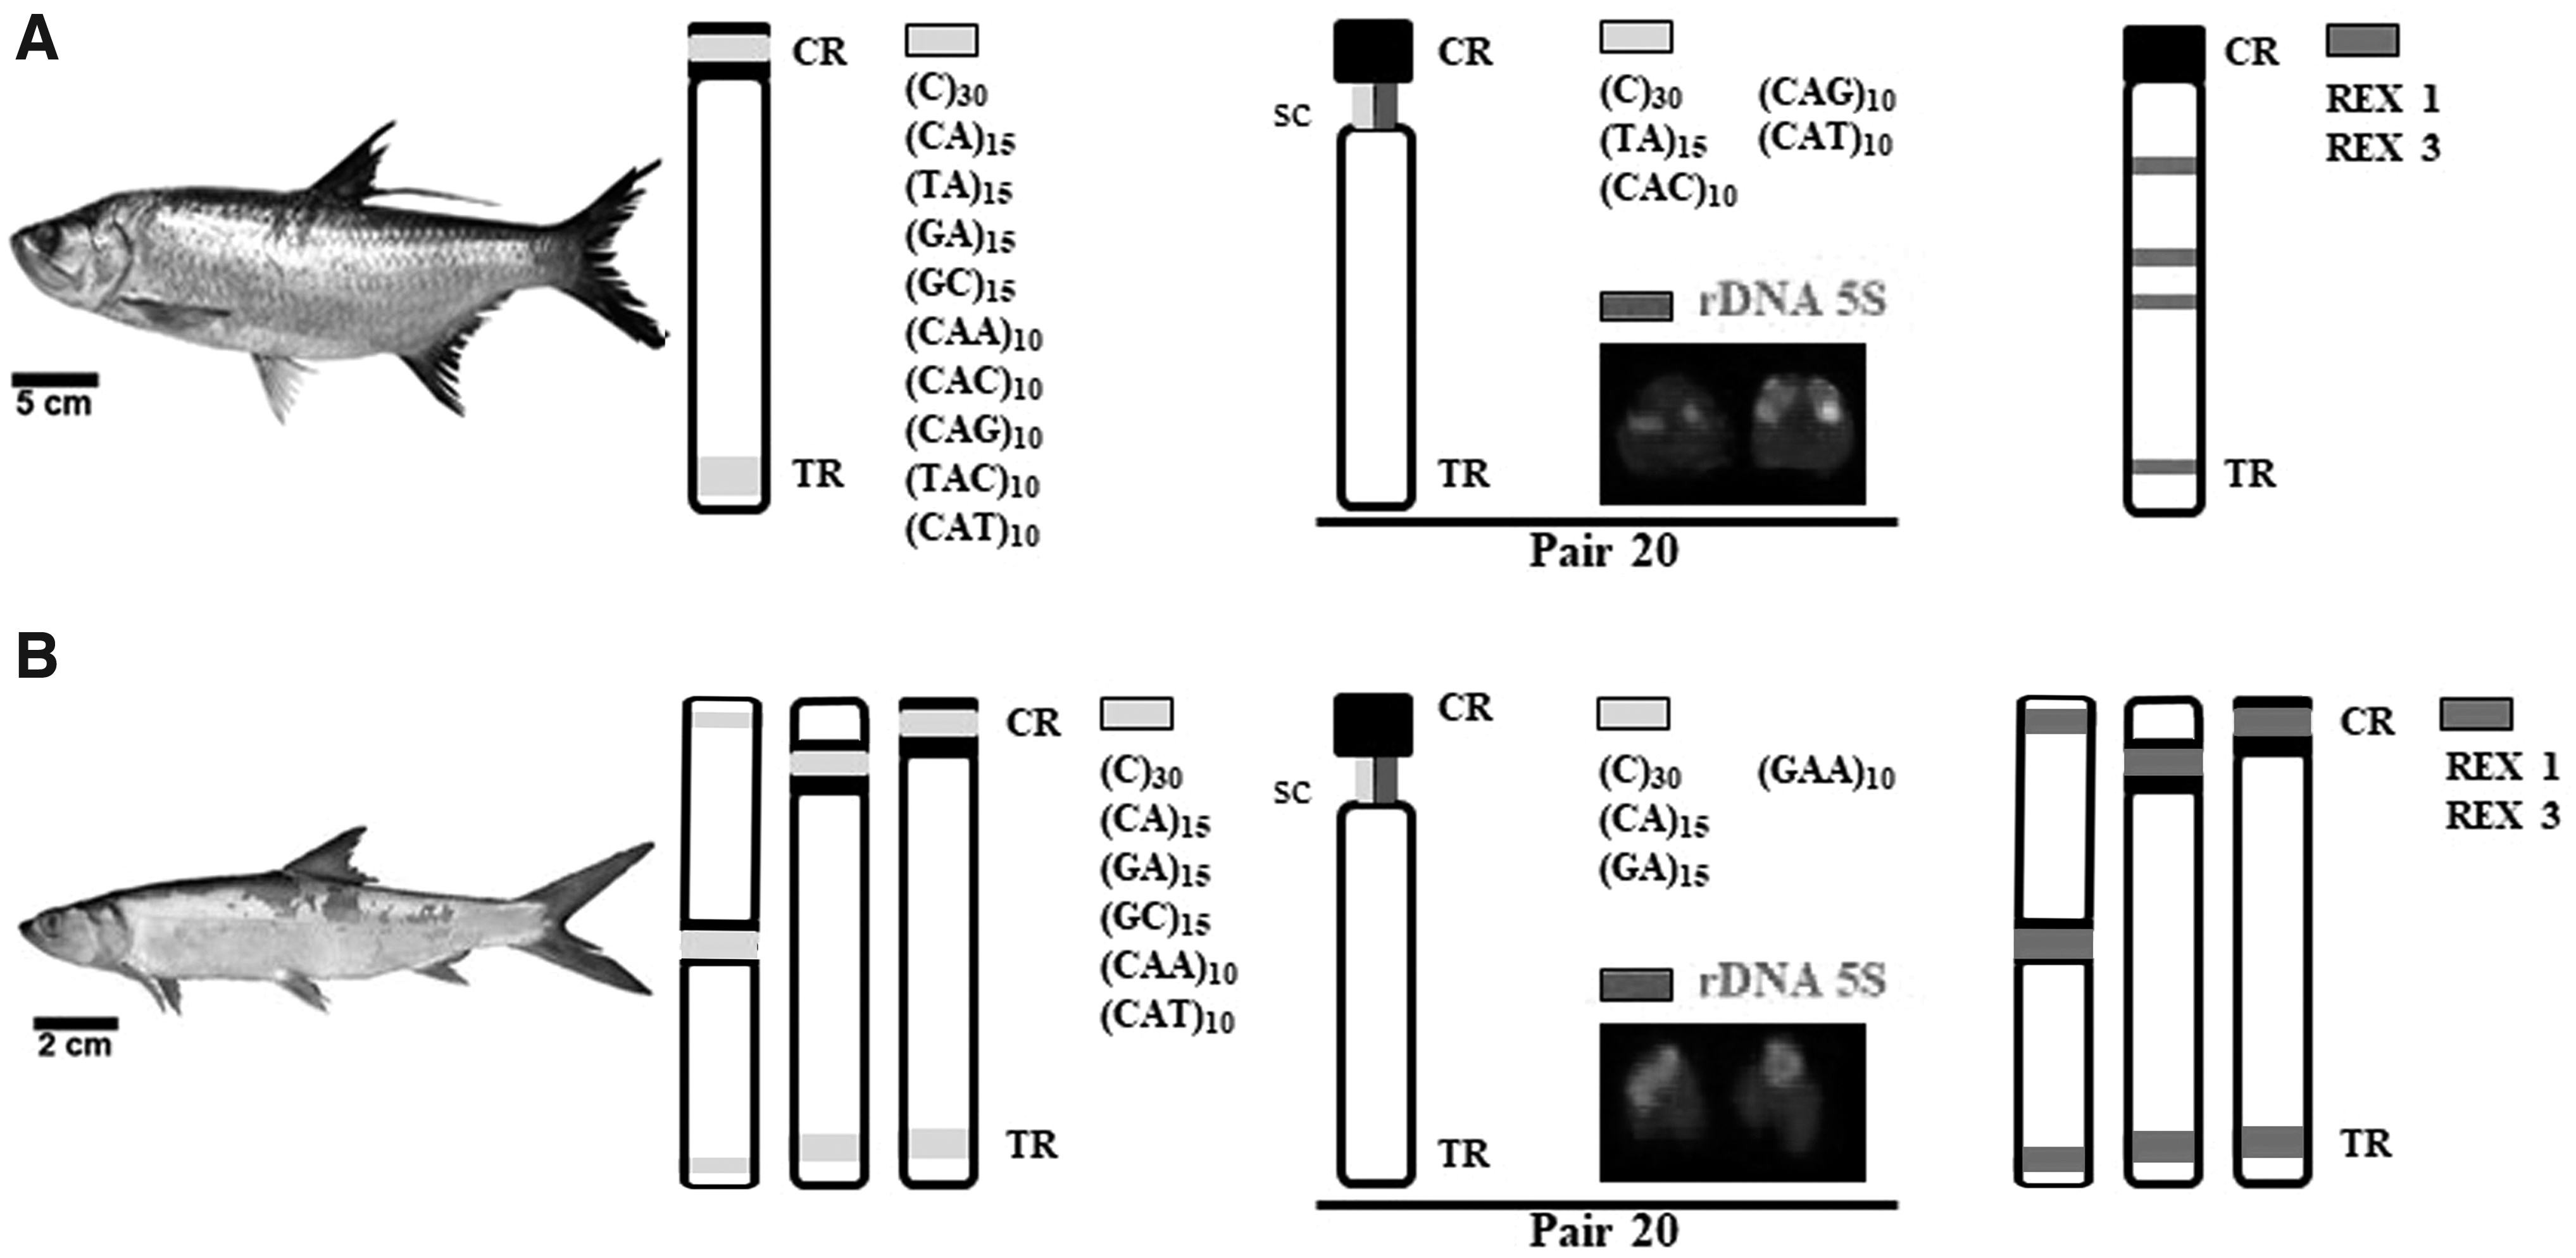
Summarized scheme of the distribution patterns of microsatellites and transposable elements in the genome of Megalops atlanticus
Normally, repetitive sequences are not under any major selective pressure that affects the nonrepetitive sequences, which means that most microsatellite sequences evolve in a neutral way and apparently do not influence the individual phenotype. 21 However, recent studies have identified functional microsatellites that affect the physical characteristics of the individual.22–24 These putatively functional microsatellites are located primarily in or adjacent to genes, or intragenics, and vary in the number of repetitions of the motif, which can influence gene expression or alter proteins through mechanisms such as DNA polymerase slippage during the replication.25–27
In a study involving the same two species, Sousa et al. 5 identified 5S rDNA signals in the secondary constriction of pair 20, corresponding to the same position at which the sequences (C)30, (TA)15, (CAC)10, (CAT)10, and (CAG)10 are located in M. atlanticus, and (C)30, (CA)15, (GA)15, and (GAA)10 in E. smithi (Fig. 4). This indicates that this set of sequences may have some more ample function that promotes the stability of the chromosomes, either by safeguarding or stimulating the expression of the genes associated with these sequences.
It is important to highlight that from both species, there is a difference in the composition of 5S rDNA in homologs; therefore, the microsatellites present there may be involved with the duplication of this gene. Furthermore, the preferential location of the sequences in specific regions of the euchromatic chromosome may be advantage for the identification of the regions in which the arrangement of the microsatellites is more conserved or degenerated. 28
The evidence also indicates that the accumulation of microsatellites in the genomes of eukaryotic organisms is not a random process: each group of organisms presents a specific pattern of accumulation of certain motifs in a given set of chromosomes, as observed in species of fish genera such as Leporinus, Channa, and Hoplias.29–31 Following this reasoning, the marked accumulation of the (C)30, (TA)15, (CAC)10, (CAG)10, and (GAA)10 signals in the telomeric regions and the secondary constrictions of pair 20 in both Elopiformes species may indicate that these microsatellites are potential cytotaxonomic markers for this group, although data on other species would be necessary to validate this hypothesis.
The transposable elements represent another important class of repetitive DNA, which has been analyzed in the genomes of an ample variety of organisms, with the Rex retrotransposons being the most studied in fishes.32–34 The in situ mapping of retroelements in many species of fish revealed a pattern of distribution in heterochromatic regions. It is postulated that these sequences have important functions in the structure and organization of the centromeres. 35
Our results showed a more restricted distribution of Rex1 and Rex3 elements in E. smithi, whereas in M. atlanticus, both retrotransposons were more dispersed in the genome (Fig. 4). In general, the results indicate that the transposable elements are important structural components of the heterochromatic regions, since their association primarily in centromeric and telomeric regions in both species, which in turn leads us to infer that the transposable elements may have played an important role in the evolutionary history of the genomes of these two Elopiformes species.
The presence of transposable elements at locations where microsatellites are also observed is a very common pattern in the Siluriformes, Perciformes, and Characiformes.29,31,33,34 The position of the microsatellite sequences mapped in this study was similar to that of the retroelements in both species, with signals being spread throughout the chromosomes and others in the terminal and centromeric regions. 34 It indicates that these sequences may be involved in the structural formation of the centromere and the telomere.36,37
Ultimately, the accumulation of the transposable elements in the heterochromatic regions is associated directly with the low rates of recombination, reflecting the removal of these sequences from regions with high rates of recombination, in which ectopic recombination possibly have the most deleterious effects.32,38 There may also be the more active elimination of the transposable elements from regions rich in genes due to their potentially negative effects when inserted in the gene, where the products codified by the transposable elements may have deleterious consequences for the genome. 39
Conclusions
In general, repetitive sequences were found dispersed throughout the genomes of M. atlanticus and E. smithi, indicating a pattern of compartmentalization in the heterochromatic region of the chromosomes. However, some of the signals detected in the euchromatic regions point out that the dynamics of these sequences is extremely complex, and may be related to the modulation of gene expression.
The large quantity of data generated by the chromosomal mapping of the repetitive DNA sequences in a range of fish species provides an important source of information on the structural and functional role of these elements in the genomes of the species. However, as the structure and organization of the Elopiformes genome are still poorly understood, the analysis of the chromosomal distribution of these DNA sequences in E. smithi and M. atlanticus represents an important step in the compilation of an integrated picture of the genomes of this group.
Footnotes
Acknowledgments
We are grateful to the CAPES (Coordenação de Aperfeiçoamento de Pessoal de Nível Superior) and Conselho Nacional de Desenvolvimento Cientifico e Tecnologico (CNPq) for financial support. We thank the Brazilian Society of Genetics (66th Brazilian Congress of Genetics—2021), where partial results of this study were presented. We would also like to thank the Laboratório de Cultura de Tecidos e Citogenética of the Instituto Evandro Chagas and the Laboratório de Evolução at the Instituto de Estudos Costeiros of the Universidade Federal do Pará for technical support and infrastructure.
Ethical Approval
All applicable international, national, and institutional guidelines for the care and use of animals were adhered to in this study, which was approved by the Brazilian National Council for the Control of Animal Experimentation at the Universidade Federal do Pará.
Disclosure Statement
No competing financial interests exist.
Funding Information
This research project was financed by the Conselho Nacional de Desenvolvimento Cientifico e Tecnologico (CNPq) (308217/2019-5; 422744/2018-2).