




Abstract
Motility is a widely available parameter that can be used to assess sperm quality of aquatic species. Sperm from fishes with external fertilization usually undergo a dynamic and short-lived period of motility after activation. The common practice of assigning a single value at an arbitrary peak of motility presents challenges for reproducibility, community-level standardization, and comparisons across studies. This study aimed to explore statistical approaches to standardize motility reporting, and to develop an initial framework for community-level standards. Sperm samples from 14 zebrafish (Danio rerio) with a total of 21,705 cells were analyzed by use of computer-assisted sperm analysis with data collection starting at 10 s after activation at 5-s intervals for 50 s. Four common motility variables were selected for analyses: curvilinear velocity, straight-line velocity, beat cross frequency, and amplitude of lateral head displacement. Cluster analysis was used to evaluate sperm subpopulations within and among males over time, least-square means was used to explore temporal aspects, and the first derivative of the regression equations was used to calculate the rate of change for the motility parameters. Cluster analysis proved informative, but overlapping ephemeral clusters were not valuable for providing standardization options. Analysis of temporal aspects and rate of change indicated opportunities for standardization by reporting the overall motility-time functions or reporting during stable time windows instead of peak motility or at random times. These approaches could minimize the inconsistencies caused by male-to-male variation and dynamic changes of subpopulations while providing comparable information. An overall temporal framework was identified for motility reporting along the collection-processing-cryopreservation-thawing sequence to provide a basis to support efforts of community-level standardization.
Introduction
Zebrafish (Danio rerio) is the most important aquatic animal model for biomedical research. The National Institutes of Health (NIH) annually funds $0.5–1.0 billion for studies based on zebrafish line development, maintenance, and use. Despite this substantial investment and associated repository activities by the Zebrafish International Resource Center (ZIRC), community members who use zebrafish for research struggle with performing effective cryopreservation of valuable lines. 1 Essential steps in implementing reproducible sperm cryopreservation would include an understanding of initial quality, post-activation timing of measurement, and actual measurement of the sperm traits of interest.2,3 These components can serve in combination with fertility evaluation to enhance community infrastructure, and most importantly, in developing germplasm repositories and gene banks in cooperation with central stock centers. 4
Sperm motility is widely used as an indicator to assist research activities in fields such as molecular biology for phenomic and genomic analyses,5,6 reproductive biology for the development of assisted reproduction technologies,7,8 and cryopreservation as quality control checkpoints 9 to support germplasm repository development. 10 Although motility analysis approaches are often sufficiently standardized for mammalian species, 11 strategies for standardized analysis and use of motility for aquatic species are not well developed. 12 This lack of standardization compromises direct comparisons among studies and the reproducibility of research outcomes.13,14
In most fish species, sperm are immotile within the testes and male genital tract. In externally fertilized species, they become motile upon discharge into the aqueous environment during the process of spawning, 15 or in internally fertilized species, when introduced into the female reproductive tract.16,17 As such, reproducible sperm activation and analysis procedures are necessary for laboratories to acquire motility parameters, without introducing variability among operators. Most importantly, the rapidy changing temporal motility characteristics of aquatic species pose considerable challenges to community-level standardization. Compared with mammalian sperm, for example, that can swim continuously for days, the motility duration of sperm in many fish species is usually short (measured in min) with a brief peak motility duration (often measured in sec), when highest percentage motility or velocity occurs.18,19
This dynamic nature impedes community-level standardization, in large part, because the majority of researchers aim to report a “peak motility.” 20 In practice, however, it is extremely challenging to consistently record motility parameters within this peak window of several sec for several reasons. Sperm sample and activation media are: (1) manually mixed in tubes (or on glass slides or observation chambers), (2) loaded onto microscope stages, (3) flattened with a coverslip, (4) positioned to regions of interest, (5) observed, and (6) assessed for motility parameters by manual estimation or computer-assisted sperm analysis (CASA). The timing of this series of actions is prone to substantial variation because operators can struggle to complete them at the exact time when the assumed peak motility occurs. Reporting is often made at an aspirational target peak motility (e.g., 10 s), which contributes to the uncertainty when attempting direct comparison of values across studies.
In addition to these technical challenges, nonstandardized terminologies are used to describe motility; different technologies are used, and there is a pervasive lack of identification of influential variables after sample collection, such as timing and storage conditions including temperature. For example, throughout the cryopreservation process from sample collection to fertilization, the term “fresh motility” is used to describe different phases by different researchers, and is not adequately defined. The combination of these factors greatly diminishes the value of motility as a tool for evaluating sperm function and quality, especially at the community level. 12
Statistical approaches can be powerful tools for characterizing sperm motility. With the advancement of analysis techniques, it has been shown that motile sperm cells do not all move at the same velocity or follow the same movement pattern within a given sample. 21 Such differences led to the exploration of new forms of statistical analysis that could account for this heterogeneity, 22 and this has been addressed in several species, mainly in mammals 23 and recently in some fish species. 24 These variations have been characterized by statistical approaches such as cluster analysis 25 and can be used to identify patterns among and within samples (e.g., identification of subpopulations). Other classical statistical approaches, such as least-square means (LMS), have been used to characterize motility dynamics over time. 26
The goal of this study was to identify opportunities and practical frameworks for standardization of temporal factors and terminology in the analysis of aquatic species sperm motility. Although motility measures provided by CASA for zebrafish sperm were used for the evaluation of different statistical approaches, standardization opportunities and frameworks identified herein would also apply to manual motility analyses, and to other species. Specific objectives were to: (1) evaluate the feasibility of cluster analysis of CASA measures within and among males; (2) characterize the dynamics of motility measures across different temporal points after activation; (3) evaluate changes of individual rankings among males and rate of change among motility parameters across time after activation, and (4) propose a framework to standardize temporal factors for the evaluation of sperm from aquatic species with a short (i.e., several min) motility span.
Improved practices such as these are needed to support the transition from cryopreservation research to development and use of germplasm repositories to protect and distribute aquatic genetic resources necessary for research and other purposes such as aquaculture and conservation of imperiled species.
Materials and Methods
Fish husbandry
Protocols for the use of animals in this study were reviewed and approved by the Louisiana State University Agricultural Center Institutional Animal Care and Use Committee (Baton Rouge, LA). Adult zebrafish (AB line; standard length 28 ± 0.4 mm and body weight 431 ± 25 mg) were obtained from the Zebrafish International Resource Center (Eugene, OR). Fish were acclimated to aquaria conditions for 14 days before sperm collection. Water quality parameters were monitored weekly to maintain target values for temperature (28°C), pH (8.5), and photoperiod (14-h light:10-h dark). Fish were fed twice daily: frozen brine shrimp (San Francisco Bay Brand®, Newark, CA) in the morning and dry zebrafish mix feed 27 in the afternoon. Additional water quality parameters that were monitored weekly and held at an acceptable range included ammonia (0–1.0 mg/L), nitrites (0–0.8 mg/L), and nitrates (0–15 mg/L).
Sperm collection
Fish were anesthetized before stripping with 0.01% MS-222 (Tricaine methanesulfonate; Western Chemical, Inc., Ferndale, WA). Sperm samples were collected into 50 μL of 300 mosmol/kg Hanks' balanced salt solution (HBSS300: 0.137 M NaCl, 5.4 mM KCl, 1.3 mM CaCl2, 1.0 mM MgSO4, 0.25 mM Na2HPO4, 0.44 mM KH2PO4, 4.2 mM NaHCO3, and 5.55 mM glucose, pH 7.2), and the concentration was adjusted to 1 × 10⁸ cells/mL. Samples were stored at room temperature (∼24°C) and evaluated within 1 h after collection.
Computer-assisted sperm analysis
A commercially available CASA (HTM-CEROS, version 14 Build 013; Hamilton Thorne Biosciences, Beverly, MA) system was used to capture images at a rate of 60 frames/s (for 100 frames total for each recording). The CASA settings, based on preliminary studies, included the following: minimum contrast value set at 50, minimum cell size at two pixels, cell size at four pixels, and cell intensity at 65. Four common CASA parameters were selected for analyses: curvilinear velocity (VCL as μm/s; average velocity measured over the actual point-to-point track followed by the cell), straight-line velocity (VSL as μm/s; average velocity measured in a straight line from the beginning to end of the track), beat cross frequency (BCF as Hz; frequency of sperm head crossing the sperm average path in either direction), and amplitude of lateral head displacement (ALH as μm; displacement corresponding to the mean width of the head oscillation as the sperm cell moves).
For motility activation, 1 μL of sperm sample was mixed with 20 μL of deionized water on a Makler® counting chamber (10-μm depth). 28 This is a standard procedure that provides adequate reduction of osmotic pressure to ensure activation, and does not cause swelling or damage of the sperm cells during motility. 9 Three 1-μL samples per fish were analyzed within 1 h after collection. A timer was started to record the beginning of mixing (i.e., motility activation); CASA recordings were intiated at 10 s, and performed at 5-s intervals for 50 s, yielding a total of 11 recordings (ending at 60 s after activation).
Data conditioning
In total, motility parameters were collected with CASA for 21,705 cells from 16 zebrafish males (male identification numbers 17–33, not numbered consecutively). Overall, these samples exhibited the typical pattern observed for zebrafish sperm: rapid initial motility that ceased or substantially declined within 1 min. 19 The data were not normally distributed in terms of cell numbers across males and motility duration. To normalize the data, two males (ID numbers 21 and 31) with very low cell counts at the later observation periods (45–60 s) were not included in the analyses. In all males, the remaining numbers of motile cells after 50 s were low, which prohibited analysis of variance when using interaction terms; therefore, data collected after 50 s were not included.
Data with values that exceeded two standard deviations for the mean of each motility parameter were also excluded. These adjustments resulted in using 19,021 sperm cells (∼90% of the original data set) from 14 males in the analysis. A Box-Cox power transformation was used to fit data to a normal distribution. 29 The lambda values computed by the Box-Cox algorithm were 0.875 (VCL), 0.986 (VSL), 0.855 (BCF), and 0.141 (ALH).
Cluster analysis
To evaluate the utility of cluster identification for zebrafish motility data, the hierarchical clustering method was used to identify subpopulations within and among individual males over time. Hierarchical clustering can be used to identify groupings within an overall population, 30 rather than using arbitrary value ranges for classification (e.g., classifying as slow, medium, and fast groups by assigning values). The Ward's Minimum Variance method 31 was used for clustering, because it enabled evaluation of minimum variance within clusters, formation of clusters in a hierarchical manner, and determination of the number of clusters based upon measures such as pseudo t-tests and cubic clustering criterion.
Analyses of temporal dynamics
In addition to the clustering approach, statistical methods were used to characterize temporal aspects. Statistical differences were evaluated using restricted maximum likelihood (REML) through JMP (SAS Institute). The models included the main effects and interactions for male, time, male × time (interaction), and time as a quadratic and cubic effect. Least-square means (LSM) for time and male for VCL, VSL, BCF, and ALH were calculated (SigmaPlot v12.5; SPSS, Inc., IL). Because the LSM were adjusted for the interaction of male and time, they were used to develop a best fit (based upon R2) curve of each CASA parameter. Curves and equations for the rate of change over time were calculated using the first derivative of the equations. Statistical results of p < 0.05 were considered significant.
Rate of change
The rate of change for the four CASA parameters was computed using the first derivative of the regression equations. Critical minimum, critical maximum, and inflection points for regression equations can be used as indicators for the identification of important temporal points and periods. 32 Minimum and maximum critical points were identified by setting the first derivative of regression equations to zero. The inflection point was identified by setting the second derivative to zero.
Results
Data overview
Before LSM adjustment, cell data (19,021 cells) from each male over time were plotted (Fig. 1.) At 10 s, VCL for all males was at the highest levels (>80 μm/s). Over the 50-s measurement period samples declined to ∼40 μm/s for VCL. Importantly, variation (represented as ridges and valleys, Fig. 1) among and within males were apparent across time, indicating that the rate of decline was not homogeneous among males, nor was it consistent within individual males over time. This showed that considerable male-by-time interactions were present.
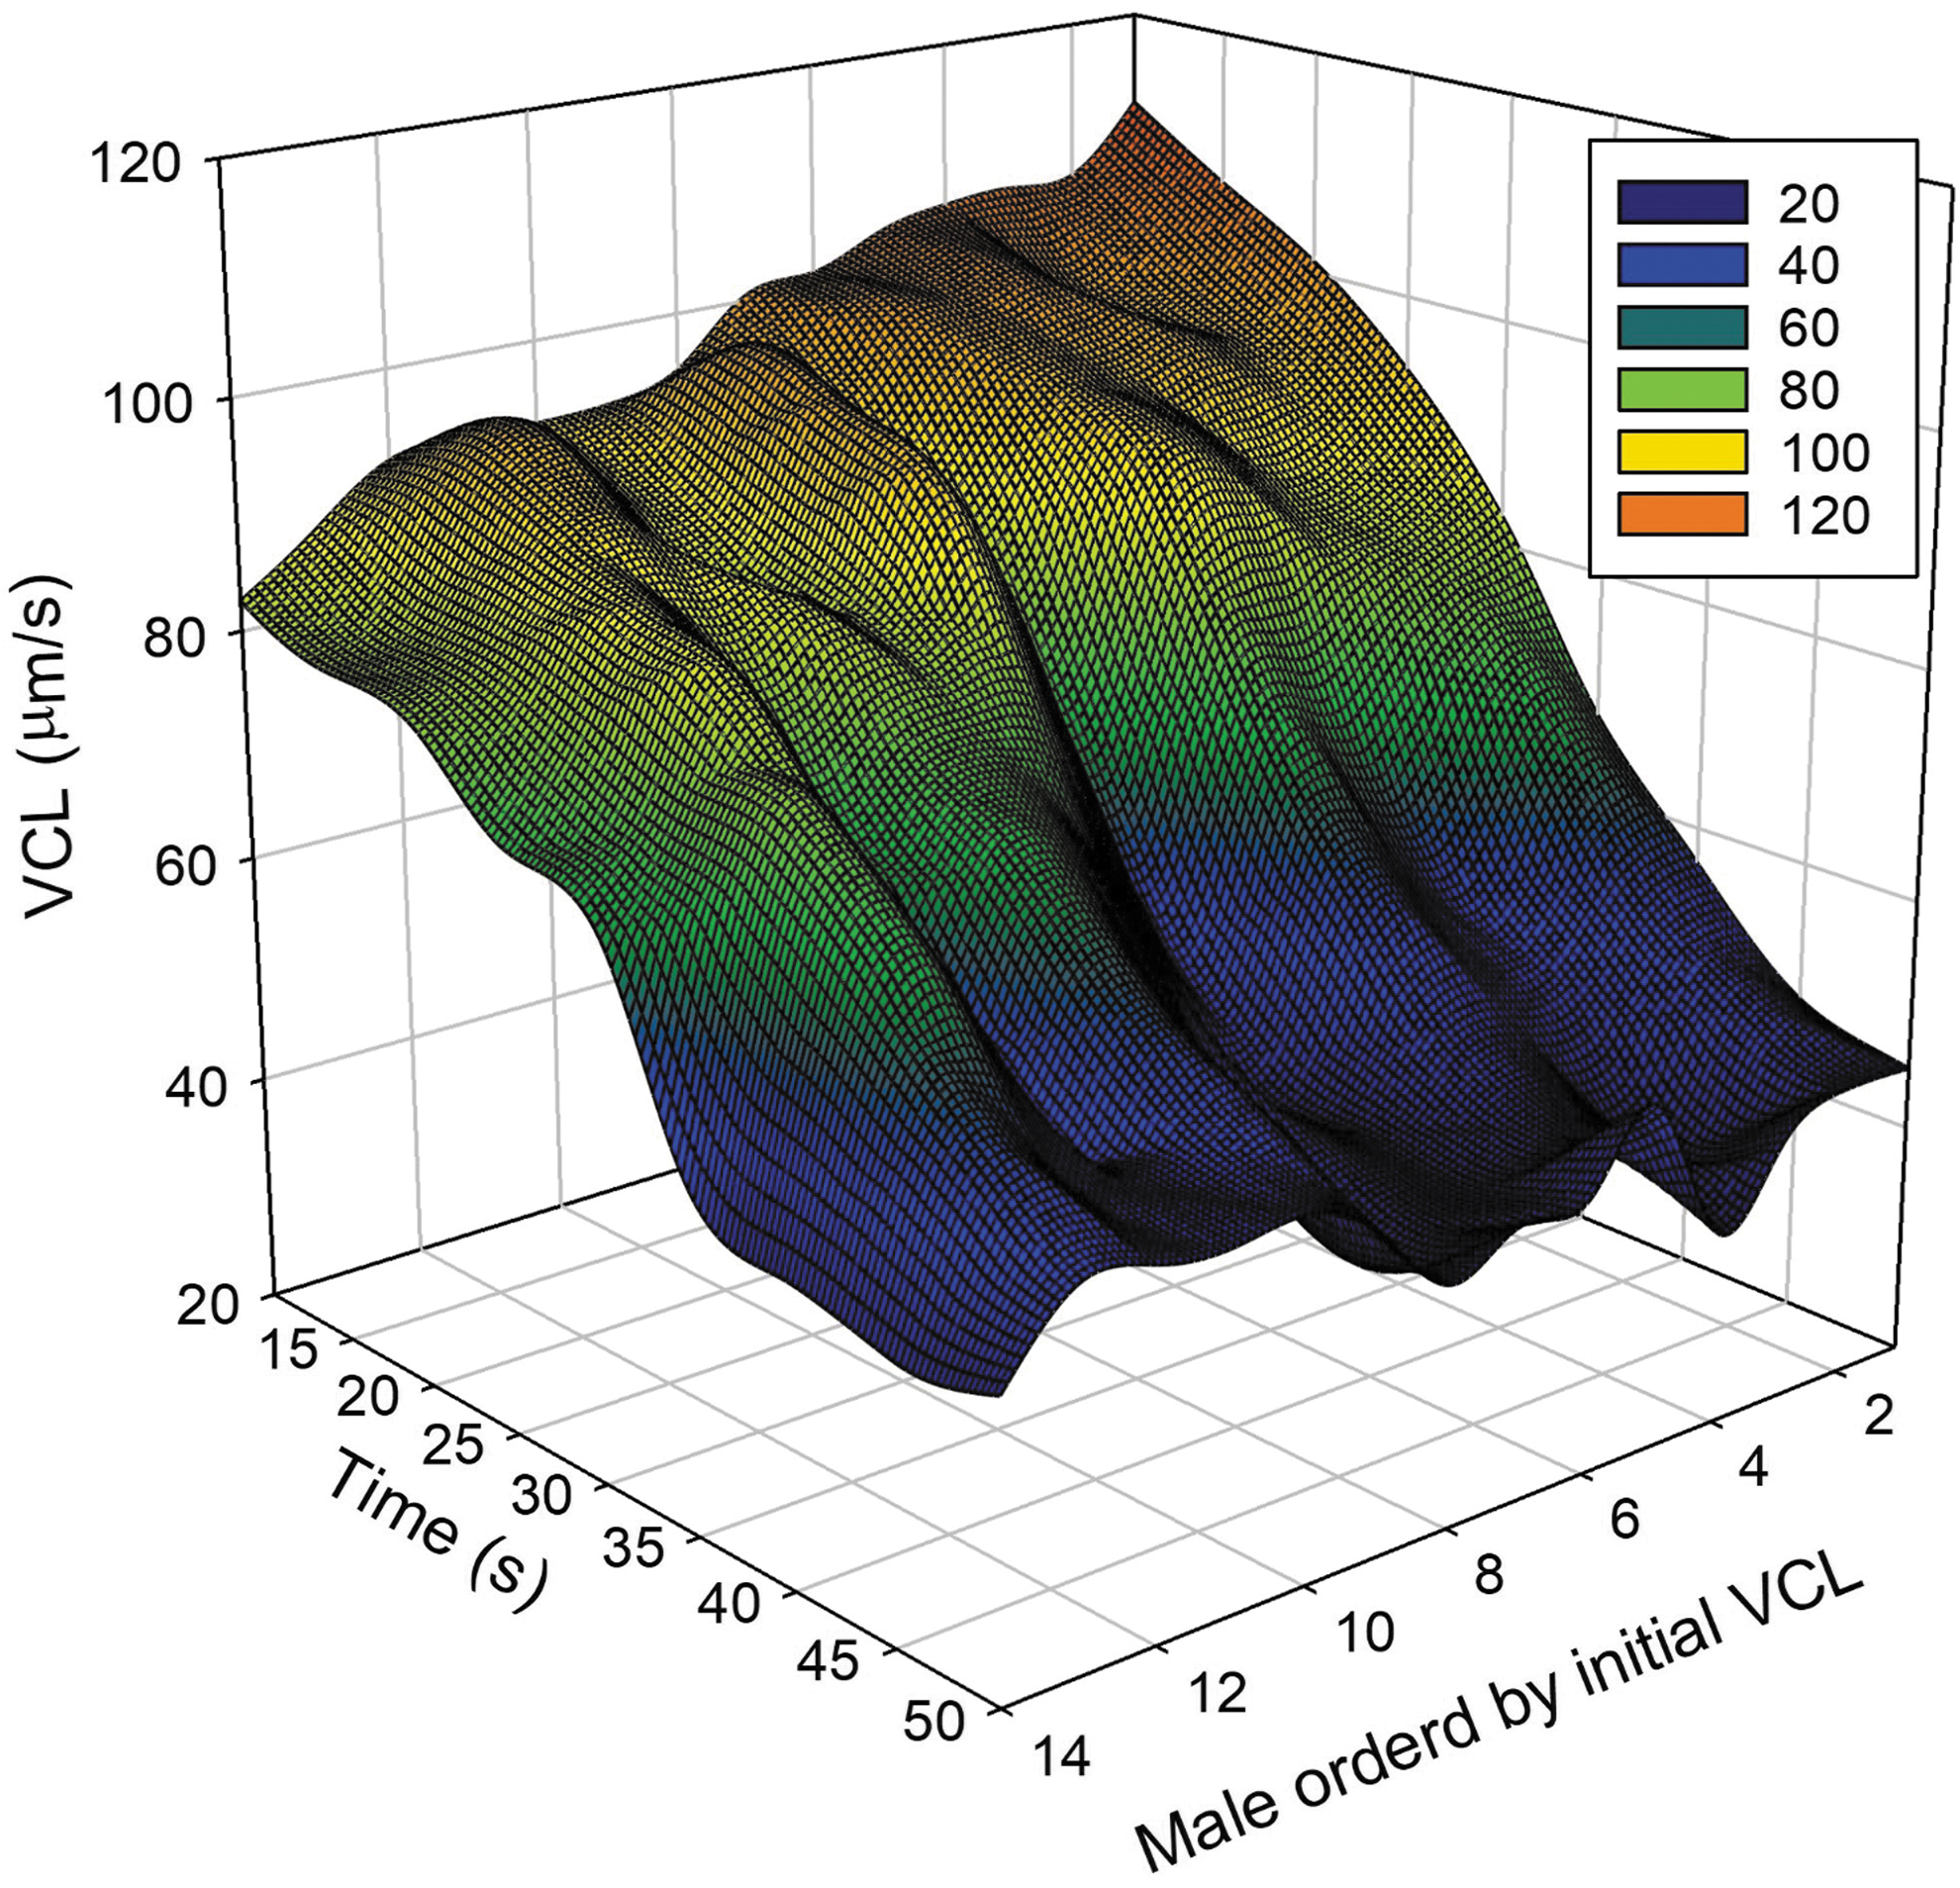
Overview of unadjusted data collected in the present study. Males were ranked in order of initial VCL recorded at 10 s, and performed at 5-s intervals. The VCL of each male over time illustrates how VCL declined through time with an inconsistent rate of change. Values in the box represent velocity levels (μm/s). VCL, curvilinear velocity.
Cluster analyses
With the combined data for 14 males, three clusters were identified for VCL, BCF, and ALH (Fig. 2), and four clusters for VSL. When individual CASA parameters were combined (Fig. 3), there was substantial overlap among clusters. The regression lines suggested a negative relationship for ALH, VCL, and VSL, and a positive correlation for BCF with time.

Sperm motility clusters based upon time and male (n = 14) for VCL, VSL, ALH, and BCF, where different colors represent different clusters, and the lines represent the linear regression for each combination. VSL, straight-line velocity; BCF, beat cross frequency; ALH, amplitude of lateral head displacement.
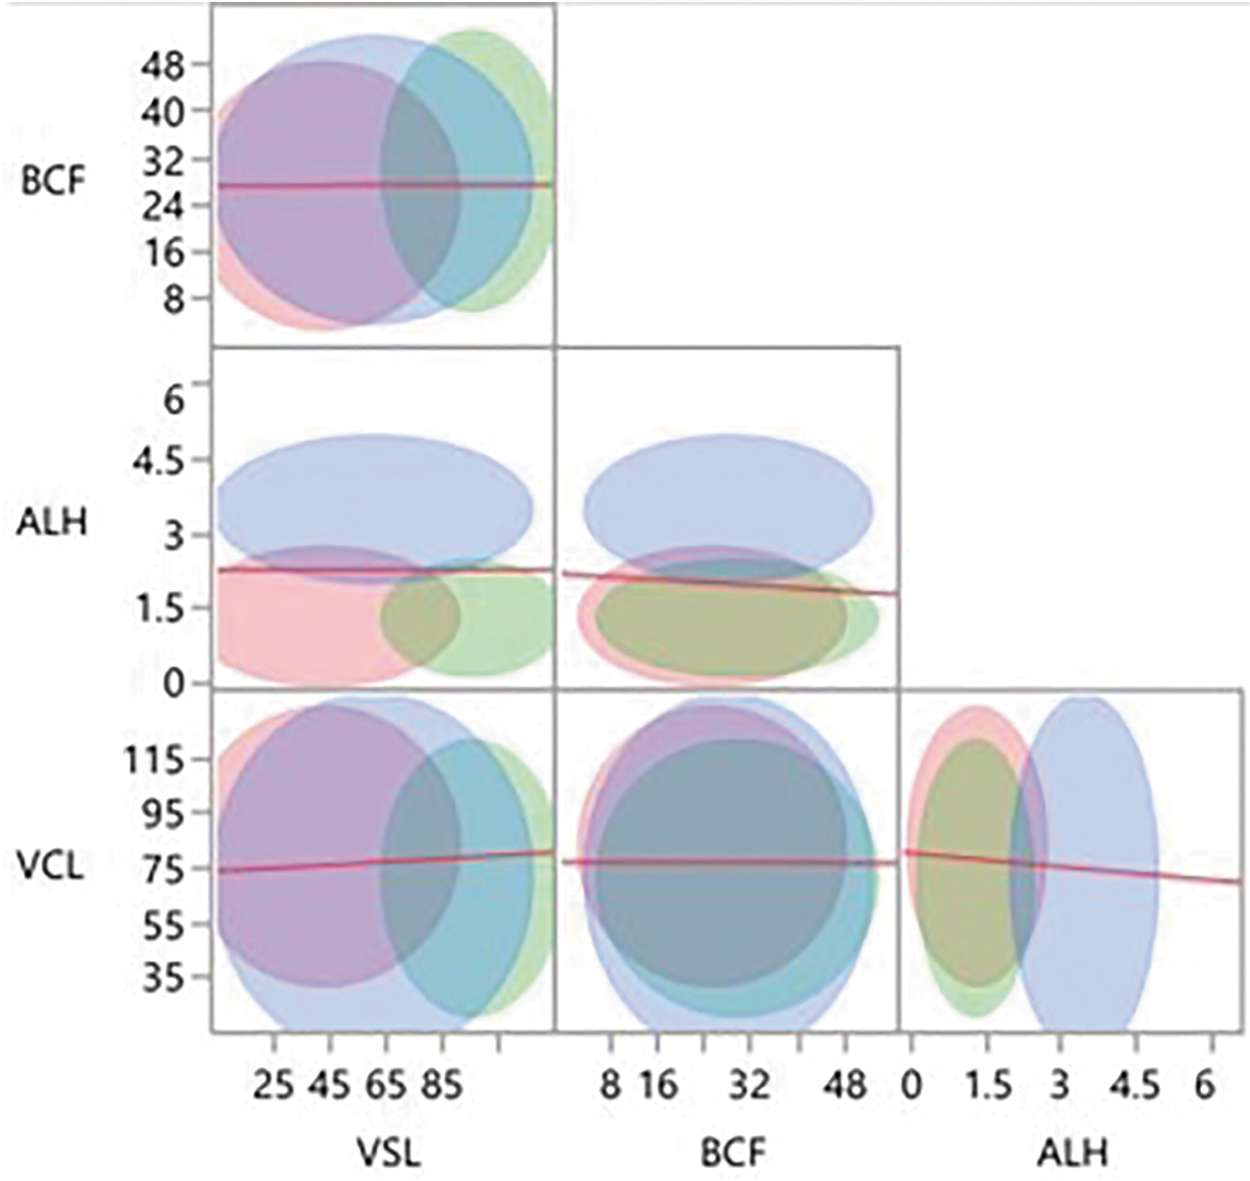
Sperm motility clusters based upon factoral combination of CASA parameters (VCL, VSL, BCF, and ALH) using the combined data set (all males and time periods) where different colors represent different clusters and each line represents the linear regressions.
Three males were chosen to illustrate within-individual clustering patterns (Table 1 and Fig. 4), with VCL categorized as fast (Male 22), medium (Male 17), or slow (Male 27) based on initial measures at 10 s. Four (i.e., Males 22 and 27) or five (Male 17) clusters were identified. Generally, VCL clusters were aligned from high to low as time progressed. The slope of the regression line for each male was different, with Male 22 (fastest initial VCL) decreasing more rapidly than Males 17 and 27. No single cluster encompassed all the time points and specific levels of VCL.

Sperm motility clusters of VCL as time changes for individual males with varying initial VCL speeds: #22 (fast), #17 (medium), and #27 (slow). Different colors represent different clusters, and lines represent linear regressions.
Numerical Size, Duration of Time, and Curvilinear Velocity for Sperm Clusters of Individual Male Zebrafish That Represent Initial Slow (#27), Medium (#17), or Fast (#22) Curvilinear Velocity
Cluster numbers match those in Figure 4.
VCL, curvilinear velocity.
However, Cluster 4 of Male 27, Cluster 3 of Male 17, and Cluster 3 of Male 22 spanned the majority of time points with the least overlaps (Fig. 4). The mean VCL of these clusters was the slowest or second slowest within each male (Table 1). While the motility time was relatively short (13–16 s) for the fastest clusters (Cluster 1), the percent of cells placed into Cluster 1 tended to be relatively high (Table 1) compared with the other clusters for each male.
Characterization of temporal dynamics
Regression (Fig. 5) and ANOVA (Table 2) were performed to evaluate motility dynamics with time and male as main effects and interactions. The model effects for VCL, VSL, and ALH (Table 2) were significant (p < 0.05), underscoring the importance of the interaction between male and time. For BCF (Table 2), male and time were significant (p < 0.05) as main effects, but the interactions were not significant. A cubic regression was fitted to the LSM per male by time, indicating the nonlinearity of VCL and VSL. Importantly, male rankings did not remain constant across time (Fig. 5).

Least-squares means of CASA parameters (VCL, VSL, ALH, and BCF) of individual males (n = 14) over time after activation, and the fitted regression equation. For VCL, males #22 (green), #17 (gold), and #27 (red) are denoted to illustrate how individual male rankings changed over time. CASA, computer-assisted sperm analysis.
Equation Coefficients (and Standard Error) Calculated from Least-Squares Means Analyses of VCL, VSL, BCF, and ALH Where Male and Time Were Used As Model Main Effects and Interaction Terms
Significance (p < 0.05) of model terms.
VSL, straight-line velocity; BCF, beat cross frequency; ALH, amplitude of lateral head displacement.
Evaluation of the rate of change
The nonlinear changes (Figs. 1 and 5) in CASA parameters suggested varying rates of change as measurement time progressed. The rate of change (Fig. 6) for VCL, VSL, and ALH became negative and reached a maximum loss per unit of measurement at 30 s (for VCL), 35 s (for VSL), and 25 s (for ALH). After reaching the minimum, the rate of change increased but remained negative until after 45 s for VCL and VSL. For ALH, the rate of change turned positive after 40 s. The rate of change for BCF (Fig. 6) differed from the other traits as it increased linearly over time. For the equation of each variable, the critical minimum, critical maximum, and inflection point were calculated (Table 3).
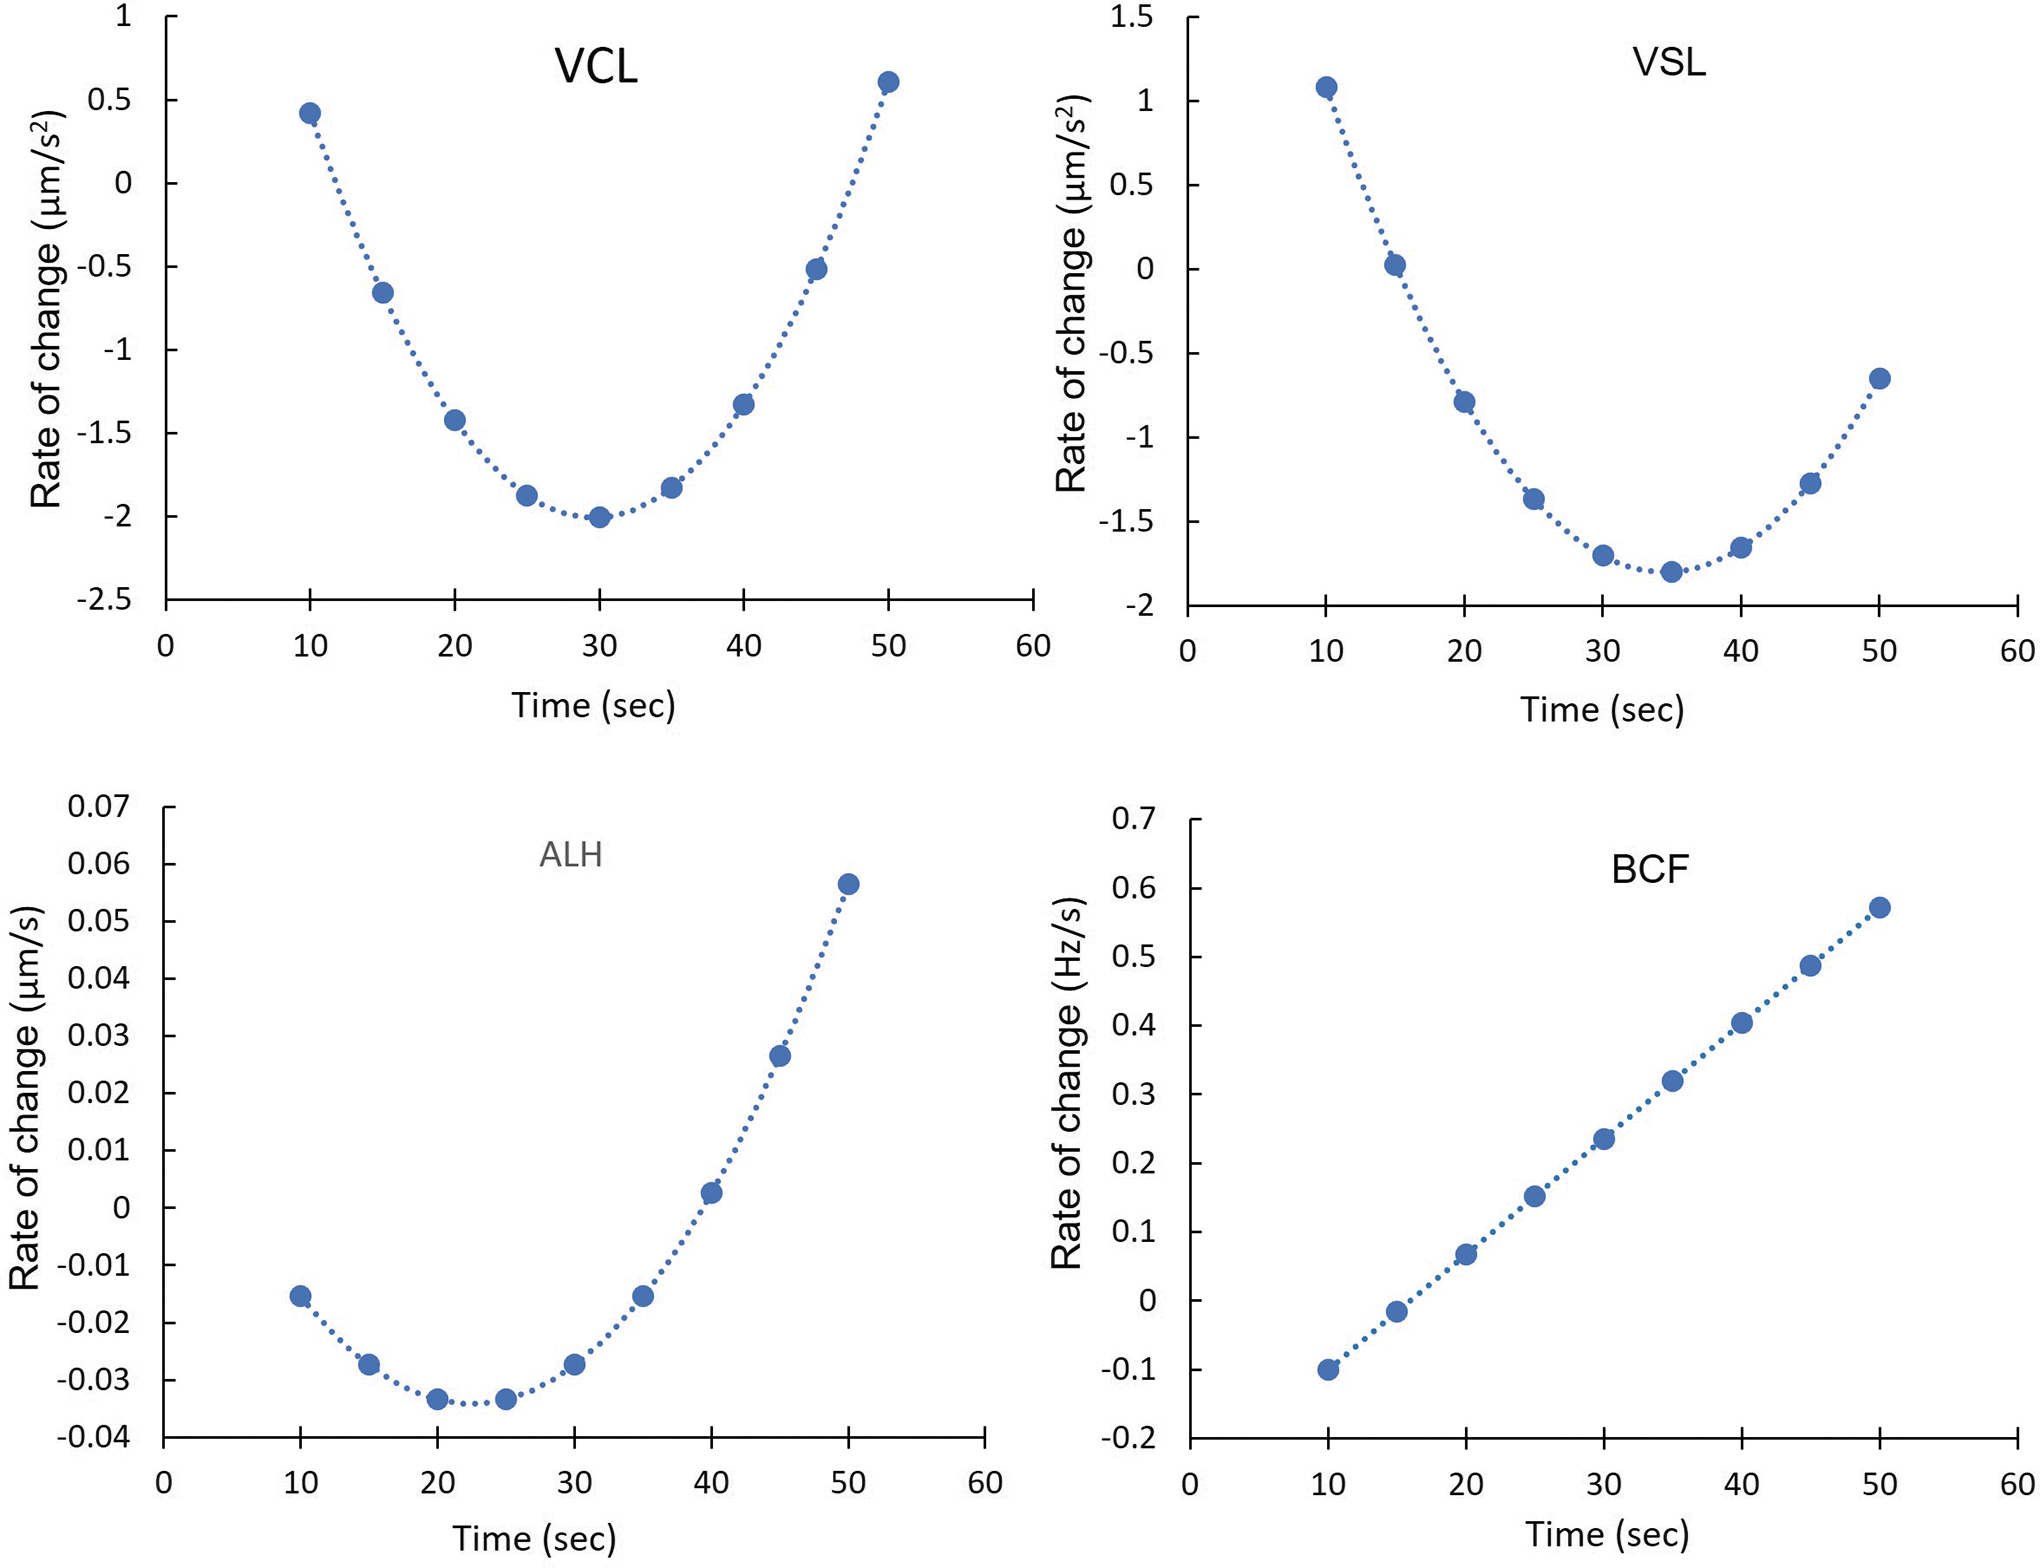
Rate of change over time for CASA parameters (VCL, VSL, ALH, and BCF) calculated using the first derivative of the regression equation from Figure 5.
Critical Minimum, Critical Maximum, and Inflection Point Values Calculated for the CASA Parameters VCL, VSL, ALH, and BCF Based on Regression Equations
These points can be used to identify appropriate time windows for measurement and comparison of sperm motility parameters.
The derived equation did not have a point of inflection or critical maximum.
These values provided points in time where a variable could be most consistently measured. No inflection and critical maximum points were identified for BCF due to the linearity of the equation.
Discussion
Motility can be useful for assessing sperm quality in research and applied practices. However, a lack of consistency in its use can be problematic for comparison of research results and for reproducing protocols. For example, the term “motility” itself can be used with different meanings by different researchers. It can refer to a percentage of mobile sperm, or broadly used as a range of sperm movement parameters (e.g., in the present study), including the percentage of mobile sperm and various velocity variables. This problem is less pervasive in mammals than in aquatic species because of the established infrastructure, well-developed community-level guidelines, 33 and a relatively smaller phylogenetic diversity. 34
In recent years, more laboratories have acquired a specialization in sperm analysis (e.g., andrology research laboratories or human fertility clinics) and are equipped with CASA systems. However, most entry-level users in the aquatic community do not have CASA for routine quality assessment. These users, including most of the 1500 zebrafish laboratories worldwide (zfin.org), have need for occasional sperm assessment and preservation, but do not focus on sperm research. Most importantly, although useful for objective image acquisition and analysis, CASA systems developed for human and livestock applications often lack the capability to standardize timing of sperm analysis for aquatic species with short motility durations after activation.
The present study focused on characterizing specific temporal dynamics by use of statistical analysis with a large sample size (i.e., 19,021 cells), and thus, the bulk percentage motility parameter was not selected for use in the statistical models. Based on the primary conclusions of this analysis, it is evident that sperm cells within and among individuals are highly variable over time, making consistent measurements difficult to accomplish on a routine basis. However, using individual cell data versus unadjusted averages in statistical analysis can correct for some variability, and lead to the identification of various points in time (critical points or inflection points) where samples can be measured with higher levels of consistency.
Concerns in standardization of motility analysis
Due to multiple sources of variability in motility parameters, standardization and harmonization across communities 35 have been difficult to achieve. For example, motility can be measured and assessed using multiple approaches (e.g., CASA or naked eye), microscopic settings (e.g., bright field, dark field, or phase contract), metrics (e.g., percentage or quartile), and variation in training level (experienced or novice staff). There is also variability in the terminology used to describe motility parameters in publications, where terms such as “progressive,” “slow,” “static,” “swimming,” “mobile,” “initial motility,” and “fresh motility” can be differentially applied and interpreted. Although specific parameters can be defined and reported with computer systems such as CASA, they are also subject to variability across instruments, timing, settings, and users.
In addition to these notable problems, temporal difficulties extend beyond the scale of the first minute after sperm activation. As indicated above, there is no consensus on the timing or terminology used to describe sperm samples during the minutes, hours, or days that occur after collection and through processing or analysis. This lack of community standards in practices and reporting is problematic at two levels: within the individual facility, where unstandardized timing for motility assessment can lead to inconsistent results despite using the same protocols, and among groups, where it is difficult or impossible to directly compare published results and achieve reproducibility.
As such, we have proposed an overall framework to provide opportunities to standardize at these two timescales. The first is the timing after sperm activation when assessment is performed (in this specific study, “fresh sperm,” without cryoprotectant addition or cryopreservation), which we addressed with cluster and statistical analyses. The second timescale, discussed below, is proposed to account for the overall time (e.g., hours, days, or even years) from sperm collection to ultimate use (e.g., for fertilization).
Cluster analysis
In fish, sperm subpopulations or clusters based on motility have been reported for Atlantic Salmon (Salmo salar), 36 Tambaqui (Colossoma macropomum), 24 Senegalese Sole (Solea senegalensis),37,38 Gilt-head Bream (Sparus aurata), 39 Three-spined Stickleback (Gasterosteus aculeatus), 40 and Steelhead (Oncorhynchus mykiss). 41 Common assumptions among these studies were that faster swimming sperm had an advantage over slower moving sperm and that clusters containing faster cells were constant over time.42,43 Most of these studies measured motility only at a single time, and their statistical analyses did not include the interaction between male and time; therefore, they would have missed the changes in sperm motion as observed in this study.
In the present study, cluster formation was determined to be transient (e.g., present for short periods and then dissipating). The formation of various clusters at different time intervals was due to the variation within and among males over time. Clusters computed when using all males in the study indicated no clustering could be identified as being constant over time. Instead, clusters were formed for intermittent periods. Furthermore, we were unable to detect a single cluster of fastest sperm across all time points, and the number of males per cluster was variable, suggesting that cluster analysis was a less than conclusive approach for comparing sperm motion parameters. This also suggested that the arbitrary partitioning of sperm cells into fast, medium, and slow groups at single time points may not be useful because sperm cell motion characteristics were constantly changing over time.
In addition, when clustering sperm of three divergent representative males, we observed that clusters overlapped considerably. All males had a cluster with a proportion of cells with relatively higher VCL, but these clusters were short lived; whereas clusters of intermediate or low VCL were present longer. The mean VCL for these clusters ranged from 52 to 71 μm/s, ∼39% slower than the fastest clusters. Although fast, medium, and slow clusters can be identified as shown in other studies,24,39 the short duration of these subpopulations poses a twofold problem for analysis across the research community: (1) consistent measurement is required for timing across samples from different males, and (2) it is impossible to practically elucidate which cluster would be most effective in fertilizing eggs.
Characterization of temporal dynamics
Curves derived from LMS showed the decay of VCL, VSL, and ALH and the increase of BCF over time. These nonlinear responses of CASA measurements over time call attention to the potential to standardize the timing of measurements to when the rate of change is at its minimum. Although the zebrafish males used here came from the same genetic background, male-to-male variation was statistically significant, reinforcing the argument that analyses of sperm motion need to account for individual male effects in statistical models. 44
Consistent with the cluster analyses, regression analysis showed that males with the fastest velocities at earlier times did not sustain the same ranking over time. Although reasons for these changes in rank have not been extensively explored, differential rates of energy consumption might play an important role, or heterogeneity (or heterozygosity) of the alleles controlling sperm function. These results suggested that the measurement of motility parameters at single time points (e.g., peak motility) as a means for comparing male-to-male performance can be misleading. In addition, reporting of a single motility value can encourage the inefficient pursuit of “high motility.” For example, researchers could tend to seek the highest motility values achievable by devoting resources to optimize individual steps in cryopreservation protocols (rather than optimizing at the overall process level 45 ).
However, these pseudo-optimizations may offer no additional practical value with respect to fertilization of small batches of eggs (e.g., 100 for zebrafish) from a single female, especially with an excess of sperm cells (e.g., 5 × 10⁷ cells per thawed sample). As such, they can lead to unnecessarily complicated or expensive protocols without yielding tangible benefits. This pursuit of arbitrary higher motility values can thus be incompatible with the development of much-needed germplasm repositories. As such, a greater awareness of diminishing returns on investment obtained by seeking to improve motility per se could encourage efforts to identify practical opportunities to develop practical repository systems that can simultaneously support research through standardization, harmonization, and quality management.
Thus, a community-level approach for motility assessment could be based on reporting motility–time curves and functions, minimizing inconsistency caused by male-to-male variation and dynamic changes of subpopulations. Reporting data in the form of motility–time curves would also provide additional information regarding sperm quality that could be analyzed or reanalyzed in multiple ways. For example, post-thaw sperm motility often has a relatively faster decay rate than does motility before cryopreservation. 46 Such valuable information is lost when only single motility points or peak motility values are reported, and the decay rates could be used to evaluate sperm quality in contexts other than those for which they were originally reported.
Evaluation of rate of change
Measurement of motility parameters near the inflection points, critical minimum or critical maximum, can provide opportunities for community-level harmonization and standardization. At these points, the slope of the curve is zero within the curves for VSL, VCL, and ALH, suggesting a relatively stable time where sperm cell measurements are not changing. However, there are several factors to consider. Generally, the critical minimum occurs close to or at the beginning of activation, and thus it can be difficult for operators to take measurements consistently at the critical minimum points. In addition, the calculated minimal critical value for ALH was an extrapolation occurring before the actual first measurement. However, sufficient time elapsed between activation and the critical maximum to eliminate such difficulties, although the cluster analyses (Table 1) suggested fewer cells and slower velocities at the later measurement periods.
Performing motility measures at or near the inflection point—where the rate of change is zero—offers an opportunity for consistent measurement that is less time-sensitive, yet remains practical and mechanistically useful. At ∼30 s for samples in the present study, operators would have sufficient time to perform measurements after mixing of sperm and activation media. As such, if a single repeatable motility value is to be reported instead of the overall motility–time curves, measurements at the inflection point could be superior to an arbitrary peak motility point for community-level standardization purposes. However, this motility value, while being more repeatable, would typically be lower than the observed “peak motility.” In practice, such inflection points need to be identified for different species and genetic lines, and may need to be specified for different stages in the cryopreservation process (e.g., initial vs. after thawing).
Standardized reporting could enable elucidation of subtle relationships between motility kinetics and fertilization not possible with less specific assessments such as percent motility.
A potential temporal framework for standardizing reporting of motility assessment
In the big picture, to assist community-level harmonization relevant to germplasm repositories, we identify below three general phases in the cryopreservation process and four minimum motility check points (Fig. 7). The first phase (fresh sample handling) spans the interval from sample collection to immediatley before processing for cryopreservation. Depending on the application, this phase can last for several minutes (e.g., samples collected for immediate cryopreservation), hours (e.g., samples used for protocol development), or days (e.g., samples used after transport). This phase could be reported as “preparation and storage,” with motility reported at specific times (Tps), that start immediately following sperm collection (T0). The value of this information would be greatly increased if the temperature was recorded simultaneously.

A temporal framework of process phases and assessment points for community-level standardization of reporting of sperm motility. The first phase (fresh sample handling) spans sample collection to just before processing for cryopreservation. This phase could be referred to in reports as “preparation and storage,” with motility reported at specific times (Tps), which begin immediately following sperm collection (T0). The second phase (cryopreservation core processing) spans the interval from addition of a cryoprotectant through the completion of the cooling process. This phase could be referred to in reports as “equilibration and freezing” with specific times (Tef). The third phase (post-freezing management) includes sorting of frozen samples, long-term storage, transport, thawing, and fertilization. This phase could be referred to in reports as “thawing and use” with specific times (Ttu), including performing motility assessments as close to the time of thawing and fertilization (i.e., gamete mixing and activation) as possible. QM, quality management; QC, quality control; QA, quality assurance.
The second phase (cryopreservation core processing) spans from the addition of cryoprotectant through the completion of the cooling process. During this phase, samples are equilibrated with cryoprotectants, loaded into containers (e.g., straws or vials), and cooled to a final cryogenic temperature (e.g., −80°C). This phase could be reported as “equilibration and freezing” with specific times (Tef) and would be of greatest utility if placed in relation to the time of collection (T0).
The third phase (post-freezing management) includes sorting of frozen samples, long-term storage, transport, thawing, and fertilization. Given that frozen storage could extend for years, the relevant time period for motility assessment would begin at the initiation or completion of thawing (which would be reported). This phase could be reported as “thawing and use” with specific times (Ttu), including performing motility assessments as close to the actual time of thawing and fertilization (i.e., gamete mixing and activation) as possible.
Through this entire process, assessment and reporting of motility would occur at a minimum of four time points (Fig. 7). The first point would be as soon as motility can be evaluated after collection (this could be before or after initial dilution depending on collection methods). For example, it could be reported as “motility (defined specifically) at Tps = 5 min.” If samples were shipped or refrigerated, motility checks at multiple Tps would be beneficial to identify trends in quality changes.
The second minimum evaluation point would be immediately before the addition of cryoprotectant, because processes such as refrigerated storage and shipping can affect cell viability. For example, it can be reported as “motility (e.g., VCL) before the addition of cryoprotectant at Tps = 27 h.” This evaluation could be optional if samples are cryopreserved immediately after collection and the previous evaluation was performed.
The third minimum evaluation point would be at the end of equilibration, because cryoprotectant toxicity can affect sample quality. For example, it can be reported as “VCL after 15-min equilibration at Tef = 27 h 15 min” (reflecting the total time after collection). A practical operation for checking sperm quality after equilibration is to save a small portion of the sample (e.g., 5 μL) to be assessed after the rest of the sample is loaded into cryopreservation containers (e.g., French straws) for freezing (or, if possible, to designate a random container for motility check after loading).
As indicated above, the fourth minimum point for motility analysis would be as soon as possible after thawing, and could be reported as “VCL after thawing at Ttu = 5 min.” Because sample quality can degrade rapidly after thawing, 47 it would be useful to assess motility multiple times if samples are not used immediately.
Conclusions
The past seven decades of research efforts have been largely unable to support the establishment of germplasm repositories for aquatic species due to a number of reasons. 13 One of the most pervasive is the lack of standardized reporting that addresses the dynamic nature of sperm motility. The present study does not intend to suggest that motility measurements can only be performed in certain ways. Instead, we have demonstrated how groups might better standardize protocols by characterizing the temporal dynamics of fish sperm motility after activation, and by providing minimum approaches to document sample age that can be further evaluated and potentially adopted among user communities.
Specifically, statistical approaches were used to explore opportunities for standardization of zebrafish sperm motility reporting. Cluster analysis provided a general overview of the subpopulations after activation; however, the presence of overlapping ephemeral clusters reduced the practical value of this approach for standardization purposes. On the contrary, the curves derived reflected how changes in motility parameters occurred over time. Performing motility measures at or near the inflection point (∼30 s for zebrafish sperm, where the rate of change is zero) offers an opportunity for consistent measurement that is less time-dependent, and is still practical and mechanistically useful.
Overall, the most useful approach would be to express the time and motility relationship as a plotted curve or mathematical function that could be analyzed or used as needed. Therefore, reporting of motility at a set inflection point, or as the overall motility–time curve, provides approaches that could be extremely useful for community-level standardization purposes. In addition, the value of these more clearly reported motility data would be greatly magnified by the adoption of a universal framework for standardized reporting that accounts for the entire time and, if possible, temperature history between sample collection and thawing.
Footnotes
Disclaimer
The U.S. Department of Agriculture (USDA) prohibits discrimination in all its programs and activities on the basis of race, color, national origin, age, disability, and where applicable, sex, marital status, familial status, parental status, religion, sexual orientation, genetic information, political beliefs, reprisal, or because all or part of an individual's income is derived from any public assistance program (not all prohibited bases apply to all programs). Persons with disabilities who require alternative means for communication of program information (Braille, large print, audiotape, etc.) should contact USDA's TARGET Center at +1 (202) 720-2600 (voice and TDD). The USDA is an equal opportunity provider and employer. Mention of any trade name or commercial product does not imply endorsement by the USDA.
Disclosure Statement
Authors have no conflict of interest to declare.
Funding Information
This work was supported, in part, by funding from the National Institutes of Health, Office of Research Infrastructure Programs (R24-OD010441 and R24-OD028443), with additional support provided by the National Institute of Food and Agriculture, United States Department of Agriculture (Hatch project LAB94420), and USDA NAGP-AGGRC Cooperative Agreement (Awards 58-3012-8-006 and 58-6066-8-045). This article was approved for publication, Louisiana State University Agricultural Center as number 2022-241-36675.