




Abstract
Quantitative reverse transcription polymerase chain reaction (RT-qPCR) is commonly used to measure the mRNA expression of target genes in zebrafish. Gene expression values from RT-qPCR are typically reported as relative fold-changes, and relative quantification of RT-qPCR data incorporates primer amplification efficiency values for each target gene. We describe the influence of the primer amplification efficiency analysis method on RT-qPCR gene expression fold-change calculations. This report describes (1) a sample analysis demonstrating incorporation of primer amplification efficiency into RT-qPCR analysis for comparing gene expression of a gene of interest between two groups when normalized to multiple reference genes, (2) the influence of differences in primer amplification efficiencies between measured genes on gene expression differences calculated from theoretical delta-Cq (dCq) values, and (3) an empirical comparison of the influence of three methods of defining primer amplification efficiency in gene expression analyses (delta-delta-Cq [ddCq], standard curve, LinRegPCR) using mRNA measurements of a set of genes in zebrafish embryonic development. Given the need to account for the influence of primer amplification efficiency along with the simplicity of using software programs (LinRegPCR) to measure primer amplification efficiency from RT-qPCR data, we encourage using empirical measurements of primer amplification efficiency for RT-qPCR analysis of differential gene expression in zebrafish.
Introduction
Quantitative reverse transcription polymerase chain reaction (RT-qPCR) is a method used to measure mRNA expression of target genes across many biology-based disciplines. RT-qPCR is frequently used to assess gene expression in zebrafish. RT-qPCR involves a series of steps from sample collection to gene expression analysis (e.g., polymerase chain reaction [PCR] primer design, sample generation and RNA extraction, complementary DNA synthesis, RT-qPCR data collection and analysis). Many RT-qPCR studies measuring gene expression in zebrafish utilize SYBR Green reagents, using an intercalating dye that binds to double-stranded PCR products to quantify the amount of a specific target in a sample. RT-qPCR analyses are based on the quantification cycle (Cq), which is the PCR cycle at which the fluorescence signal increases to a detectable level above background. 1 This Cq value is proportional to the concentration of target DNA in the sample.
Most RT-qPCR gene expression studies make relative comparisons among experimental groups between expression of a gene of interest (GOI) and genes that are not affected by the experimental variable (i.e., reference genes [RGs], housekeeping genes). Measuring these unaffected genes accounts for variation in the sample amount in each RT-qPCR. Although many studies use a single RG for RT-qPCR analysis, using multiple RGs in analysis is needed for accurate comparisons and is best practice for RT-qPCR experiments.2,3 Testing RG expression consistency is a recommended RT-qPCR control experiment, and multiple studies have characterized RGs for zebrafish RT-qPCR analysis,4–7 including specific experimental conditions.8–10 In terms of RT-qPCR analysis standards, the Minimum Information for Publication of Quantitative Real-Time PCR Experiments (MIQE) guidelines describe detailed recommendations for experimental design and reporting considerations related to RT-qPCR. 11 One of the essential information factors to address is primer amplification efficiency.
Primer amplification efficiency refers to how well a PCR primer pair amplifies a DNA target and can be defined as the average number of copies of a target gene from a single PCR cycle. The theoretical maximum for primer amplification efficiency is 2; for every PCR cycle, the product amplifies one copy to two copies. In practice, primer amplification efficiency is often less than two based on various experimental factors (e.g., secondary structure and sequence of the target DNA) as well as individual primer sequences and binding characteristics (e.g., GC content). 12 The impact of variable PCR efficiency on gene expression analysis has been reported to be a significant factor in clinical diagnostics, 13 and MIQE recommendations encourage empirical measurements of primer amplification efficiency. 11
However, many RT-qPCR studies assume a primer amplification efficiency of two for all genes using the delta-delta-Cq (ddCq) analysis method. 14 In reviewing recent articles involving RT-qPCR gene expression studies in zebrafish, we noted significant variability in the methods for addressing primer amplification efficiency. A literature search in June 2022 using Google Scholar was filtered for 2022 publications associated with the keywords “embryonic development zebrafish RT-qPCR.” Of the 3870 publications identified in this search, 101 primary research articles involving RT-qPCR analysis of zebrafish gene expression were individually reviewed for RT-qPCR analysis methodology regarding primer amplification efficiency15–114 (Fig. 1).

Relative proportion of reported analysis methods addressing primer amplification efficiency among surveyed primary research articles involving RT-qPCR analysis with zebrafish. RT-qPCR, quantitative reverse transcription polymerase chain reaction.
Among this sample of articles, the vast majority either used ddCq methodology for analysis and assumed a primer amplification efficiency of two for all RT-qPCR measurements (n = 72, 71%) or did not specify analysis details regarding primer amplification efficiency (n = 21, 21%). Only 8% of these studies empirically accounted for primer amplification efficiency (n = 8).15–22
Commercial PCR primers can have close to absolute efficiency based on experimental evidence from associated informatics pipelines (e.g., Applied Biosystems TaqMan assay efficiencies = 100% ± 10%), but empirical testing for primer amplification efficiency of custom primer reagents is recommended (e.g., SYBR Green RT-qPCR).115,116 Standard curve analysis using serial dilutions of experimental samples has been used to empirically determine primer amplification efficiencies. However, this approach requires additional reagent and does not directly measure primer amplification efficiency in experimental samples. Empirically determining RT-qPCR primer amplification efficiencies under low gene expression (e.g., embryonic development) can be challenging for standard curves because serial dilutions of samples may not span the necessary range of Cq values or may produce greater technical variability of measurements (e.g., >35 Cq interpreted as a less reliable measure, near sensitivity limits of equipment).
This challenge can be partially addressed using diluted PCRs or synthetic oligonucleotides to allow the measurement of a wide range of target concentrations to assess primer amplification efficiency.117,118 Another approach is to assess primer amplification efficiency in each experimental reaction using software programs. Multiple algorithms have been developed for differential expression analyses using RT-qPCR equipment data file formats (e.g., improve background subtraction, 119 application of linear regression, and window-of-linearity approaches 120 ). A prominent program to measure primer amplification efficiency per sample is LinRegPCR, which was developed for clinical diagnostic PCR120,121 and has both an .exe and online versions available. 122
Here, we describe RT-qPCR analysis methods that incorporate primer amplification efficiency for comparing mRNA expression of genes of interest when normalized to multiple RGs. We also present theoretical data and empirical data to demonstrate the influence of primer amplification efficiency on gene expression fold-change measures in RT-qPCR analyses.
Materials and Methods
Zebrafish husbandry
Adult AB strain zebrafish were maintained in an Aquaneering housing environment at 28.5°C in a 14:10 h light-dark cycle. Zebrafish embryos were collected and placed in E3 media in a 28.5°C incubator until use. All protocols were performed in accordance with the guidelines of the UWEC Institutional Animal Care and Use Committee (IACUC).
RNA extraction and cDNA synthesis
Embryos were collected for RNA extraction at seven developmental stages (n = 6 samples per time point, ∼10 embryos per sample): 6, 12, 24, 48, 72, 96, and 120 hours postfertilization (hpf). RNA extraction was performed using the Qiagen RNeasy Mini Kit according to the manufacturer's protocol; samples were homogenized using a sonicator (Fisherbrand). DNA contamination was removed using a Qiagen RNase-Free DNase Set. RNA concentration and purity were measured using a NanoDrop One (Thermo Scientific) without additional RNA quality measures (e.g., RQI). Total RNA was converted to cDNA using the Bio-Rad iScript cDNA Kit with ∼1 μg total RNA per reaction according to the manufacturer's protocol using a Bio-Rad T100 Thermal Cycler.
PCR primer design and quantitative PCR
Primers for the genes used were created using Primer-BLAST. 123 Primer-BLAST design criteria included PCR product size <100 nucleotides, primer melting temperature range of 58–62°C, and used target sequences from the Reference Sequence (RefSeq) mRNA database for zebrafish. PCR template sequences were obtained using NCBI BLAST. Both primer and template oligonucleotides were synthesized as unmodified oligonucleotides under standard desalting conditions (Integrated DNA Technologies). In standard curve experiments, template oligonucleotides were measured at concentrations ranging from 5E-15 to 5E-18 M. Melt curve analysis was used to assess primer specificity. All primers yielded a single PCR product, indicating target specificity (data not shown).
RT-qPCR was conducted using iTaq Universal SYBR Green Supermix (Bio-Rad) according to the manufacturer's protocol. Samples were measured in a 96-well plate format using a CFX Connect Real-Time System RT-qPCR machine (Bio-Rad). The RT-qPCR protocol consisted of a denaturation step (95°C for 30 s), followed by 40 cycles of denaturation and annealing/extension (95°C for 15 s, 60°C for 30 s). The average of the three technical triplicates was used as the gene expression measurement for each sample-primer combination.
Data analysis
Relative gene expression ratios (R) were quantified based on established methods for normalizing with multiple RGs using geometric means2,124 with RT-qPCR primer amplification efficiency (E):
where GOI refers to the target gene of interest, RG refers to the reference genes (e.g., “n” genes not changed by experimental variable), “control” refers to the reference/control sample measurement (e.g., gene expression at initial timepoint), and “experimental” refers to the experimental sample measurement (e.g., gene expression at other time points).
Primer amplification efficiency was empirically measured using (1) standard curves and (2) the LinRegPCR program.120,121 Cq values were obtained using Bio-Rad CFX Maestro software using default settings with background subtraction for both ddCq and standard curve calculations. LinRegPCR software used raw RT-qPCR data and includes background subtraction; for LinRegPCR, a primer amplification efficiency was defined by the average of primer amplification efficiency values across all sample measurements per experiment. For standard curves, primer amplification efficiencies were calculated using standard methods based on the equation E = 10[−1/slope] where the slope is based on the linear regression of the plot of Cq values versus log10[DNA].124,125
To compare average gene expression measurements across time points and between analysis methods, statistical comparisons were made using single-factor analysis of variance (ANOVA) with Tukey honestly significant difference test (Tukey HSD test) post hoc testing. To make single comparisons among average gene expression measurements, individual comparisons of gene expression values were made using a two-sample t-test assuming unequal variance among samples.
Results
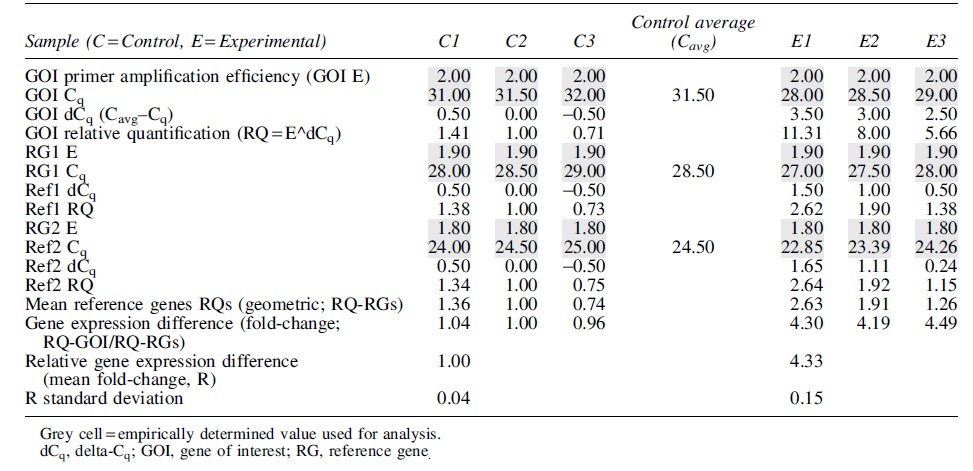
A sample analysis of RT-qPCR gene expression differences with multiple RGs and primer amplification efficiencies is visualized in Table 1. In this sample analysis, a single GOI is normalized with two RGs using corresponding primer amplification efficiencies. Empirical data of Cq values and primer amplification efficiencies (indicated by grey shaded boxes) can be converted into differential gene expression values using the indicated calculations. These calculations can be adapted to incorporate different numbers of genes of interest and RGs.
Theoretical Gene Expression Difference Calculations for Comparing mRNA Expression of One Gene of Interest in Control Treatment Versus Experimental Treatment with Normalization to Two Reference Genes
To determine how theoretical differences in primer amplification efficiencies affect fold-change calculations, fold-change values for a GOI and RG using a range of primer amplification efficiencies and delta-Cq (dCq) values (e.g., number of cycles different between control and sample groups) were compared (Table 2; hypothetical scenario where RGs have same primer amplification efficiencies and consistent dCq ratios). While equal primer amplification efficiencies resulted in the same fold-change outcomes across scenarios (grey shaded boxes), differing primer amplification efficiencies between the genes resulted in variation in fold-change calculation (i.e., GOI primer amplification efficiency >RG primer amplification efficiency, then greater calculated fold change; GOI primer amplification efficiency <RG primer amplification efficiency, then smaller calculated fold change).
Theoretical Effect of Primer Amplification Efficiency Differences on Fold-Change Calculations for Different Delta-Cq Values of Gene of Interest and Reference Genes
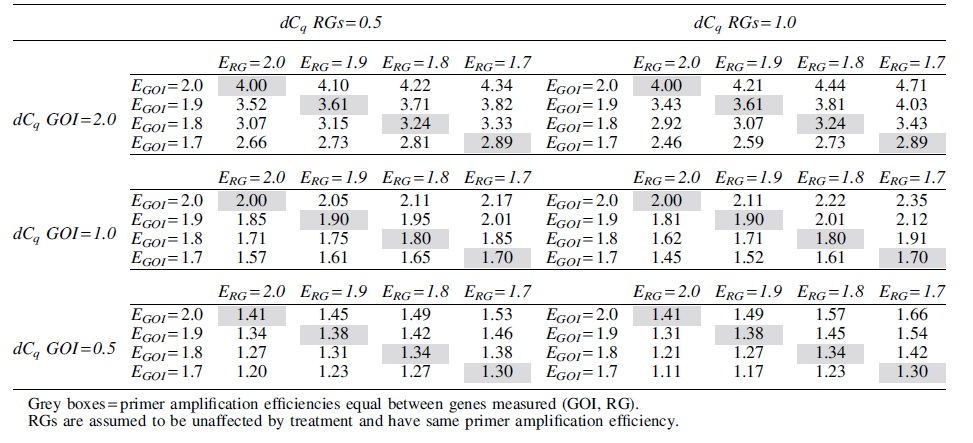
These differences were also affected by the dCq of the RGs (greater variance of RGs between groups = greater effect of primer amplification efficiency differences on calculated fold-change values). For example, if the GOI dCq was 2 and the RGs dCq was 1, the fold-change values for primer amplification efficiencies of 1.7–2.0 for each gene ranged from 2.46-fold-change to 4.71-fold-change (vs. 4-fold-change for ddCq assumed E values = 2). When RG dCq was 0.5, the range of fold-change values was smaller (2.66-fold-change to 4.34-fold-change). Overall, differences in primer amplification efficiencies have apparent influence on differential gene expression calculations, which may be particularly relevant when measuring smaller magnitude fold-changes.
To empirically test how empirical differences in primer amplification efficiencies affect fold-change calculations, an RT-qPCR dataset was generated for six genes (gad1b, glyt2, vglut2a, mpz, act1b, rpl13a) across seven timepoints in early zebrafish development (6, 12, 24, 48, 72, 96, and 120 hpf). These genes correspond to markers for different neuronal cell types (gad1b GABAergic neurons, glyt2 glycinergic neurons, vglut2a glutamatergic neurons, mpz oligodendrocytes) and validated RGs for zebrafish research (act1b, rpl13a).5,6 Primer amplification efficiencies were empirically measured using (1) a standard curve measurement of 10-fold serial dilutions of synthetic DNA oligonucleotide templates of the PCR targets and (2) the software program LinRegPCR measurement of the actual zebrafish samples; these methods yielded similar but not identical primer amplification efficiencies (Table 3).
Quantitative Reverse Transcription Polymerase Chain Reaction Primer Sequences and Calculated Primer Amplification Efficiencies for Measured Genes
Reference gene.
Fold-change values were calculated with reference to samples from the first time point (6 hpf) using act1b and rpl13a as RGs and then compared for the three methods of incorporating primer amplification efficiency into the calculations (ddCq vs. standard curve vs. LinRegPCR, Table 4). In comparison to the 6 hpf timepoint (control/reference sample), the statistical differences in gene expression across the seven timepoints for glyt2 (increased at 72, 96, and 120 hpf), vglut2a (increased at 72, 96, and 120 hpf), and mpz (increased at 96 and 120 hpf) were consistent between each primer amplification efficiency methodology (ANOVA, Tukey HSD p < 0.05; dark grey-filled cells). The statistical difference in gene expression for gad1b was consistent among methods (increased at 72, 96, and 120 hpf) apart from the ddCq calculation not showing increased expression at 72 hpf (ANOVA, Tukey HSD p < 0.05).
Gene Expression Differences of Neuronal Marker Genes Across Zebrafish Embryonic Development as Measured Using Different Primer Amplification Efficiency Calculations
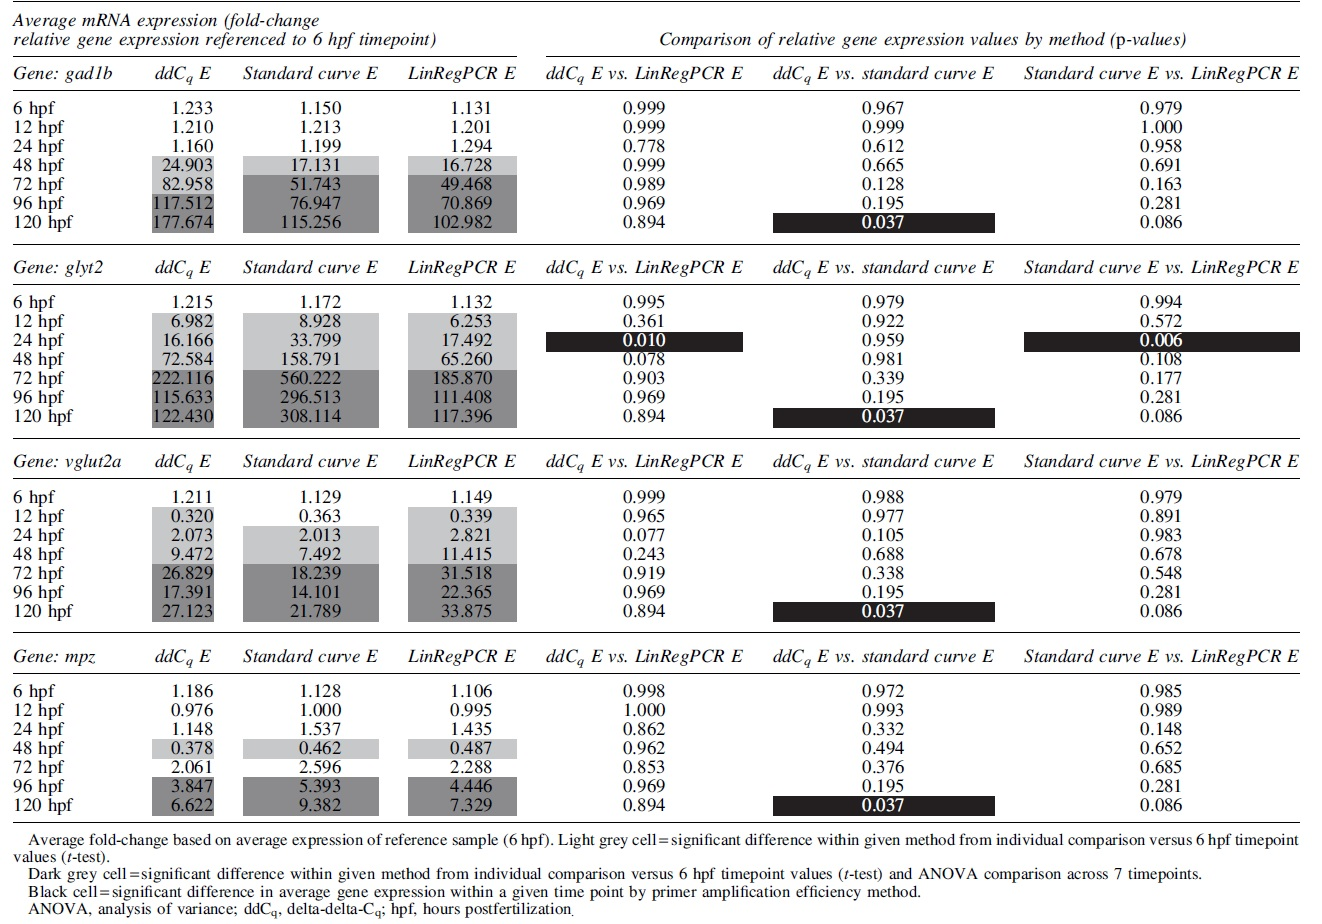
In addition to time course comparisons, many gene expression studies in zebrafish have been based on single comparisons of two experimental groups. When comparing gene expression values individually (e.g., 6 hpf vs. single other timepoint via t-test, test single timepoint comparison), there were consistent differences among the values derived from the three methods (left columns Table 4, light grey-filled cells). Differences between 6 hpf gene expression values and earlier time points were significantly different when compared individually than when compared as an entire time course (e.g., differential gene expression at 12 hpf/24 hpf/48 hpf via t-test vs. after 72 hpf in ANOVA).
In terms of comparing primer amplification efficiency method gene expression changes per gene per time point, there were few statistical differences in the magnitudes of the gene expression values (5/84 comparisons differed, right columns Table 4, black-filled cells). Overall, in almost every case for observed gene expression changes in this time course experiment, the primer amplification efficiency calculation method did not affect the statistical differences and overall interpretation of gene expression changes.
Discussion
We found that most recent publications involving RT-qPCR with zebrafish did not empirically account for primer amplification efficiencies in their analysis and assumed 100% efficiency using a ddCq approach (>90%, Fig. 1). However, analysis standards in clinical diagnostics using RT-qPCR recommend incorporating efficiency values for an accurate interpretation, 13 and empirically incorporating primer amplification efficiency is recommended as a field standard. 11 The methods section and Table 1 sample calculations show a directed approach to use empirically derived primer amplification values with multiple RGs for RT-qPCR analyses. There are different ways of measuring primer amplification efficiency, and software packages such as LinRegPCR allow for empirical measurements of efficiency in each RT-qPCR experiment.120–122
This approach allows empirical primer amplification efficiency values to be incorporated into RT-qPCR analysis without additional experiments (e.g., standard curves), making this approach similar to the simplicity of the prominent ddCq method. Notably, the original publication of the ddCq method encouraged the empirical measurement of primer amplification efficiency to be incorporated into associated equations. 14
Smaller gene expression changes (e.g., less than twofold, transition from absence/low expression to presence/high expression) may be influenced by primer amplification efficiency variability (Table 2). Variability of RG expression between groups also affects primer amplification efficiency influence on fold-change calculations. Although the same amount of sample is intended for each RT-qPCR, variation in RG expression will increase the impact of differences in primer amplification efficiency among target genes (Table 2). Using the geometric mean of multiple RGs helps control for outliers and abundance differences between RGs while increasing accuracy of RT-qPCR analysis. 2
Sample variability can also be limited by using a greater number of samples for analysis (e.g., n = 6 per group in this study; many studies use n = 3 per group). In addition, although the specific magnitude of fold-changes may vary, larger magnitude changes in gene expression measured by RT-qPCR are likely to be authentic results regardless of the primer amplification efficiency calculation methodology (Table 4).
The scale and experimental design of gene expression comparisons may also impact these statistical calculations. In comparing mRNA expression across a time course with large fold-changes (e.g., 10–100+-fold), variability of gene expression appeared to be the main influence for statistical comparison compared to variability of primer amplification efficiency (Table 4). Moreover, many RT-qPCR studies make comparisons between two groups (e.g., vehicle/control group vs. single time point). When comparisons were made between two groups instead of multiple groups (e.g., t-test of 6 hpf vs. another timepoint instead of ANOVA for the entire time course), the conclusions about differential expression per gene were similar; almost every instance of statistical difference was consistent across the three methods (83/84 comparisons consistent, Table 4). These results suggest that primer amplification efficiencies may not have a major impact on interpreting large gene expression changes, regardless of the experimental design and statistical approach.
In addition to primer amplification efficiency, there are other factors known to affect RT-qPCR data and analyses (e.g., sample storage conditions, RNA integrity, RNA purity, verification of invariant RG expression under specific experimental conditions). 11 Accounting for and reporting on these details can help increase accuracy and rigor for zebrafish gene expression studies.
In summary, we have demonstrated a streamlined analysis for incorporating primer amplification efficiencies into RT-qPCR analysis using multiple RGs (Table 1). Primer amplification efficiency can affect the magnitude of calculated gene expression differences in RT-qPCR analysis. Based on theoretical calculations of differential gene expression (Table 2), these differences may be biologically meaningful for small changes (e.g., <twofold) or for assessing the absence or presence of target gene expression (e.g., during zebrafish development). Based on the analysis of the presented gene expression profiles, functional interpretations of differential expression may not be substantially affected by using different methods of incorporating primer amplification efficiency, particularly for large gene expression changes that may be observed in different experimental contexts using zebrafish (e.g., adult vs. embryo, >10–100-fold changes, across developmental time course, Table 4).
Although primer amplification efficiency has not been included in most recent zebrafish RT-qPCR studies (Fig. 1), this factor can be easily incorporated into RT-qPCR analysis using publicly available software packages (e.g., LinRegPCR) to empirically measure primer amplification efficiency per sample without additional experimental measures (e.g., standard curves). The approach described in this report also includes simple calculations for incorporating multiple RGs into RT-qPCR analyses We encourage use of this approach and broader field standards for RT-qPCR (e.g., MIQE guidelines 11 ) to ensure high-quality reporting of RT-qPCR results in zebrafish gene expression studies.
Footnotes
Authors' Contributions
G.D.: Investigation, Formal Analysis, Visualization, Writing—Original Draft, and Writing—Review and Editing. B.H.: Methodology, Investigation, Formal Analysis, Visualization, and Writing—Review and Editing. C.D: Investigation and Writing—Review and Editing. E.V.: Investigation. B.C.: Conceptualization, Methodology, Formal Analysis, Visualization, Writing—Original Draft, Writing—Review and Editing, Supervision, Project Administration, and Funding Acquisition.
Disclosure Statement
The authors declare that they have no affiliations with or involvement in any organization or entity with any financial interest in the subject matter or materials discussed in this article.
Funding Information
Funding was provided by the UWEC Department of Biology, the UWEC Office of Research and Sponsored Programs (ORSP) and Blugold Commitment Differential Tuition, and the UWEC-Mayo Clinic Biomedical Innovator Program.