




Abstract
This study outlines a 2-week laboratory module for an authentic cell biology undergraduate research experience that uses zebrafish (Danio rerio), a popular model organism for research. Previous research has indicated that course-based undergraduate research experiences such as this one increase student confidence, active learning, and retention. During this research experience, students investigate variations in pigmentation in the caudal fins of wild type (WT) and transgenic fish [Tg(mitfa:GNAQQ209L)]. The transgenic fish express a hyperactive Gα protein, GNAQQ209L, under the melanocyte-specific mitfa promoter, offering insights into uveal melanoma, a common eye cancer. Students specifically analyze the black pigmented cells, melanophores, within the caudal fin. We determined that the transgenic zebrafish have increased pigmentation in their caudal fins, but smaller melanophores. These results suggest there are more melanophores in the Tg(mitfa:GNAQQ209L) fish compared to the WT. Future undergraduate research could investigate these cellular differences. This research experience imparts microscopy and image analysis skills and instills the ability to grapple with large datasets, statistical tests, and data interpretation in alignment with biology education principles. Post-laboratory surveys reveal students attain confidence in the above skills and in handling animals, along with a deeper appreciation for model organism research and its relevance to cancer cell biology.
Introduction
The zebrafish (Danio rerio) is a popular model organism not only in scientific research laboratories1–4 but also in undergraduate education settings,5,6 and for K-12 outreach.7–11 This small freshwater fish is used as a model across many subfields of biology and biomedical science, including cell biology, developmental biology, genetics, neuroscience, immunology, and cancer biology. 12 Zebrafish have been adopted by laboratories and schools worldwide because of their fast development, translucency during embryonic and larval stages, ease of genetic manipulation, and affordability to maintain in large numbers. 13
Students in the former sophomore-level course, Cell and Molecular Biology, and the current upper-level course, Advanced Cell Biology, at Carthage College (Kenosha, WI) use zebrafish to conduct authentic cancer and cell biology research during a 2-week laboratory module. The laboratory portion of the course meets for 3 h, once per week. This laboratory research experience introduces students to using a model organism for cell biology research, provides them with microscopy skills, and introduces them to analysis of microscopic images through the freely available image processing software, FIJI (fiji.sc).
Another major aspect of this laboratory involves grappling with the ambiguity of a large dataset. Data from all the students are compiled into one class dataset, and students must perform statistical tests to identify outliers, and calculate means, standard deviations, and p-values. Finally, students use their analyzed data to generate professional scientific figures and communicate their findings. These learning objectives are in line with the core concepts and competencies put forth by AAAS in their document, “Vision and Change in Undergraduate Biology Education: A Call to Action.” 14
Students meet the learning objectives of the laboratory by investigating differences in the area of pigmentation in zebrafish caudal fins and in the size (μm2) of individual pigmented cells within the caudal fin. Specifically, students in this laboratory investigate the black pigmented cells called melanophores. Melanophores are typically found in the skin of fish, reptiles, and amphibians, are responsible for coloration, and contribute to pattern formation. 15 They contain melanosomes, which are dispersive granules containing the pigment, melanin. Melanophores are similar to melanocytes, which are cells that are found in the epidermis of the skin and produce the black pigment, melanin. However, melanocytes can also be found in other organs such as the eyes.
In this laboratory, each student or pair of students analyzes pigmentation in the caudal fin in at least two different zebrafish backgrounds: wild type (WT) and transgenic [Tg(mitfa:GNAQQ209L)]. The transgenic fish used at Carthage College have a copy of the human GNAQQ209L gene (A Gα protein) under the control of the melanocyte-specific promoter, mitfa. GNAQ is normally expressed in melanophores in WT fish, but the human mutated version is also expressed in the transgenic fish.
Much of this laboratory experience at Carthage College discusses the role of the mutated hyperactive GNAQ protein in uveal melanoma and demonstrates how the zebrafish model organism is used for cancer research. The GNAQ gene codes for a G protein alpha (Gα) q subunit, which, when mutated to be hyperactive, leads to excess cell proliferation. This could be occurring due to the activation of phospholipase C, which is traditionally activated by Gα q subunits, 16 or through regulation of the Hippo signaling pathway, which has been reported to be activated downstream of GNAQ activation in malignancies. 17
Uveal melanoma is the most common eye cancer in humans with an estimated 1700 cases diagnosed yearly in the United States.18,19 Patients diagnosed with this disease typically undergo surgery or radiation for treatment. However, uveal melanoma is an aggressive cancer and the majority of patients develop untreatable metastatic disease in the liver. There is currently no treatment for this recurrent form of the disease. Activating point mutations in two genes, GNAQ and GNA11, are implicated in over 83% of patients with this disease. 20 However, the exact role of these two mutated and oncogenic Gα proteins needs further elucidation.
The zebrafish model organism is used to study uveal melanoma because zebrafish have similar genomes to humans, tumors develop quickly [i.e., within months when a driver mutation such as p53−/− is also present (tp53M214K/M214K)], 21 and they have similar eye anatomy. Through this laboratory research experience, students learn about the role of mutations in genes and how a hyperactive Gα subunit in a G protein interferes with downstream signaling pathways. In particular, the students investigate how the hyperactive Gα subunit alters cell size and overall pigmentation in the caudal fin of the zebrafish.
Of importance, this laboratory does not need to focus on cancer and lends itself quite easily to the analysis of cellular changes in other zebrafish pigmentation backgrounds, including the commonly available leopard, 22 jaguar, 23 panther, 24 and golden 25 zebrafish backgrounds.
Methods
Fish husbandry
WT (TAB5/14) 26 and transgenic Tg(mitfa:GNAQQ209L) 21 zebrafish were maintained according to standard operating procedures and guidelines.27,28 All zebrafish protocols were approved by the Institutional Animal Care and Use Committee at Carthage College. Each student completed CITI training before working with zebrafish and completed an Occupational and Health Safety form to gain approval for conducting research with zebrafish.
Anesthetization of zebrafish and caudal fin amputation
Adult zebrafish were individually anesthetized in 0.05% tricaine (MS-222) 0.0625% sodium bicarbonate, pH 7. Upon anesthetization, zebrafish were placed directly on a glass slide and their caudal fin was amputated using a clean scalpel. Each fish was returned to a clean tank with fresh aquarium water to recover from the surgery. The scalpel was used to spread out the caudal fin on the microscope slide. Excess solution was blotted off the slide with a Kimwipe. Cover slips were not placed on the slides as it was discovered that the bony rays in the caudal fin interfered with the imaging and depth of field when a cover slip was placed on top of the fin.
Microscopy to image melanophores
Amputated caudal fins were immediately imaged after surgery under a Nikon SMZ18 stereomicroscope. Magnifications ranging from 0.75 × to 13.5 × were used to capture at least one image of the entire caudal fin and at least one image showing melanophores within three different possible regions (dorsal, medial, or ventral) of the caudal fin at high magnification. Scale bars were added in NIS Elements software and images were captured with a DS-Ri2 color CMOS camera.
Quantitative image analysis
Students used FIJI (Fiji is Just Image J) freeware to perform two different types of image analysis. The scale bar for each image was set in FIJI and images were converted to 8-bit grayscale format. For the first analysis, students used the freehand selection tool to outline the entire caudal fin, and the measure and thresholding tools to calculate both the area of black pigmentation within the entire caudal fin and the overall area of the entire caudal fin. The percent of pigmentation within the overall fin was then calculated in Microsoft Excel.
For the second image analysis, students used FIJI to approximate the size of at least 10–15 individual melanophores within their magnified image of the caudal fin. Students used the freehand selection tool to separately circle individual melanophores within FIJI and again used the measure and threshold tools to calculate the area of black pigmentation (melanin) within the selection. These pigment dispersion measurements are a rough approximation of individual cell size since we did not use a membrane marker for the melanophores. These measurements assume that the melanin pigment is dispersed throughout the entire cell, which may not always be the case.
Statistical analysis and data presentation
Each student's image analysis data were compiled into a class data spreadsheet in Microsoft Excel for the second week of the laboratory. Students used a Grubb's test (free outlier calculator) from GraphPad (www.graphpad.com/quickcalcs/Grubbs1.cfm) to help them sort the data and remove outliers. Students were also encouraged to speak with each other during the laboratory to address potential outliers and to ask each other if a technical part of the analysis may have been performed incorrectly. Students then calculated the sample size, mean, standard deviation, and standard error of the mean for each dataset in Excel.
Students performed an unpaired t-test with the quick calculator from GraphPad (www.graphpad.com/quickcalcs/ttest1/?format=SD) to determine any difference between the mean pigmented area for each background of fish or the average area of pigment dispersion (an approximation of cell size) within the different backgrounds of fish. A p-value <0.05 was deemed statistically significant.
In the laboratory, students used Microsoft Excel to generate bar graphs of analyzed data. All graphs in this article were prepared with Prism 7.
Post-laboratory survey
Students were asked to complete an anonymous postlaboratory survey after completion of the second week of the laboratory. Students were informed that their participation in the survey was completely voluntary and would not affect their grade. This study was deemed exempt by the Carthage College Institutional Review Board.
Instructor notes
Instructors should be prepared to discuss several topics with the students at the start of laboratory and throughout this laboratory investigation. First, instructors should review G protein-coupled receptors and their downstream activation. This leads nicely into the discussion of the GNAQ gene, which codes for the alpha subunit of a G protein. Instructors can discuss the role of the point mutation in the hyperactivation of the Gα protein and its inability to hydrolyze GTP to GDP. This can provide an opportunity to compare oncogenes and tumor suppressors, if desired.
Subsequently, instructors should be prepared to lead the class on the generation of hypotheses. If the Gα protein is always active in melanophores in zebrafish or uveal melanocytes in humans, what effect might that have on these cells? Students typically propose that the cells will proliferate or divide more frequently, have a higher survival rate, grow in size, or migrate further distances away from or within the tissue of origin. Ideally, instructors should have the class come to a consensus on one shared hypothesis since the class will be working with the same shared data spreadsheet during week 2 of the laboratory for analysis. If the instructor wishes for groups of students to test different hypotheses, be aware that classroom management for week 2 of the laboratory may be more complex as groups of students may need to analyze the data in the spreadsheet differently.
Instructors can provide some background on the zebrafish model organism, its advantages, and limitations. They can discuss what a transgene is and how a transgenic model is made in zebrafish (e.g., through injection of DNA constructs into single cell embryos followed by screening and several rounds of mating the progeny). Instructors should also specifically address that the genotype of zebrafish used in this laboratory expresses the human GNAQQ209L gene under the control of the melanocyte-specific mitfa promoter. It is also helpful at this point to provide students with information about the three types of pigmented cells in zebrafish: iridophores (iridescent), xanthophores (yellow pigmented cells), and melanophores (black pigmented cells).15,29
Instructors can then ask students to work in small groups or pairs to design an experiment that will address one of the previously stated hypotheses and will utilize the zebrafish model organism. If following along with this article, the instructor should attempt to get the class to agree to doing an experiment that investigates the differences between pigmented area in Tg versus WT zebrafish and measuring the size of the melanophores (or the area of pigment dispersion within each individual melanophore) in Tg versus WT fish. These experiments will allow students to observe the direct effect of expression of GNAQQ209L in the melanophores. Specifically, the latter experiment allows them to address whether the GNAQQ209L transgene causes cells to grow in size.
In terms of classroom management, it works well for students to work in pairs. Each student in the pair gets to experience every part of the procedure–typically the students work side by side. One student completes the entire procedure for the WT fish and another student completes the procedure for the Tg fish. However, this laboratory is highly adaptable and has worked in the past with larger groups of 3–4 students or with students working independently. Instructors should choose the management strategies that work best for their classroom laboratory based on enrollment, available resources, and available time.
Instructors can help eliminate bias in the experimental design by assigning random numerical codes to the different genotypes of the zebrafish. Students will therefore not be aware which zebrafish they are analyzing until after analyzing the data. However, the WT (TAB5/14) and transgenic Tg(mitfa:GNAQQ209L) zebrafish used in this laboratory do have fairly obvious phenotypical differences, so the astute student may be able to figure out any attempt at blinding the genotypes. Alternatively, if the instructor chooses to not blind the genotypes, this allows the class to have a discussion about ways to eliminate bias during data analysis and come to a consensus on the best image analysis approaches.
Instructors can opt to have students directly image the (attached or unamputated) caudal fin, while the fish is under anesthesia. However, in our experience, it is technically difficult for students to quickly image the zebrafish on the stereoscope while the fish is under anesthesia. The fish is at risk of being euthanized if left in the anesthesia for too long during microscopy. For that reason, we recommend students amputate the caudal fin of the zebrafish for separate imaging. This ensures the student has ample time to capture images of the caudal fin under the stereoscope without worrying about the fish waking up (or being euthanized) from the anesthesia, while on the stereoscope stage. The fish can instead be recovering from anesthesia in their aquarium tank, while the caudal fin imaging is occurring.
Instructors should be aware that exposure to light can increase the amount of melanosome contraction and make the melanophores appear smaller. While this is difficult to control in an undergraduate laboratory setting, if possible, the instructor could help students image their caudal fins in a timely manner so that the caudal fins are not exposed to the light on the stereoscope for a long duration. Alternatively, the instructor could help students design a follow-up experiment to test the effect of light (or dark) exposure on pigmentation.
The second week of the laboratory does not have a specific laboratory manual as students work directly with the data in the spreadsheet. Between the first and second week of the laboratory, students are asked to upload their completed individual spreadsheets (i.e., the provided template data entry spreadsheet at https://drive.google.com/drive/u/1/folders/1JY87epsk2RwWRHr69cLLVkXDIqEr3hp1) into a google drive folder. The day before the second laboratory, the instructor (or teaching assistants, if available) should compile each student's data into one shared spreadsheet using the same format as in the template spreadsheet. During the second laboratory, the students are instructed to bring their computers to the laboratory and use the data in the class spreadsheet to calculate the following for each genotype: average area of pigmentation, average cell size, standard deviation, and standard error of the mean.
The instructor should be prepared to guide the students through the data analysis. This often means discussing how to identify outliers using the Grubb's test (available on the GraphPad website) and how to enter formulas in Microsoft Excel to calculate sample size (n), average, standard deviation, and standard error of the mean. Instructors can also use this data analysis laboratory to introduce p-values and statistical tests, and to lead the students through performing a t-test with the quick calculator on the GraphPad website. If there is time remaining during the laboratory, the instructor can demonstrate how to make scientific figures (i.e., bar graphs for these datasets) in Excel and how to add error bars representing the calculated standard deviations.
A copy of the laboratory manual is available in the Supplementary Data.
Results and Discussion
GNAQ is a known oncogene associated with uveal melanoma. Therefore, we asked whether its expression in melanophores results in changes in pigmentation in adult zebrafish. As expected, adult Tg(mitfa:GNAQQ209L) fish (Tg) display significantly increased pigmentation in their caudal fins compared to their WT clutchmate controls (Fig. 1). The percent of pigmentation across the entire caudal fin is increased (Fig. 2). These findings corroborate a previous study, 21 which found increased pigmentation in these transgenic fish at the embryonic stage.
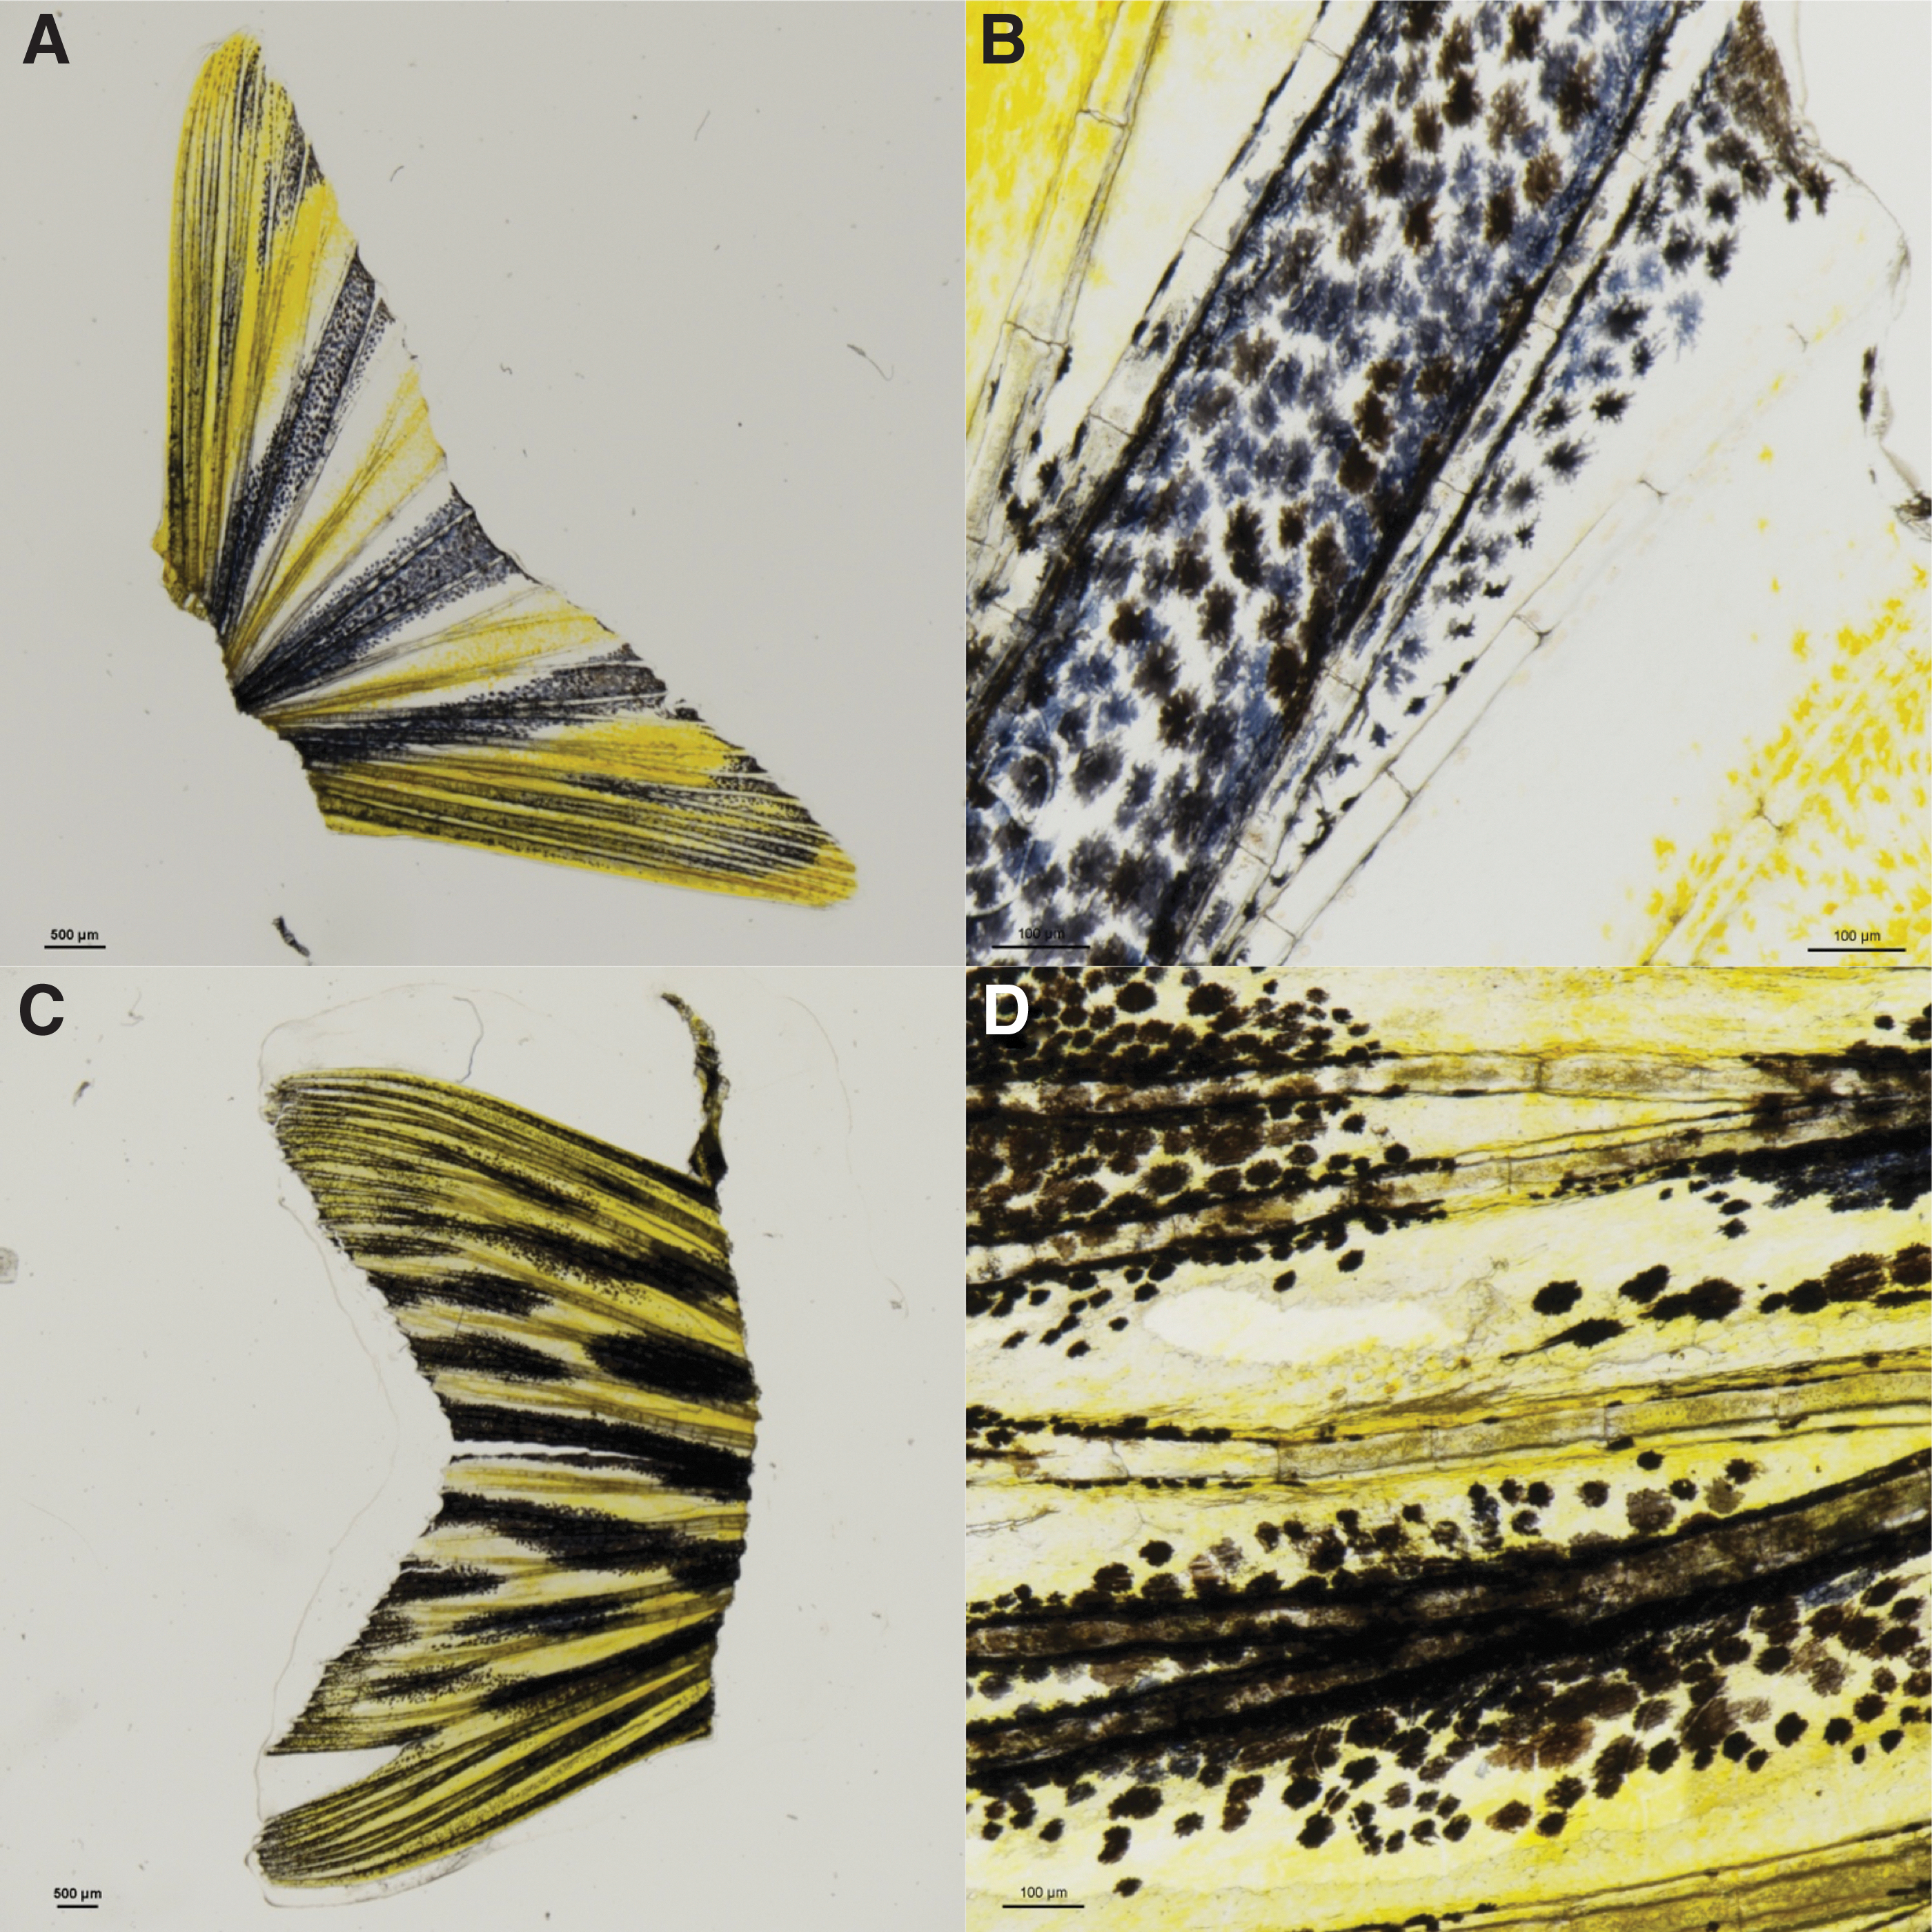
Pigmented cells (melanophores) in the caudal fins of adult WT versus transgenic [Tg(mitfa:GNAQQ209L)] (Tg) zebrafish.
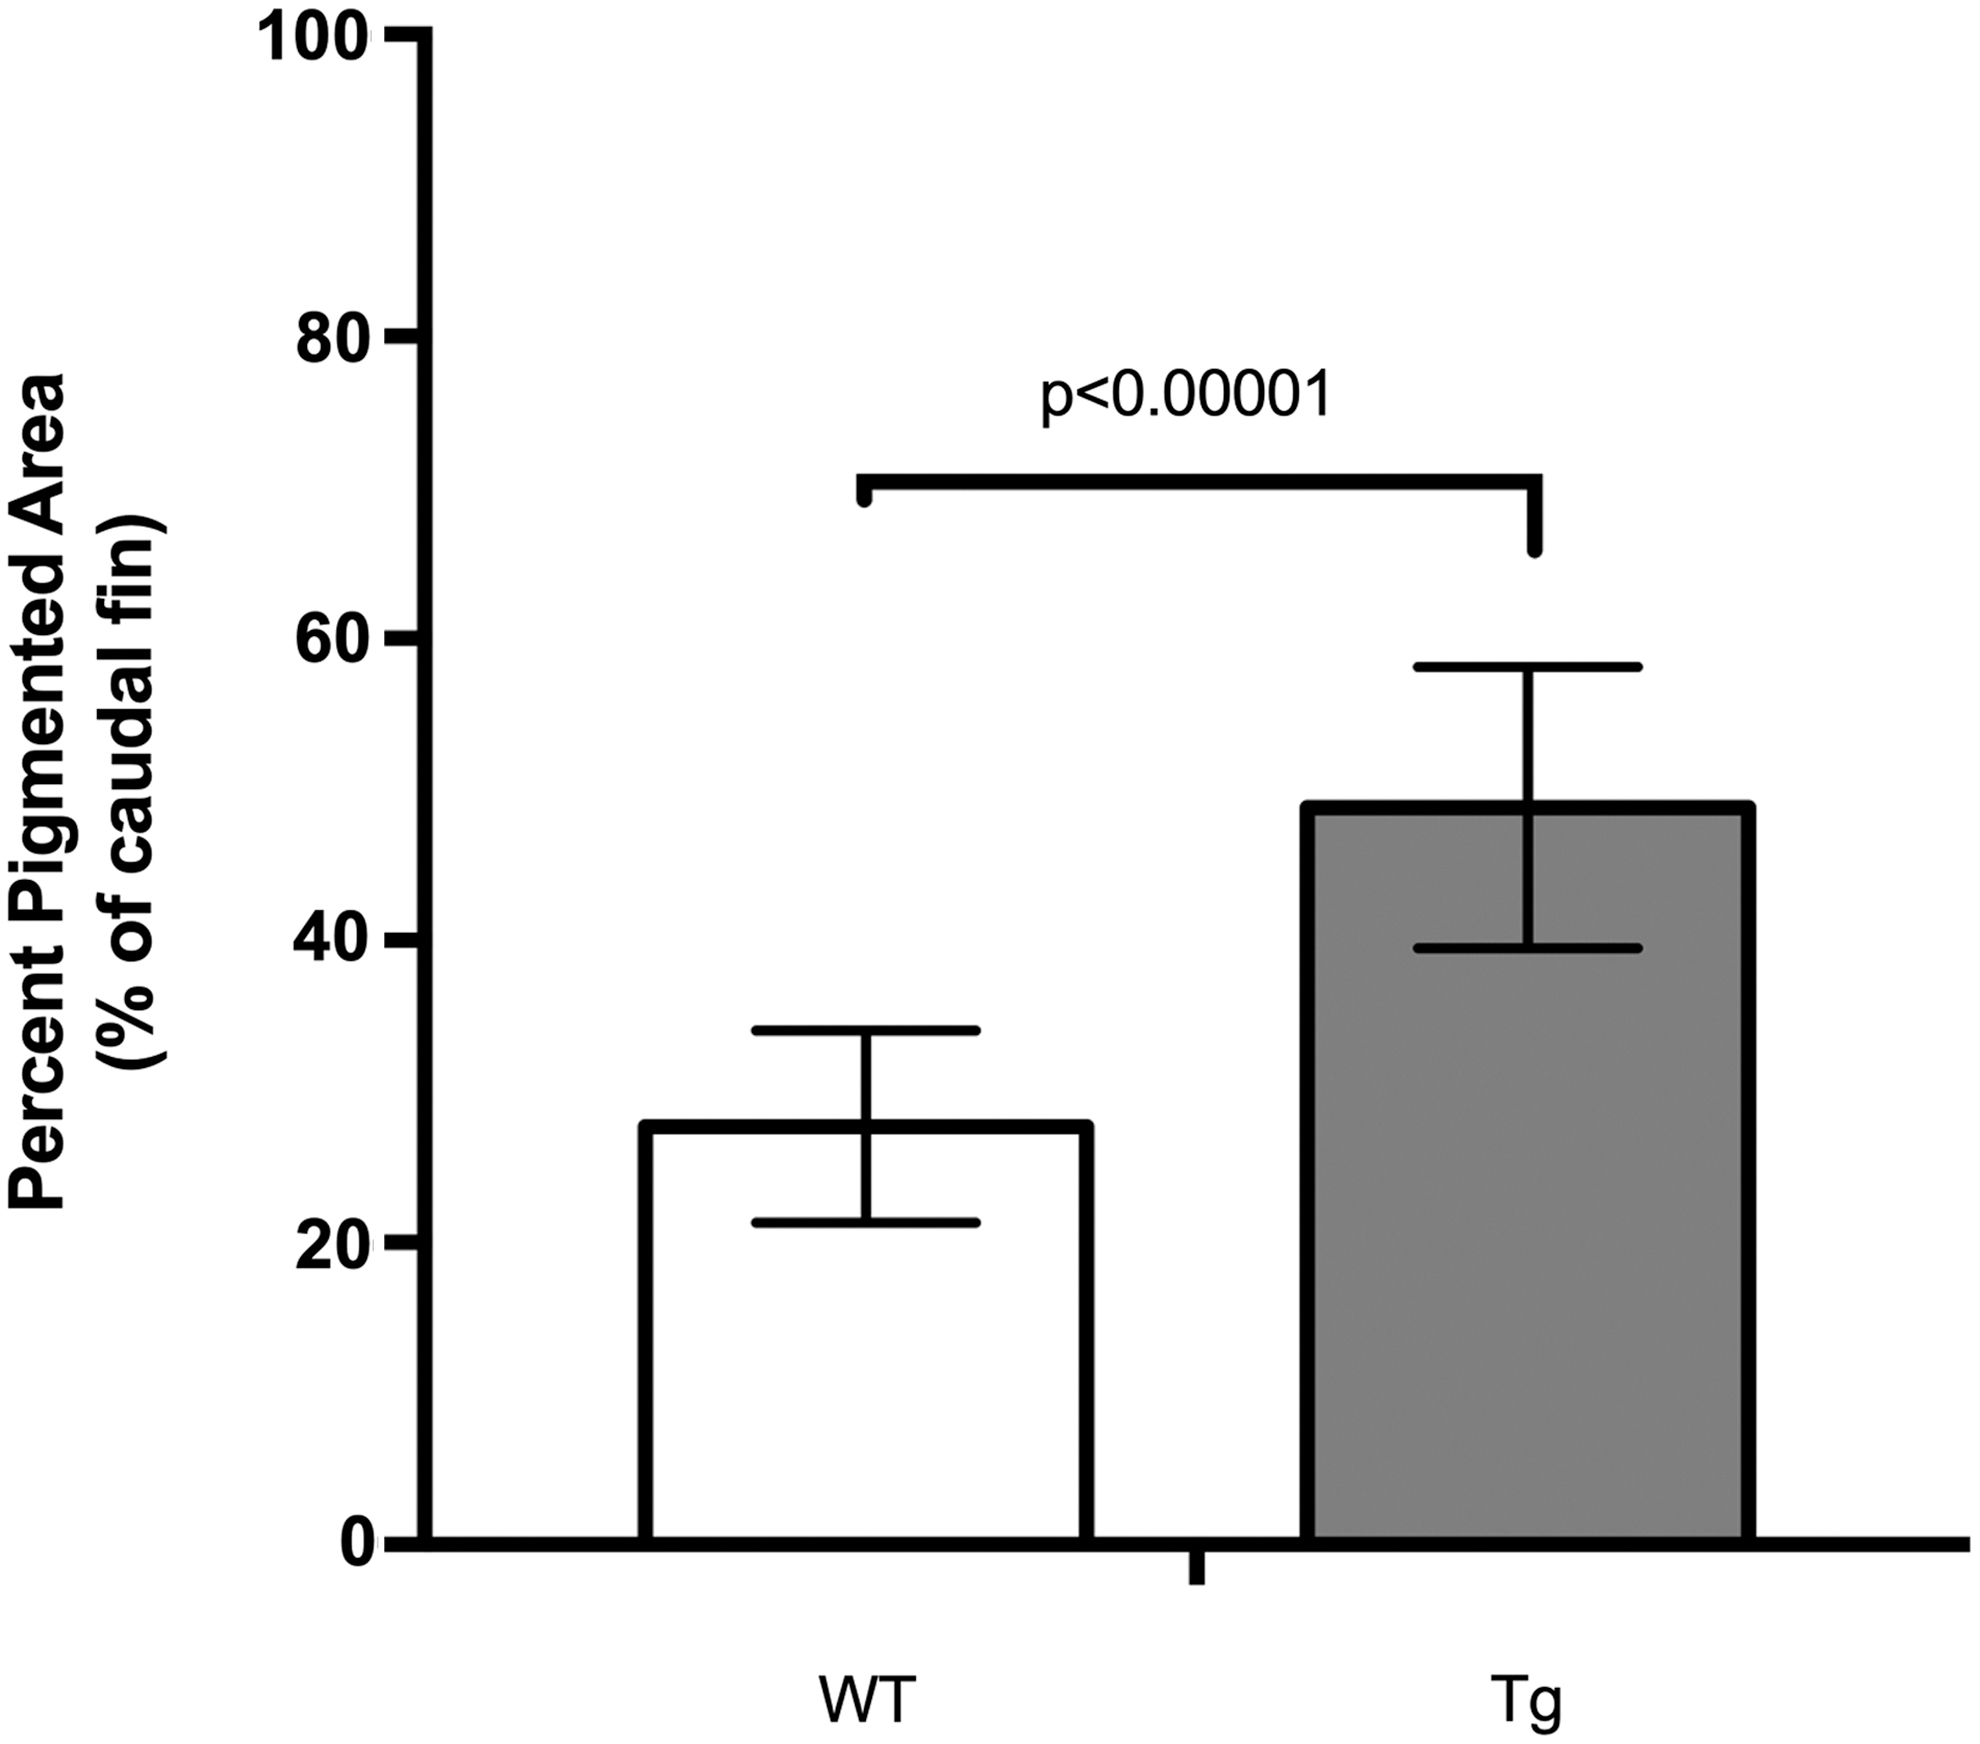
Average percent pigmentation in the caudal fins of adult WT and Tg zebrafish. Images of caudal fins of adult zebrafish were captured on a Nikon SMZ18 stereoscope. Image pigmentation was analyzed using FIJI. An unpaired t-test was performed for statistical analysis on GraphPad Prism. The p-value is reported for comparison between WT and transgenic caudal fin pigmentation. Nineteen WT fish and 19 transgenic fish were analyzed. Error bars represent standard deviation.
We next sought to address whether the observed change in the area of pigmentation was due to a change in the average size of the melanophores. We determined that the melanophores in the caudal fins of the Tg fish are smaller than those in the clutchmate WT control fish (Figs. 1 and 3), with an average melanophore cell size of 541 μm2 for Tg and 746 μm2 for WT (Fig. 3).
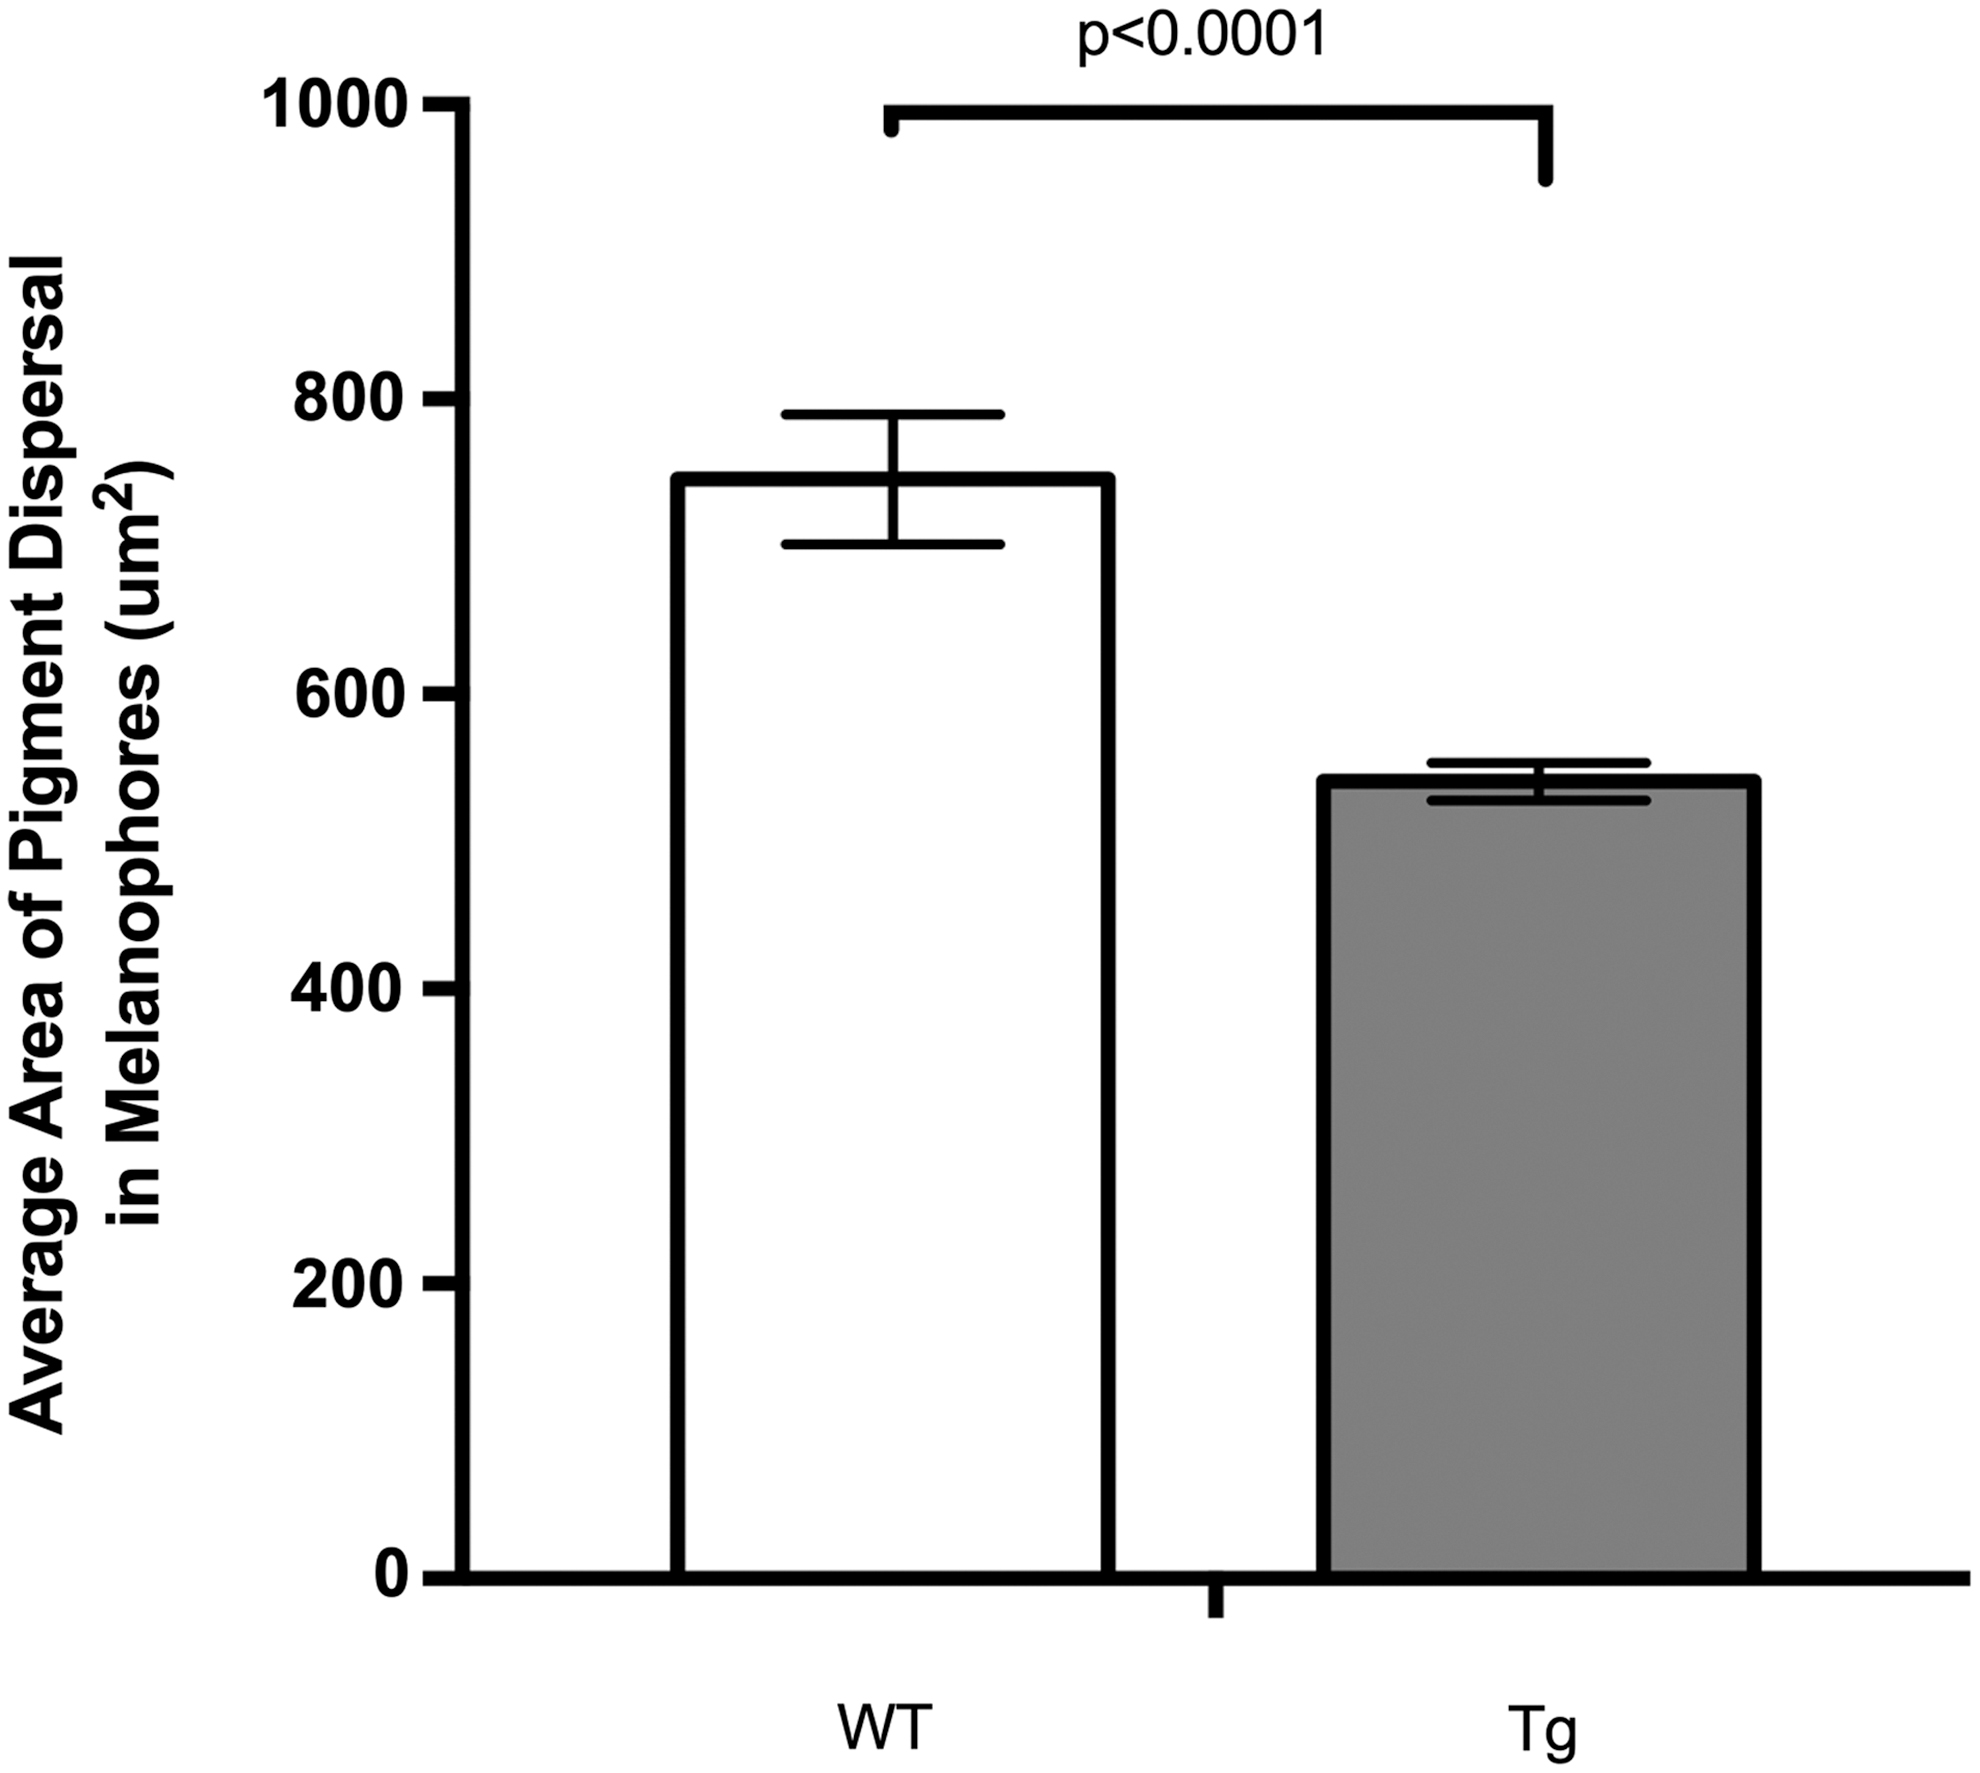
Average area of pigment dispersal (an approximation of cell size) in melanophores in the caudal fins of adult WT and Tg zebrafish. Images of caudal fins of adult zebrafish were captured on a Nikon SMZ18 stereoscope. Image pigmentation was analyzed using FIJI. An unpaired t-test was performed for statistical analysis on GraphPad Prism. The p-value is reported for comparison between the cell sizes from WT and transgenic caudal fin pigmentation. Two hundred four cells were analyzed from WT fish and 387 cells from transgenic fish. Error bars represent standard error of the mean.
Since the Tg fish have increased overall pigmentation, these results imply that there may be a higher number of these smaller melanophores present in the Tg fish, either due to increased proliferation or increased survival, or both. Students could address this as a next step by quantifying the number of melanophores present in Tg versus WT fish within a certain area of the caudal fin in their light microscopy images, or by monitoring the proliferation of melanophores in Tg versus WT using timelapse microscopy. There are certainly multiple avenues of research that could be further pursued in the undergraduate laboratory classroom or during an undergraduate research experience following this 2-week laboratory experience.
A post-laboratory survey was administered to all students to assess their confidence levels around the learning objectives of this laboratory (Table 1). Students reported the highest confidence (Likert score 4.63/5) in their ability to use FIJI software to do basic analyses of microscopic images (cell size, area, etc.). Importantly, at Carthage College, this class provides biology students with their first encounter with FIJI and any type of biological image analysis.
Post-laboratory Survey Results of Student Confidence for Each Learning Objective and Written Student Feedback
Data were collected across two semesters of Cell and Molecular Biology at Carthage College (n = 27). Prompts were based on a 5-point Likert scale, where 1 = strongly disagree, 2 = disagree, 3 = neutral, 4 = agree, and 5 = strongly agree, or, 1 = (confidence) strongly decreased, 2 = decreased, 3 = stayed the same, 4 = increased, and 5 = strongly increased. Selected student feedback from the open response prompt within the survey are shown.
The results of this postlaboratory survey indicate that students feel quite confident in this type of analysis after this laboratory, even if this was the first time they encountered this analysis. Their confidence levels may be, in part, due to the repetitive nature of the image analysis portion of this laboratory. Students are instructed to measure the overall pigmentation in zebrafish at least twice and the calculate cell size measurements for at least 10–15 different cells within each genotype of fish. Practice makes perfect!
Students also agreed (Likert score 4.52/5) that this laboratory helped them see the ambiguity (uncertainty) scientists can face when analyzing large datasets. Again, this was one of the first classes that Carthage biology students encountered, which asked them to work with and analyze class datasets comprising hundreds of data points. Students sometimes found this experience frustrating, particularly when determining outliers in the large dataset and performing statistical tests. These frustrations were reflected in the postlaboratory survey too, on the question assessing their confidence in doing basic statistical analyses for presenting data in figures (Likert score 3.85/5). For many of the students, this was their first time performing a t-test in their biology coursework and the first time they were asked to prepare formal scientific figures using Microsoft Excel.
Instructors can help ease student anxiety and frustrations by emphasizing that this is a normal part of the scientific process and that professional scientists encounter these difficulties regularly. As a solution to these challenges, instructors can ask their students to discuss their approaches to handling large datasets and statistical tests together as a class, to see if everyone can come to a consensus for analyzing the data using the same consistent methods.
In addition, this laboratory helped students feel confident in using microscopes (Likert score 4.15/5) and handling research animals (Likert score 4.11/5), and to improve their understanding of how model organisms are used in research (Likert score 4.41/5) (Table 1). All these skills are beneficial for any biology student hoping to attain a research career after graduation. This 2-week laboratory module provides students with an introduction to these important skills in the context of an authentic research experience.
The written student feedback (Table 1) from the postlaboratory surveys was generally positive and emphasized several key features or themes of this laboratory experience:
Future applications of this research to their careers or additional research studies, while in their undergraduate education New skills gained in technical analysis of data and in the use of the software FIJI Gratitude for doing modern cell biology research and authentic research that has no known answer Appreciation for zebrafish or other model organisms, and how model organism research can help us better understand biological processes occurring in diseases such as cancer.
While only some of the student feedback has been selected for this article, the general themes and comments have remained consistent across nine semesters of this laboratory experience and over 250 undergraduate biology students.
In conclusion, this 2-week laboratory experience provides undergraduate students with the opportunity to conduct authentic research during a cell biology course. It is in line with the recommended best practices for teaching the scientific process and engaging students in the classroom through active learning.14,30–32 This laboratory is also readily adaptable to other courses in biology (such as cancer biology or developmental biology) and to other genotypes of zebrafish that an instructor has access to at their institutions. Of importance, particularly for smaller teaching-focused institutions with zebrafish, this laboratory can be offered with minimal financial investment in terms of necessary reagents or supplies. Students clearly benefit from this research experience, as evident by their increased confidence for conducting research in the laboratory and the attainment of new laboratory and data analysis skills.
Footnotes
Acknowledgments
The author thanks the hundreds of students who have taken Cell and Molecular Biology or Advanced Cell Biology at Carthage College over the past 8 years and have provided valuable feedback on this laboratory experience. Your questions and curiosity are inspiring!
Disclosure Statement
No competing financial interests exist.
Funding Information
No funding was received for this project.

References
Supplementary Material
Please find the following supplemental material available below.
For Open Access articles published under a Creative Commons License, all supplemental material carries the same license as the article it is associated with.
For non-Open Access articles published, all supplemental material carries a non-exclusive license, and permission requests for re-use of supplemental material or any part of supplemental material shall be sent directly to the copyright owner as specified in the copyright notice associated with the article.
