




Abstract
Xenotransplantation of neuroblastoma cells into larval zebrafish allows the characterization of their in vivo tumorigenic abilities and high-throughput treatment screening. This established preclinical model traditionally relies on microinjection into the yolk or perivitelline space, leaving the engraftment ability of cells at the hindbrain ventricle (HBV) and pericardial space (PCS), sites valuable for evaluating metastasis, angiogenesis, and the brain microenvironment, unknown. To address this gap in knowledge, Casper zebrafish at 48 h postfertilization were microinjected with approximately 200 Kelly, Be(2)-C, SK-N-AS, or SY5Y cells into either the HBV or PCS. Fish were imaged at 1, 3, and 6 days postinjection and tumor growth was monitored at each timepoint. We hypothesized that engraftment ability and location preference would be cell line dependent. Kelly and SK-N-AS cells were able to engraft at both the HBV and PCS, with a near doubling in size of tumor volume during the 6 days observation period, with cells appearing to grow better in the HBV. Be(2)-C tumors remained static while SY5Y tumors decreased in size, with almost complete loss of volume at both sites. Therefore, the capability of neuroblastoma cell engraftment in zebrafish larvae is cell line dependent with a location preference.
Introduction
Neuroblastoma is a neoplasia of the sympathetic nervous system and the most common solid extracranial tumor in children, accounting for ∼8%–10% of childhood tumors and 15% of childhood cancer deaths. 1 A stark difference in survival rates exists between patients with low and high-risk tumors, and despite improving survival rates due to novel multimodal therapies, survival of high-risk patients remains low, stressing the need for ongoing research.1,2
Zebrafish have emerged as a promising preclinical model in oncology research due to their fecundity, external fertilization, and conserved response to chemotherapeutics compared with humans.3–5 Tumor induction in fish can occur through chemical mutagenesis, development of transgenic lines, or xenotransplantation of cancer cell lines or patient-derived cells.3,4 Xenotransplantation of tumor cell lines rapidly produces a large number of fish with a controlled volume of tumor cells at a select site, enabling in vivo, real time tracking of fluorescently labeled cells and mass screening of anti-cancer therapeutics.3,4 Patient-derived xenografts can similarly be used to develop individualized zebrafish “avatars” that can be used to develop personalized cancer treatments.5–7 Because zebrafish xenograft models promise innovative treatments, developing the ideal protocol for zebrafish xenograft models is critical for ongoing drug development and ensuring translatable results.
Zebrafish xenograft models use multiple neuroblastoma cell lines and microinjection locations, but the ability of select cell lines to engraft at less common microinjection locations is unknown. Larval fish used in oncology studies are traditionally injected at 48 h postfertilization (hpf) in the nutrient-rich environment of the yolk or the superficial perivitelline space (PVS), but microinjection has been successfully performed in other structures.5,8–10 Among these less commonly injected sites, the pericardial space (PCS) is typically selected for metastasis and angiogenesis studies, and the hindbrain ventricle (HBV) allows evaluation of tumor cell characteristics in the brain microenvironment. 10 While specific neuroblastoma cell lines can engraft in various sites in the larval zebrafish, the engraftment ability and site preference in the HBV or PCS remains to be defined.10–12 Without defined engraftment characteristics and location preferences in these uncommon locations, time, economic, and animal resources are wasted in troubleshooting the combination of cell line and location in developing a preclinical zebrafish model.
The HBV and PCS were selected as injection locations due to their distinct borders and ease of access. As already discussed, the HBV and PCS offer unique advantages in terms of studying metastasis, angiogenesis, and brain microenvironment in larval zebrafish. In addition to these academic factors, both sites also offer a practical advantage as discrete and confined sites. Injection of cells into defined cavities is advantageous for tumor monitoring and treatment evaluation, as spread of cells systemically through the blood stream makes identifying, evaluating, and tracking change in tumor size more difficult than at a single, static location. Additionally, these sites are attractive for novice technicians due to their relatively large size and optic clarity, allowing easy access and immediate evaluation of injection success via visual confirmation.
We chose four neuroblastoma cell lines for study, Kelly, Be(2)-C, SY5Y, and SK-N-AS, which possess a unique combination of three indicators of tumor aggressiveness: MYCN amplification, mesenchymal (MES) vs. adrenergic (ADRN) state, and LMO1 expression. Amplification of the MYCN oncogene plays a key role in neuroblastoma tumor staging and is associated with high-risk, poor prognostic tumors that are resistant to treatment.13,14 Lineage-committed ADRN or an immature MES state play a critical role in tumor behavior, with cell lines in the immature, treatment-resistance mesenchymal state acting more aggressively than those of the differentiated adrenergic lineage. 15 Of those cells with a more ADRN state, high expression of the LMO1 oncogene leads to accelerated tumorigenesis and metastasis with a significantly increased penetrance in collaboration with MYCN.15–17
To investigate neuroblastoma cell engraftment ability and location preference, Casper zebrafish at 48 hpf were microinjected with approximately 200 cells from one of four fluorescently-labeled cell lines at either the HBV or PCS. Fish were imaged via compound microscope at 1, 3, and 6 days postinjection (DPI), and tumor volume was calculated at each timepoint. Change in tumor volume was compared between groups to evaluate engraftment ability at each site and determine site preference.
Materials and Methods
Generation of embryos
Experiments were performed in compliance with Mayo Clinic IACUC-approved protocol A00004637 and the Guide for the Care and Use of Laboratory Animals. Mature Casper zebrafish were maintained in a recirculating system at 28.5°C on a 14 h light/10 h dark cycle. The pH and conductivity of the water was maintained between 7.2–7.6 and 600–800 µS/cm, respectively. Embryos were collected from spawning adults and incubated at 28.5°C for the first 48 hpf. For detailed information, refer to Supplementary Data S1.
Cell line culture and preparation for microinjection
Kelly, Be(2)-C, SY5Y, and SK-N-AS cell lines were purchased (ATCC and Sigma–Aldrich) and labeled with either mCherry or green-fluorescent protein via a lentiviral transduction. SY5Y cells were cultured in DMEM or DMEM/F12 supplemented with 10% FBS and 1% penicillin and streptomycin for Kelly and Be(2)-C, SK-N-AS, and SY5Y, respectively (Gibco, Thermo Fisher). Cells were maintained at 37°C and 5% CO2 until they reached approximately 70% confluence and cell number was determined via automated hemocytometer (Thermo Fisher). Cells were concentrated to approximately 60 cells/nL in PBS with 10% FBS for injection. Cells were routinely PCR tested for Mycoplasma contamination and positive groups were removed from study.
Microinjection
At 48 hpf, embryos were removed from the chorion as needed with 10 mg/mL pronase, anesthetized with 168 mg/L tricaine, and aligned in a grooved 3% agarose microinjection plate. Microinjection was performed using a pico-liter injector (Warner Instruments) and borosilicate capillary needles calibrated using mineral oil and a micrometer. Approximately 200 neuroblastoma cells in 3.5 nL were injected into the HBV or PCS as outlined in Supplementary Figure S1. Following microinjection, larvae were evaluated under fluorescent compound microscope and those with evidence of poor viability, systemic cell spread, or subjectively poor cell uptake were euthanized. The remaining fish were stepwise acclimated over 24 h to a maintenance temperature of 32°C.
Imaging
On 1, 3, and 6 DPI fish were anesthetized with 168 mg/L tricaine, placed onto a drop of 3% methylcellulose on a microscope slide, and evaluated under compound microscope. Images were taken using bright field and the appropriate fluorescent channels at 100 × magnification with a uniform exposure time. A single, non-blinded individual was responsible for all image collection. Following imaging, fish were removed from the methylcellulose, rinsed, then transferred to a 24-well plate.
Maintenance and euthanasia
Fish were maintained in 24-well plates at a density of one fish per well from 3–8 days post fertilization (DPF) in embryo water produced per Cold Spring Harbor protocol. 18 Partial water changes with debris removal were performed every 24–48 h. Fish were fasted to prevent poor water quality due to the generation of ammonia. 19 Fish euthanized before 6 DPI were euthanized via dilute sodium hypochlorite. Fish euthanized after 6 DPI were euthanized via immersion in an ice bath.
Image analysis
Fluorescent images were evaluated in ImageJ. The Otsu threshold was applied to each image to obtain the area of fluorescence and mean fluorescent intensity. As needed, fluorescence that occurred outside the injection location due to auto-fluorescence was excluded. The area of fluorescence and mean fluorescence intensity for each image were multiplied to create a value approximating the total tumor volume. 20 Fish served as their own control, with the resulting values on 3 and 6 DPI communicated as a magnitude of change compared with 1 DPI, with tumor volume on Day 1 normalized to 1. Values for each individual fish and median values are plotted in Supplementary Figure S2.
Replicates and exclusion criteria
At least three replicates were performed for each group. Fish with severe pericardial edema or those that died or were euthanized before 6 DPI were excluded from statistical analysis. Additional replicates were performed as needed for at least 35 fish per group.
Statistical analysis
A total of 408 fish were analyzed over eight groups. Analyses were carried out using GraphPad Prism. Median and interquartile ranges were determined for each subgroup and group. Distribution of each group’s data was evaluated using the Shapiro–Wilk test. If the unpaired data were normally distributed, an independent t-test was applied, otherwise the Mann–Whitney test was utilized. Normally distributed paired data were compared by a paired t-test, Wilcoxon signed-rank test was performed if data were not normally distributed. To determine the relative differences among different cell lines at the same site, normality was evaluated as previously described. If the data did not have a normal distribution, the Kruskal–Wallis test was performed to compare more than two groups.
Results
In this article, we injected approximately 200 cells of the aforementioned neuroblastoma lines into either the HBV or PCS of Casper fish at 48 hpf. Each cell line reflected a unique combination of MYCN amplification, ADRN-MES lineage, and LMO1 levels, as outlined in Supplementary Table S1. Lateral view fluorescent images of tumors were captured at 1, 3, and 6 DPI. The change in tumor volume was quantified for each cell line and location on 3 DPI and 6 DPI, normalized to tumor volume on 1 DPI. Change in tumor volume was evaluated within each cell line and location to determine engraftment potential and location preference. Representative fluorescent images for each cell line and location combination are presented in Supplementary Table S2.
Kelly cell line
A visual increase in Kelly tumor size was appreciated via imaging at 3 and 6 DPI as compared with 1 DPI (Fig. 1A). A statistically significant increase in tumor volume change was calculated at both timepoints, with a 1.89 and 1.96-fold change in median tumor volume appreciated on 3 and 6 DPI as compared with 1 DPI, respectively (Fig. 1B). Cells implanted in the PCS similarly increased in volume visually (Fig. 1C), with a 1.46 and 1.83-fold change appreciated on 3 and 6 DPI, respectively (Fig. 1D). Comparing the two sites, a significant difference (p < 0.001) in magnitude of tumor volume change was appreciated at 3 DPI, where the median magnitude of change was lower for tumors in the PCS than the HBV (Fig. 1E). This location impact disappeared by 6 DPI, at which point no statistically significant difference existed between the injection locations (Fig. 1E). Therefore, our data suggests that Kelly neuroblastoma cells can successfully engraft in the HBV and PCS, with an initial location preference for the HBV.

Kelly cells successfully engraft in the HBV and PCS of 48 hpf zebrafish, with an initial location preference appreciated for the HBV.
Be(2)-C cell line
Be(2)-C cells microinjected into the HBV remain static in size, while tumor volume dropped notably in the PCS. Visual inspection of HBV-injected cells demonstrated an apparent static to slight decline in tumor size through 6 DPI (Fig. 2A). The calculated magnitude of change at 3 and 6 DPI revealed a nearly static size, with a 0.99-fold change at 3 DPI and a 0.88-fold change at 6 DPI compared with 1 DPI (Fig. 2B). In contrast, Be(2)-C tumor volume decline was visually apparent following PCS injection starting at 3 DPI (Fig. 2C), with a 0.89 and 0.72-fold change at 3 and 6 DPI, respectively (Fig. 1D). At both time points, a significant difference was appreciated between injection location (p < 0.02 at 3 DPI; p < 0.001 at 6 DPI), with tumor volume dropping more precipitously in the PCS than the HBV (Fig. 2E).
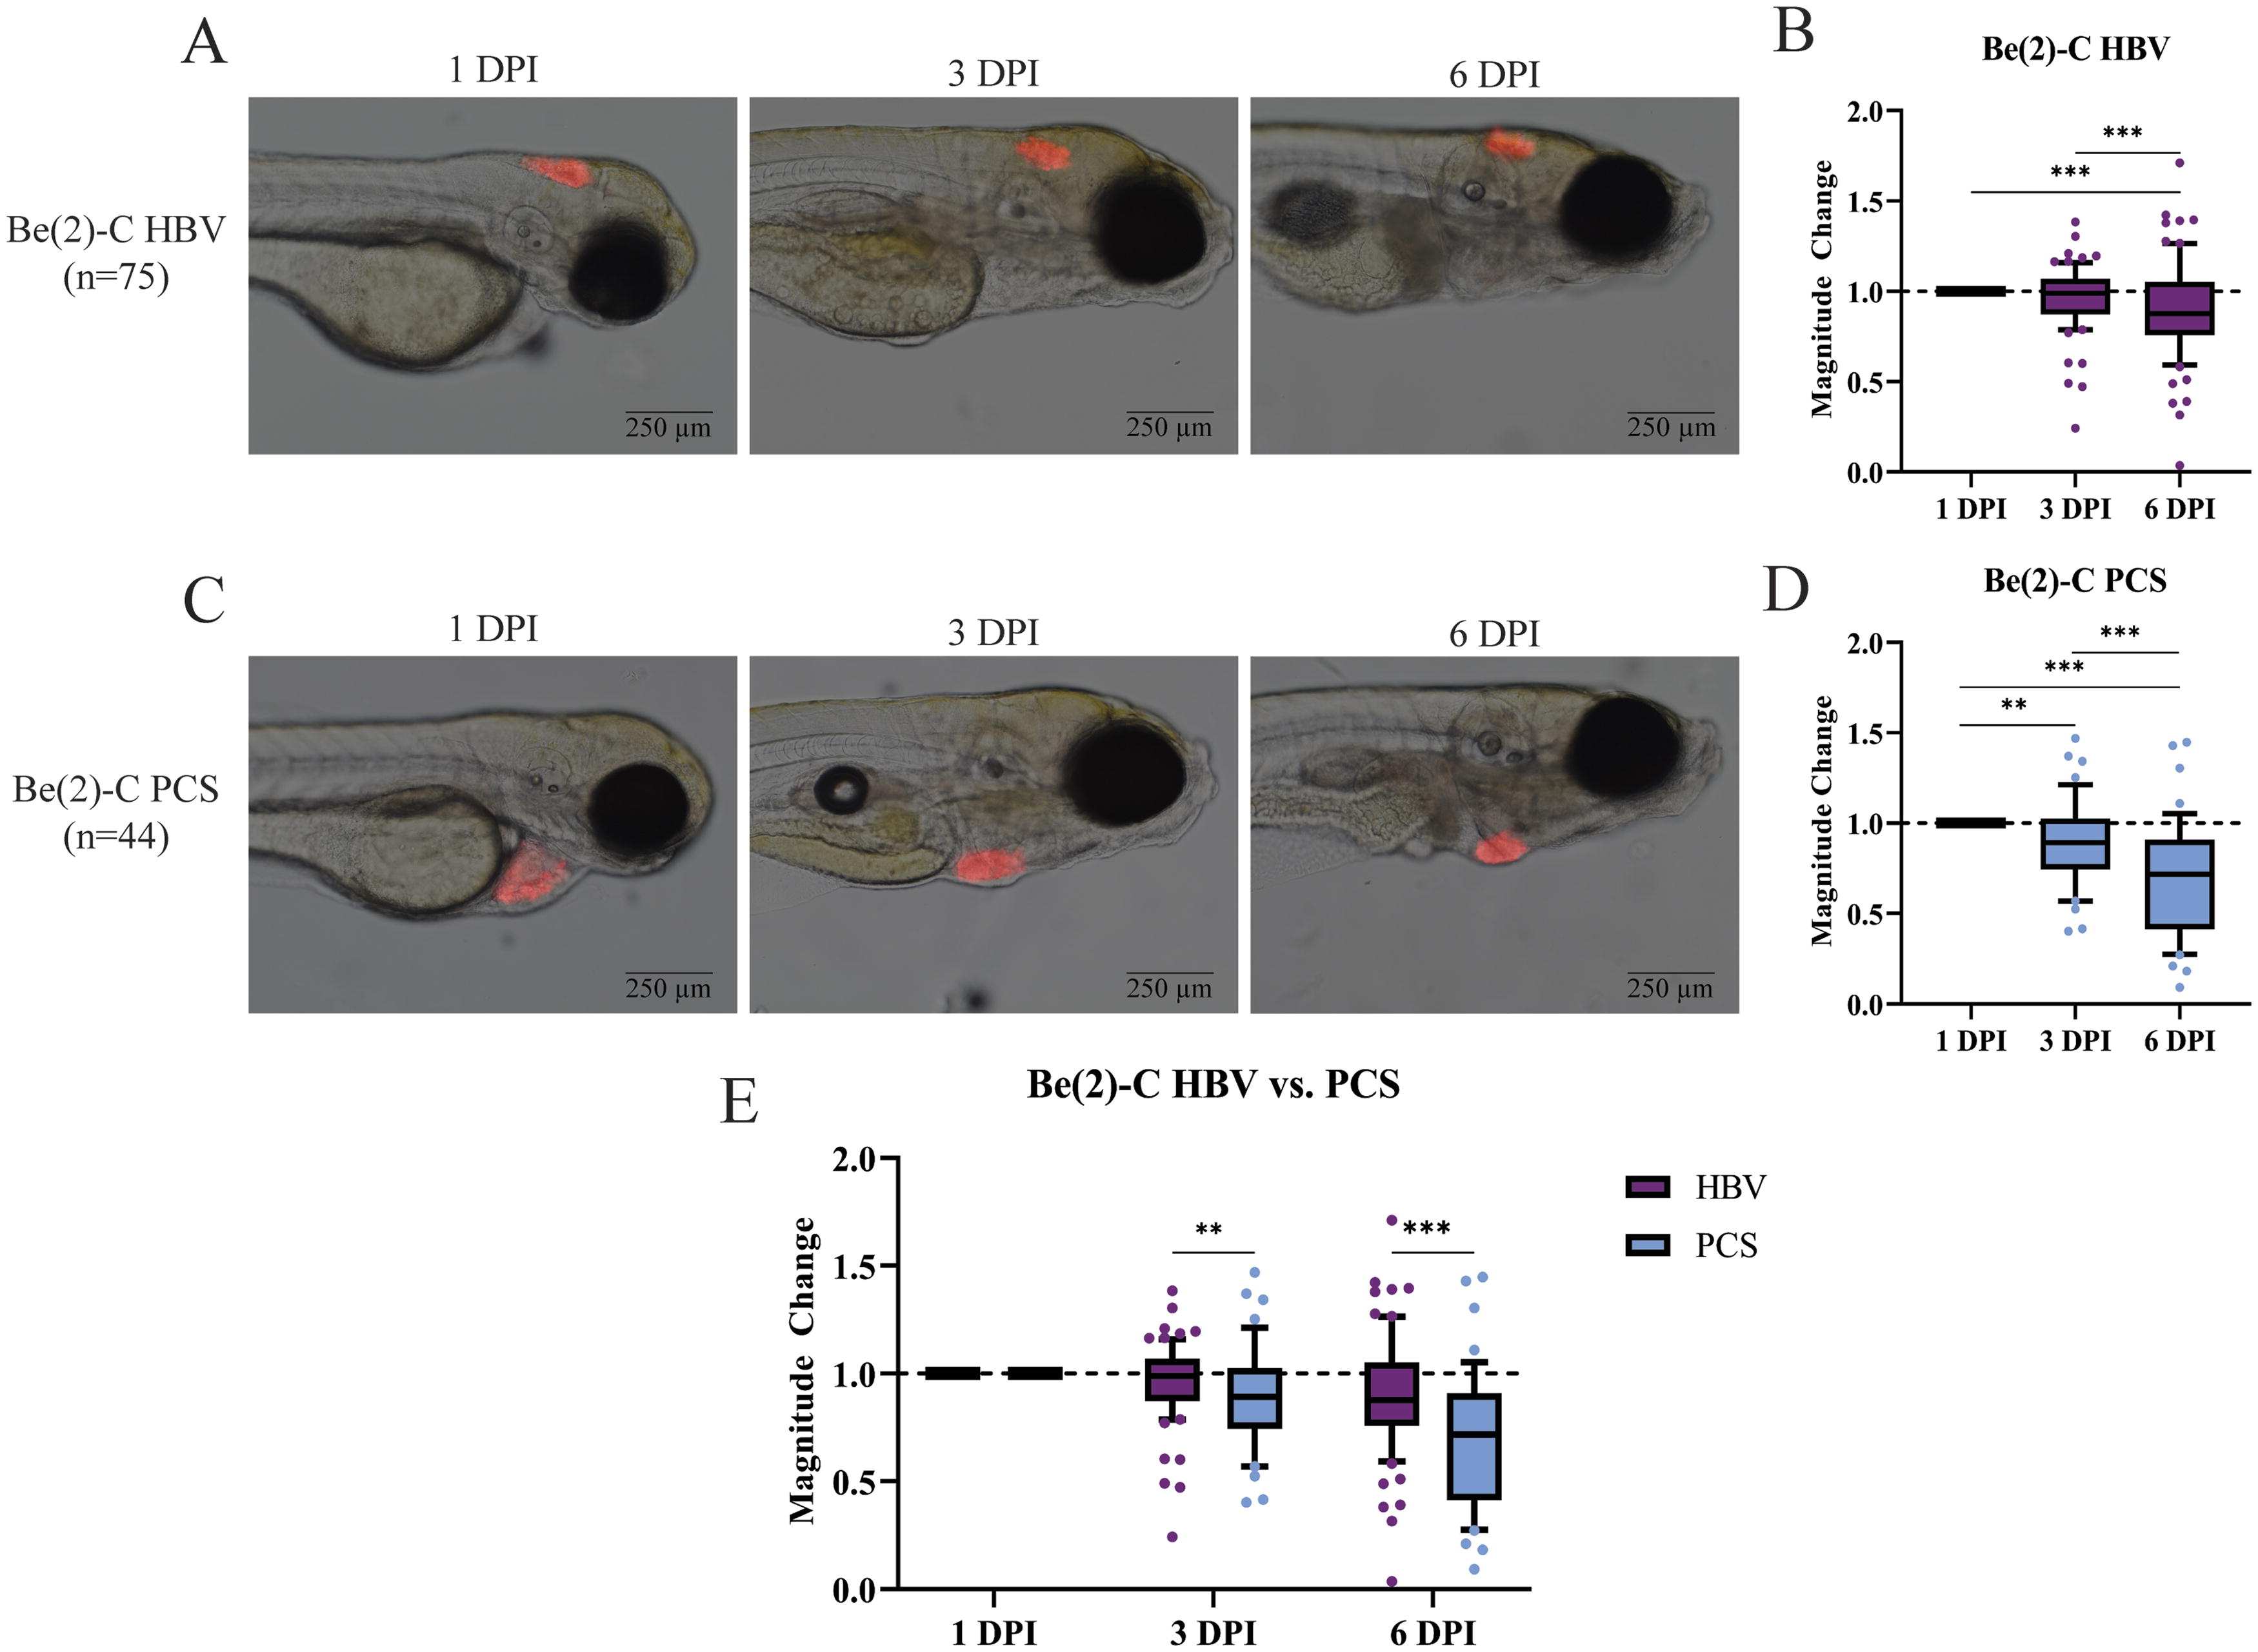
Be(2)-C cells fail to engraft in the HBV and PCS of 48 hpf zebrafish, with a location preference appreciated for the HBV.
SY5Y cell line
Imaging revealed a decline in SY5Y tumor volume following HBV injection (Fig. 3A). While the magnitude of tumor volume change varied greatly between fish, the median magnitude of change revealed a 0.66 and 0.38-fold change in tumor volume on 3 and 6 DPI, respectively, as compared with 1 DPI (Fig. 3B). In comparison, tumor volume dropped precipitously in the PCS as early as 3 DPI, with near complete loss of cells by 6 DPI (Fig. 3C). The median magnitude of change of all fish at both 3 and 6 DPI was near zero, with a 0.02 and 0.00-fold change appreciated at 3 and 6 DPI, demonstrating marked cell loss (Fig. 3D). Thus, SY5Y fails to engraft at the PCS, but demonstrates great variability in growth in the HBV, despite a median trend towards engraftment failure (Fig. 3E).
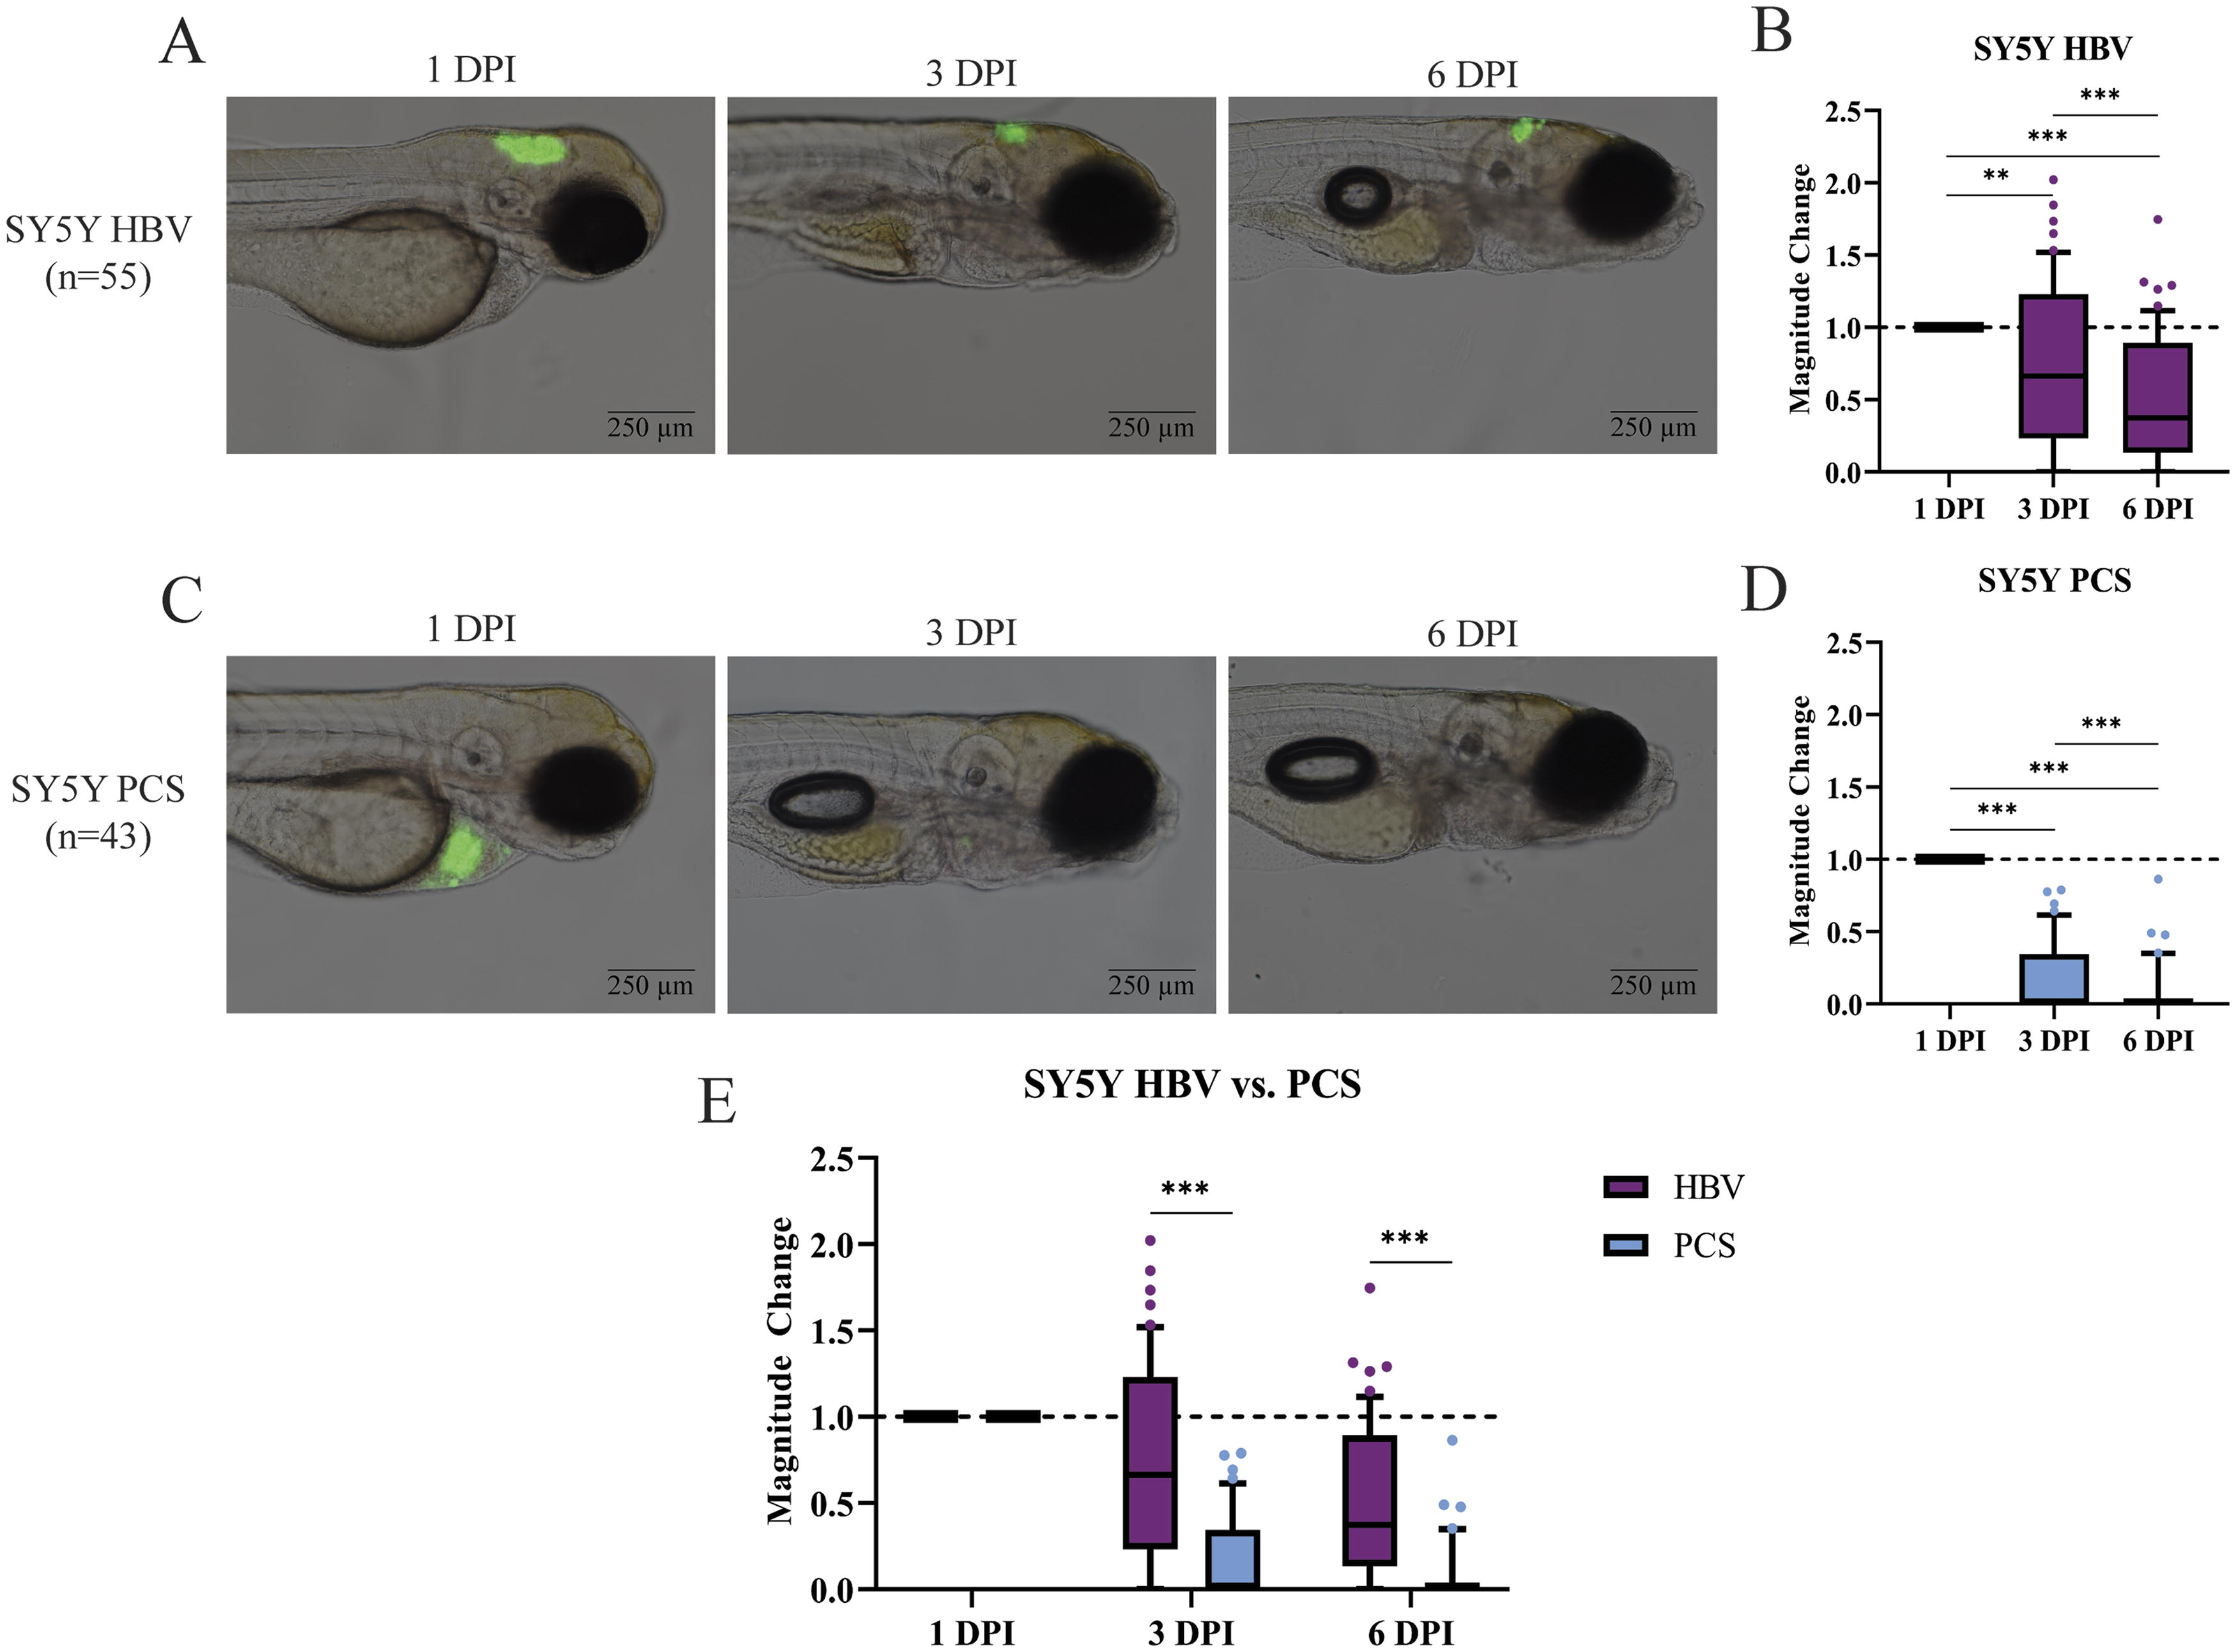
SY-5Y cells fail to engraft in the HBV and PCS of 48 hpf zebrafish, with near complete loss of cells in the PCS.
SK-N-AS cell line
At 3 and 6 DPI, an increase in tumor volume was visually appreciated at the HBV (Fig. 4A), with a 1.61 and 1.75-fold change (Fig. 4B). A similar pattern of tumor growth was observed in the PCS, with a visual increase in tumor size/fluorescence intensity appreciated postinjection (Fig. 4C) and a 1.48 and 1.69-fold change in median tumor volume at 3 and 6 DPI, respectively (Fig. 4D). An initial preference for the HBV as compared with the PCS (p < 0.05) was noted at 3 DPI, but this difference disappeared by 6 DPI (Fig. 4E). Data supports the conclusion that SK-N-AS engrafts in both the HBV and PCS of larval zebrafish with an initial preference for the HBV.

SK-N-AS cells successfully engraft in the HBV and PCS of 48 hpf zebrafish, with an initial location preference appreciated for the HBV.
Cell line comparison
While the above data demonstrates that Kelly and SK-N-AS can engraft in the HBV and PCS, comparison among cell lines across both sites allows better characterization of the engraftment ability per cell line and per site. In the HBV at 3 DPI, Kelly demonstrated the most significant change, with a near doubling of tumor volume, while SK-N-AS demonstrated a statistically smaller magnitude of change in tumor volume (Fig. 5A). Such growth advantage of Kelly cells over SK-N-AS in HBV was consistently seen in the HBV at 6 DPI (Fig. 5B). Interestingly, we did not observe any difference in the tumor growth between Kelly and SK-N-AS when they engrafted in the PCS at 3 DPI (Fig. 5C). Similarly, the increase of tumor volume at 6 DPI appears not significantly different between Kelly and SK-N-AS cells engrafted in the PCS (Fig. 5D). These data suggest that the Kelly cell line favors the HBV for engraftment and continuous growth. Although SY5Y and Be(2)-C cells failed to continue to grow in the injected larvae, there was significantly poorer retention of SY5Y as compared with Be(2)-C in the PCS. Of note, the growth rates of all neuroblastoma cell lines were slower in the in vitro culture at 32°C as compared with 37°C (Supplementary Fig. S3), suggesting that the in vivo engraftment capabilities of these cell lines do not seem to be well associated with their growth rate at 32°C in vitro.
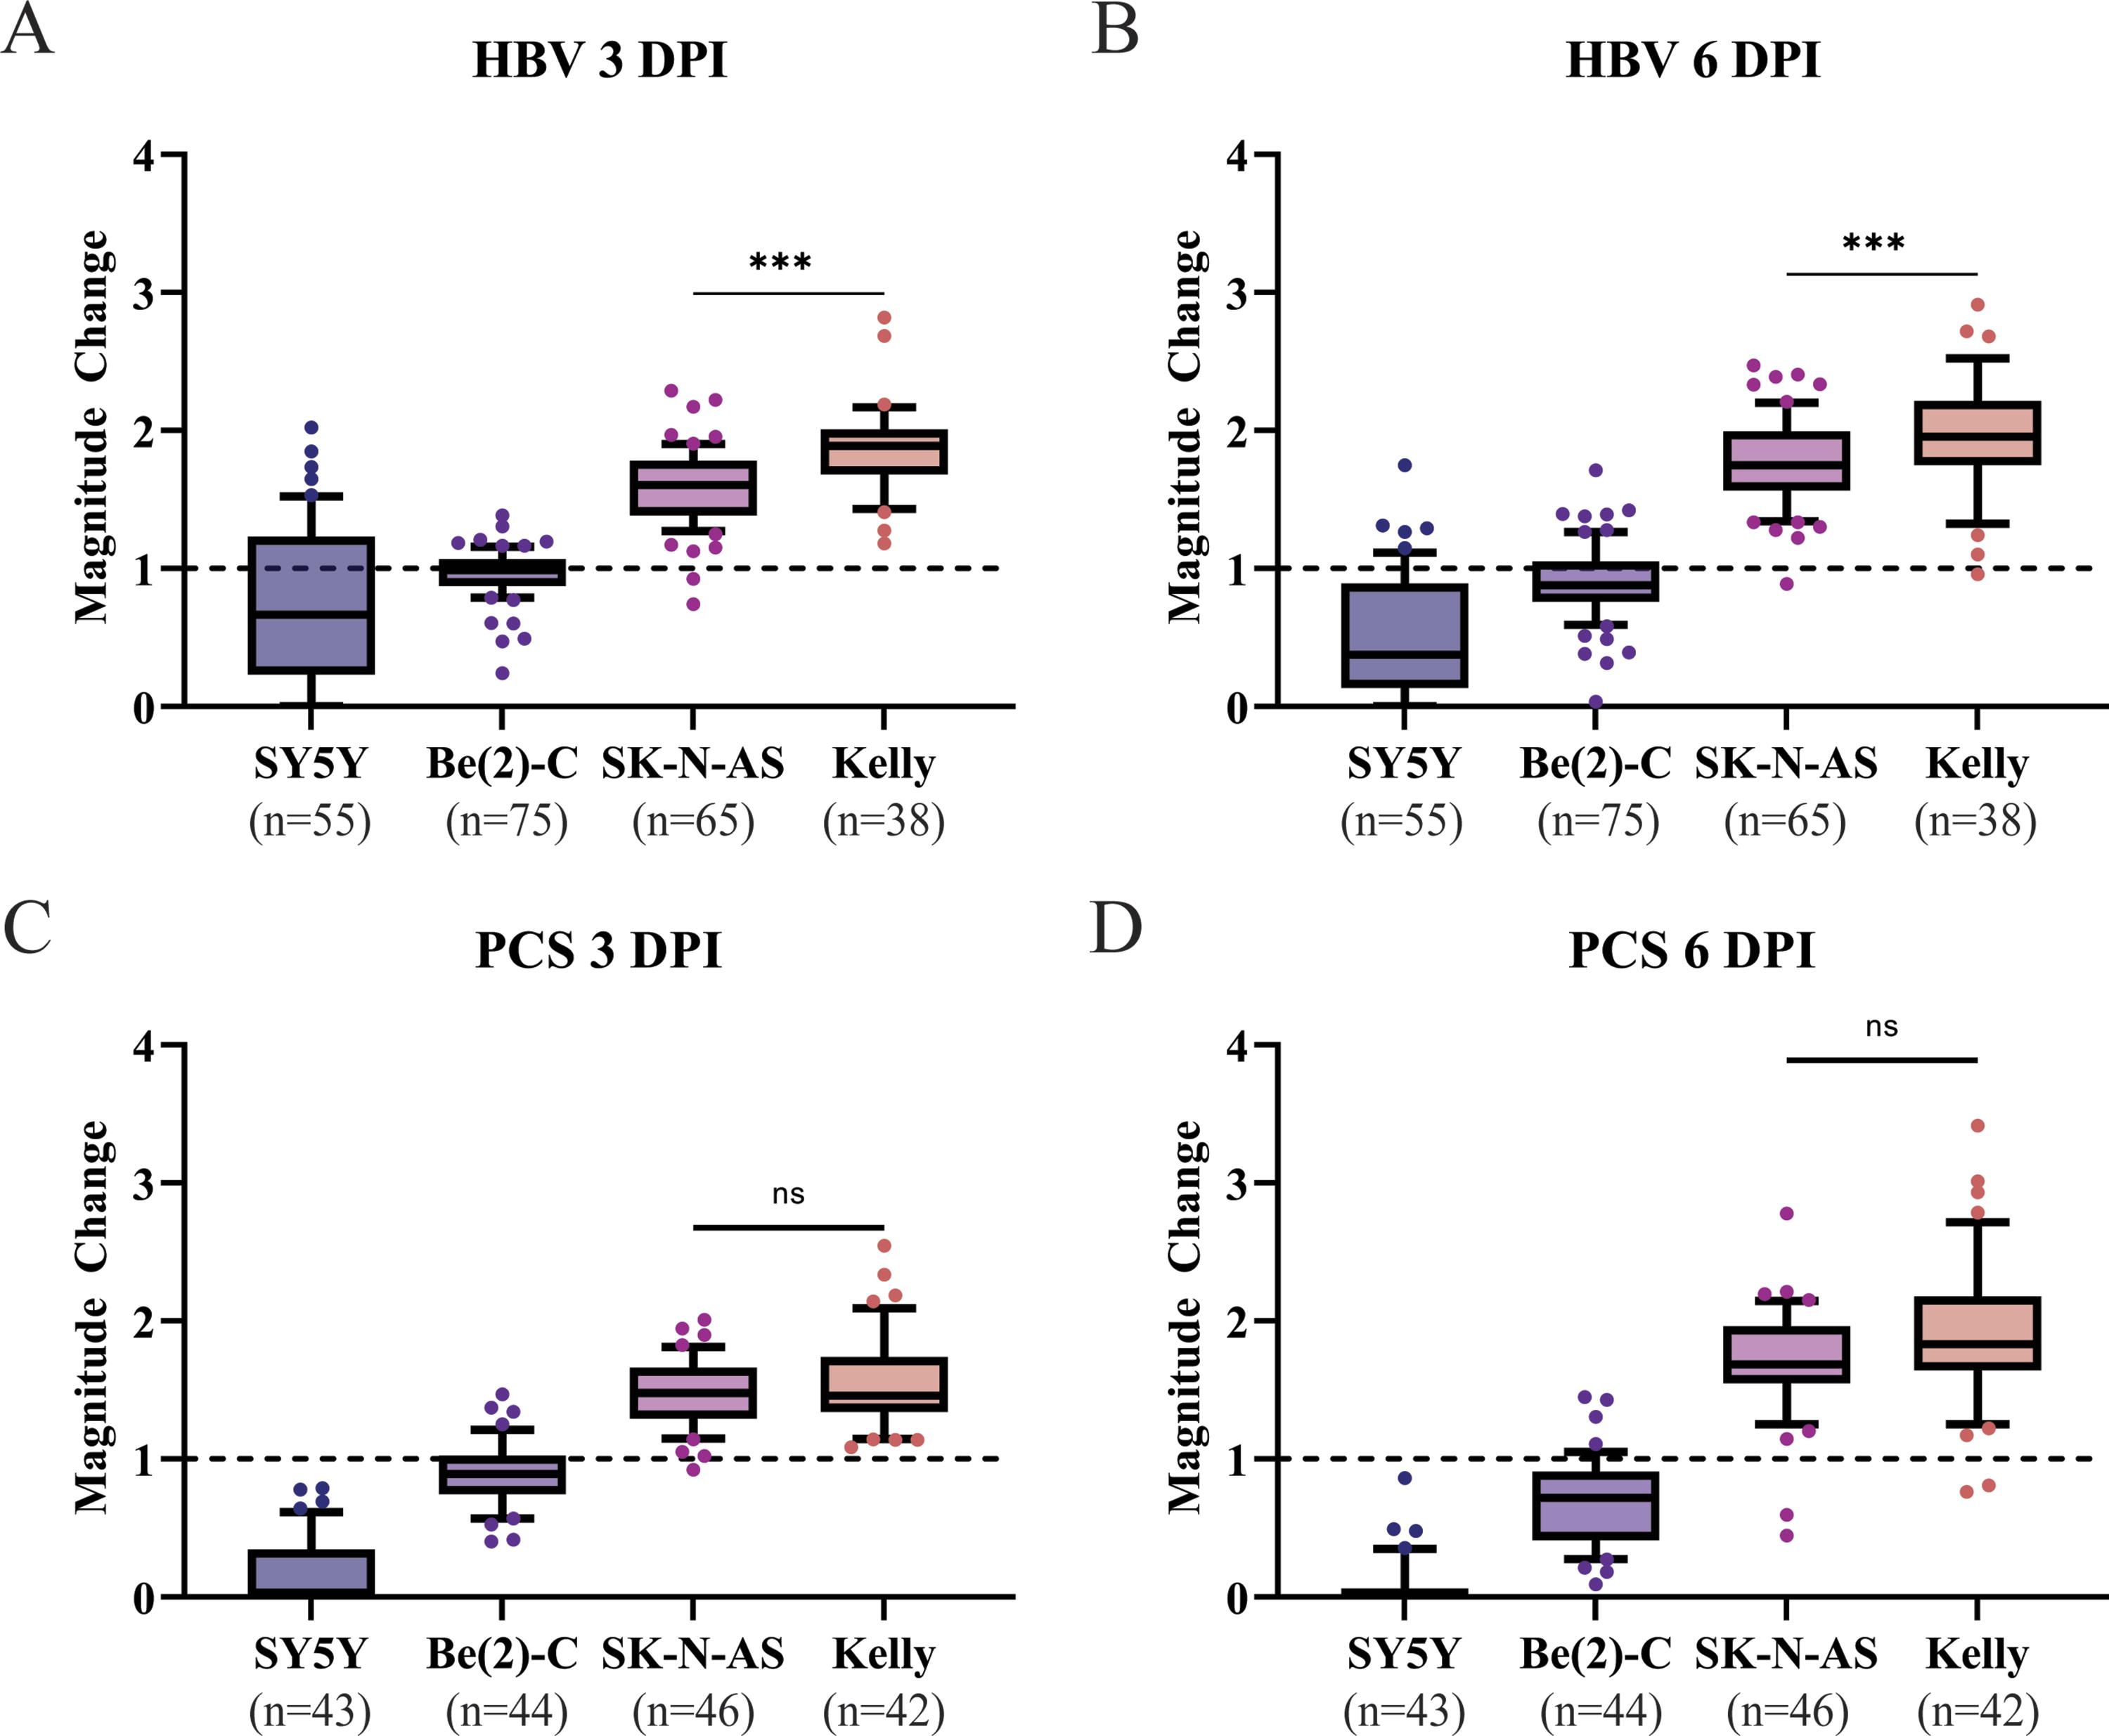
Kelly and SK-N-AS neuroblastoma cells engraft in the HBV and PCS of 48 hpf zebrafish while Be(2)-C tumor volume remains static and SY-5Y fails to engraft.
Discussion
In this study, we tested two uncommon sites for tumor engraftment in zebrafish larvae, the HBV and PCS. Four neuroblastoma cell lines, Kelly, SK-N-AS, Be(2)-C, and SY5Y, with different genetic and cellular traits were examined. First, engraftment ability at each site was evaluated via the change in tumor volume at 3 and 6 DPI as compared with that at 1 DPI. We found that both Kelly and SK-N-AS cell lines showed median increase in tumor size in both sites at both time points, but Be(2)-C and SY5Y cells seem to be unable to grow continuously in the injected animals, suggesting the engraftment capability of neuroblastoma cells is cell line dependent. Next, the location preference for each cell line was evaluated via a comparison of change in tumor volume at each location. We detected significantly larger tumor volume in the HBV as compared with the PCS in all groups at 3 DPI, suggesting HBV might provide a fitter environment for newly transplanted tumor cells. A final comparison between cell lines at 6 DPI for both sites revealed a hierarchy of engraftment, with Kelly cells demonstrating the highest median magnitude of growth, followed by SK-N-AS, Be(2)-C, and SY5Y.
Microinjection location has an established impact on the ability of cell lines to engraft, with a site preference noted across multiple tumor lines. Research comparing the yolk and perivitelline injection sites has demonstrated an impact on cell growth and larval survival of multiple cancer lines, with an ongoing debate on which site should serve as the standard for large-scale xenotransplantation studies.11,21–23 However, limited research evaluating HBV or PCS injection has demonstrated enhanced cell growth and larval survival compared to yolk or PVS injection for select cell lines.11,21,23 Our results appear to be the first to directly compare the preference of cell lines between the HBV and PCS and demonstrate that a location preference does exist among the cell lines tested.
The preference of cell lines for the HBV may be due to the microenvironment and immunologically privileged nature of the HBV. Neuroblastoma, although typically arising in the peripheral nervous system, is of neural origin with rare reports of brain metastasis, and thus the brain microenvironment may possess factors supporting cell growth.9,21 Additionally, the HBV of the zebrafish may serve as an immunologically privileged site, allowing engrafted cells to avoid the developing immune system. The larval zebrafish lacks an adaptive immune response until two to three weeks postfertilization, although the innate immune response begins to develop as soon as 1 DPF. The zebrafish blood–brain barrier (BBB) does not develop until 3 DPF—24 h after the injection in these experiments—and is not mature until 10 DPF. However, it is still possible that this immature BBB, in combination with a relatively less vascularity in the HBV compared with the PCS, may provide a partially immunoprivileged site to be favorable for tumor growth.8,24
The engraftment ability of cell lines in this study likely stems from a combination of intrinsic cell line features. The neuroblastoma cell lines chosen for study had a combination of three indicators of aggressiveness: MYCN amplification, ADRN and MES lineage, and LMO1 levels. Kelly and Be(2)-C are both MYCN amplified, with Kelly alone possessing elevated LMO1 levels. As only Kelly successfully engrafted, these results suggest a key role of MYCN/LMO1 collaboration in tumor engraftment. This is further supported by the failure of SY5Y to engraft despite possessing elevated LMO1 levels and an intermediate to ADRN lineage. LMO1 alone without MYCN amplification appeared insufficient for tumor growth in transplanted animals. SY5Y is commonly used to study neuronal differentiation, thus its failure to engraft could also be due to its relative less aggressiveness. Despite not possessing MYCN amplification, SK-N-AS, the only cell line tested with MES state, engrafted similarly to Kelly at both sites. This is consistent with the anticipated aggressive phenotype of MES lines, but the role of intermediate lineages in aggressiveness remains unclear. While our results appear to suggest that MYCN amplification, LMO1 levels, and cell lineage might affect engraftment of neuroblastoma cells in zebrafish larvae, additional cell lines with more diverse genetic background would be helpful to better understand the molecular basis that contributes to the engraftment ability of neuroblastoma cells.
While these results help inform further work, the limitations associated with the fish maintenance must be considered.
Conclusion
Our results demonstrate the ability of two neuroblastoma cell lines, Kelly and SK-N-AS, to successfully engraft in the HBV and PCS of 48 hpf larval zebrafish, with an injection preference for the HBV appreciated across all cell lines. These results help inform the developing larval zebrafish neuroblastoma xenotransplantation model by demonstrating the engraftment ability of select cell lines at less commonly used injection locations, serving as novel microinjection sites, and an option when multiple microinjection sites are required in the same fish.
Footnotes
Acknowledgment
The author thanks the Mayo Clinic Department of Comparative Medicine Laboratory Animal Residency for funding and support and Peter Rosen for review and editing.
Data Availability
The data that support the findings of this study are available from the corresponding authors upon request.
Institutional Review Board Statement
The zebrafish studies were conducted in accord with Mayo Clinic Institutional Animal Care and Use Committee (IACUC)-approved protocol # A00004637-19-R22.
Authors’ Contributions
J.M.L. and S.Z.: Conceptualization; J.M.L., S.H.T., M.A.S.: formal analysis; S.Z.: funding analysis; J.M.L.: investigation; J.L. and S.Z.: methodology; D.C.K., K.-E.T., S.E.S., A.M.S., S.Z.: resources; S.Z.: supervision; J.M.L.: validation, J.M.L.: visualization; J.L. and S.Z.: writing—original draft; J.M.L., D.C.K., K.-E.T., S.E.S., K.S.Y., M.A.S., A.M.S., S.Z.: writing—review and editing. All authors have read and agreed to the published version of the article.
Disclosure Statement
The authors declare no conflict of interest.
Funding Information
This work was supported by a grant R01

References
Supplementary Material
Please find the following supplemental material available below.
For Open Access articles published under a Creative Commons License, all supplemental material carries the same license as the article it is associated with.
For non-Open Access articles published, all supplemental material carries a non-exclusive license, and permission requests for re-use of supplemental material or any part of supplemental material shall be sent directly to the copyright owner as specified in the copyright notice associated with the article.
