
Abstract
Accurate travel time information acquisition is essential to the effective planning and management of bicycle travel conditions. Traditionally, video camera data have been used as the primary source for measuring the quality of bicycle travel time. This paper deals with an investigation of bicycle travel time estimation on a short corridor, using Bluetooth sensors, based on field survey of travel time at one arterial road in Hangzhou. Usually bicycle travel time estimates with Bluetooth sensors contain three types of errors: spatial error, temporal error, and sampling error. To avoid these, we introduced filters to “purify” the time series. A median filtering algorithm is used to eliminate the outlier observations. The filtering scheme has been applied on Genshan East Road and Moganshan Road. Test data are used to measure the quality of bicycle travel time data collected by the Bluetooth sensors, and the results show that the new technology is a promising method for collecting high-quality travel time data that can be used as ground truth for evaluating other sources of travel time and other intelligent transportation system applications.
1. Introduction
Bicycles contribute to 30% to 70% of daily trips in China. Bicycles have their own bicycle lanes built to the right of the motor lanes for each direction of traffic in most cities in China, physically separated from vehicles and pedestrians [1]. Nowadays, these lanes are becoming increasingly busy. Transportation authorities have been trying to build new or expand existing bicycle roadways to increase bicycle capacity. However, there is a lack of bicycle travel time estimation analysis tools designed and calibrated for conditions in China [2, 3].
A novel technology that uses bypassing Bluetooth devices to capture vehicle travel times has been shown to be effective [4, 5]. With the increased penetration of Bluetooth on the roadways in China, it was found that nearly 2%-3% of bicycles in Hangzhou had active Bluetooth devices in 2010. These sensors become a viable alternative to other methods of bicycle travel time data collection that have traditionally been expensive and invasive to privacy [6, 7].
Bluetooth is a short-range communications protocol developed by Special Interests Group (SIG) for interdevice communications. Presently, most electronic devices, such as cell phone handsets/headsets, laptop computers, and electronic organizers support the Bluetooth protocol. The protocol itself consists of a device to broadcast a unique 48-bit media access control (MAC) address to devices within range. The broadcast happens at varying frequencies and random intervals (frequency-hopping within a 10.24-second time window), allowing for multiple devices to connect to each other. This protocol can be optimized for these purposes, but creates some challenges for additional purposes, such as travel time collection based on Bluetooth MAC address matching [8]. Haghani et al. compared Bluetooth travel time with floating car data, demonstrating that the travel times collected by Bluetooth sensors are not significantly different from actual travel times [9]. Although the authors discussed the effect of shorter corridors on the vehicle travel time (speed) error, the effects addressed on bicycle travel times have not been considered [10– 12].
In response to the above needs, the research efforts in this paper have been dedicated to the following aspects.
Collect bicycle travel time data with Bluetooth sensors and with video cameras. Analyze the effect of shorter corridors on the bicycle travel time and model the error. Offer the filter algorithm for travel time estimation with Bluetooth sensors. Compare the average bicycle travel time with those obtained from the data produced by video camera.
2. Data Collection
2.1. Experiment Setup
Using video cameras is one of the most reliable bicycle travel time measurement methods available, and bicycle travel time data collected by video cameras can be used for evaluating the performance of the Bluetooth-based approach. The prototype MAC Address Detector (MACAD) developed by the SUPCON Group of Zhejiang University was used to measure the Bluetooth MAC address-based travel time.
2.2. Study Route
This study involved field observations at one arterial road, called Genshan East Road, in Hangzhou, as shown in Figure 1. To analyze the arterial travel time estimation error with Bluetooth sensors, the geometry and traffic flow parameters are summarized in Table 1.
Summary of key characteristics at the study route.


Data collection maps.
2.3. Field Data Collection
Two types of data are collected: actual travel time data collected by the video cameras and Bluetooth MAC address data collected by MACAD systems. On Genshan East Road, observations were made from 0:00 am to 24:00 pm on the 10th April and 12th of April 2011. On Moganshan Road, observations were made from 0:00 am to 24:00 pm on the 13th April and 14th April 2011.
2.3.1. Video Cameras Acquisition
At the location A and B of the road (as is shown in Figure 1), video cameras are carefully placed to capture bicyclist behavior along eastward directions of traffic. Recorded footage is copied to DVDs and viewed on a flat-panel television. Lines are drawn with a dry-erase marker on the television based on the position of Bluetooth sensors to establish measurements that can be converted to position measurements for each bicyclist. Since the video cameras at two locations begin at the same time, the matched bicyclist will be observed at the different time sat two locations. The difference in time between the two observations is the travel time. Video cameras acquisition is one of the most reliable travel time measurement methods available, and travel time data collected by video camera can be used for evaluating the performance of the Bluetooth-based approach.
2.3.2. Bluetooth Sensors Acquisition
Genshan East Road and Moganshan Road are both four-lane arterials with four inside vehicle lanes and two bicycle outside lanes. All the Bluetooth sensors readers are designed to read the bicycle traveling in the outside side lane (closest to the curb). Obtaining travel time measurements using Bluetooth sensors involves matching observed MAC addresses between the location A and B of the road (as is shown in Figure 1). The difference in time between the two observations is the travel time.
3. Data Analysis and Results
In order to have a systematic investigation of bicycles travel time estimation on a short corridor, with Bluetooth sensors, this study has employed the following analysis procedure.
Step 1.
Analysis of bicycle travel time error with Bluetooth sensor.
Step 2.
Removing outlier observations.
Step 3.
Comparison of average bicycle travel time.
3.1. Analysis of Bicycle Travel Time Error with Bluetooth Sensor
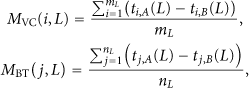
Because the Bluetooth readers are capable of detecting MACs within a specific range, the travel times obtained can be thought of as zone-to-zone. However, video camera travel times can be thought of as line-to-line travel times, as the line needed for detection is relatively small. This is illustrated in Figure 2, where the dashed lines represent the Bluetooth detection zone and the lines represent the video cameras detection lines. The average travel times obtained from both types of sensors can be expressed as follows:

Segment composition.
In particular, the authors realize that the travel time reported by the Bluetooth device will be subject to the following sources of error.
3.1.1. Spatial Error
A Bluetooth-equipped bicycle may be detectable anywhere in the circle of the detection zone. However, the detection zone radius varies with different Bluetooth detectors, bicycle Bluetooth devices and environments. Furthermore, since Bluetooth signal is easily affected by home appliances, such as microwaves and wireless phones in residential areas [4], the detection zone formed by an omnidirectional antenna is usually an irregular shape rather than an ideally circular area.
3.1.2. Temporal Error
As specified by the Bluetooth protocol, a Bluetooth device can be detected anytime in a time range of up to 10.24 seconds after it enters the detection zone. It can also be missed entirely or be detected multiple times depending on the time it stays in the detectable area. The time until its first detection is determined by several factors, such as the probabilistic characteristics of channel hopping behavior, the signal strength from the Bluetooth device, and sensitivity of the Bluetooth detector [13].
3.1.3. Sampling Error
This type of error results from the sampling process of the Bluetooth devices of the bicycles. Motor vehicles can be counted as bicycles, since Bluetooth-based method collects travel time data from multiple transportation modes, such as pedestrians, motor vehicles, and bus passengers in addition to bicycles, unlike a video camera reader that only collects bicycle travel time data.
3.2. Removing Outlier Observations
Both video camera and Bluetooth MAC address-based travel times are expected to contain outliers. These outliers are usually caused by drivers who detour or stop in certain places between detector locations rather than being delayed by the bicycle stream. The video camera noise removal procedure can be relatively trivial, as only bicycles compose the relatively large travel time data set. However, the Bluetooth device contains several errors. A median offline filtering algorithm is designed to extract ground truth from the pool of Bluetooth observations. A detailed comparison between the proposed filter and an alternative method by Dion and Rakha [14] can be found in Mei and Tian [15].
The filtering algorithm we introduce is moving median filter (MMF). Window of size L is “moving” from beginning to the end of the time series with unit step k, the median of L values falling within window is continuously calculated. In Figure 3 the flowchart of MMF is presented, and below the detailed description of the algorithm is introduced.

Flowchart of moving filter algorithm.
Description of algorithm:
Notion:
Count travel time of bicycles at moment i is denoted by small letter width of moving window L; stand deviation (SD) of time series in the sampling interval smoothed stand and deviation (SD) of time series that is estimated in the sampling interval k with the use of the filter smoothing factor (vary between 0 and 1, usually a value of 0.5.) α; minimal and maximal width of window maximal and minimal limits of Limit of maximal deviation of current count rate from median value Select time series from database with N elements. Start algorithm operation, assign If If If If absolute value of Increment i by 1, go to step 3.

This filter is optimal for time series containing abrupt changes of mean followed by recovery.
While the number of standard deviations that define the size of the validity window is user definable in the algorithm, it is envisioned that basic validity ranges encompassing two or three standard deviations will be utilized. The use of a search window that is two standard deviations wide would mean that all data points within a 95 percent confidence interval are to be considered as valid and that all other points falling outside this range are to be rejected from consideration when estimating average link travel times. Similarly, the use of a validity window that is three standard deviations wide would mean that all data points within a 99 percent confidence interval are to be considered as valid. Figures 4 and 5 illustrate how the search window enhances the performance of the algorithm. The figures illustrate the variation in the interval average travel time, as well as the lower and upper limits of the validity window, after consideration of trends outside the basic validity range.
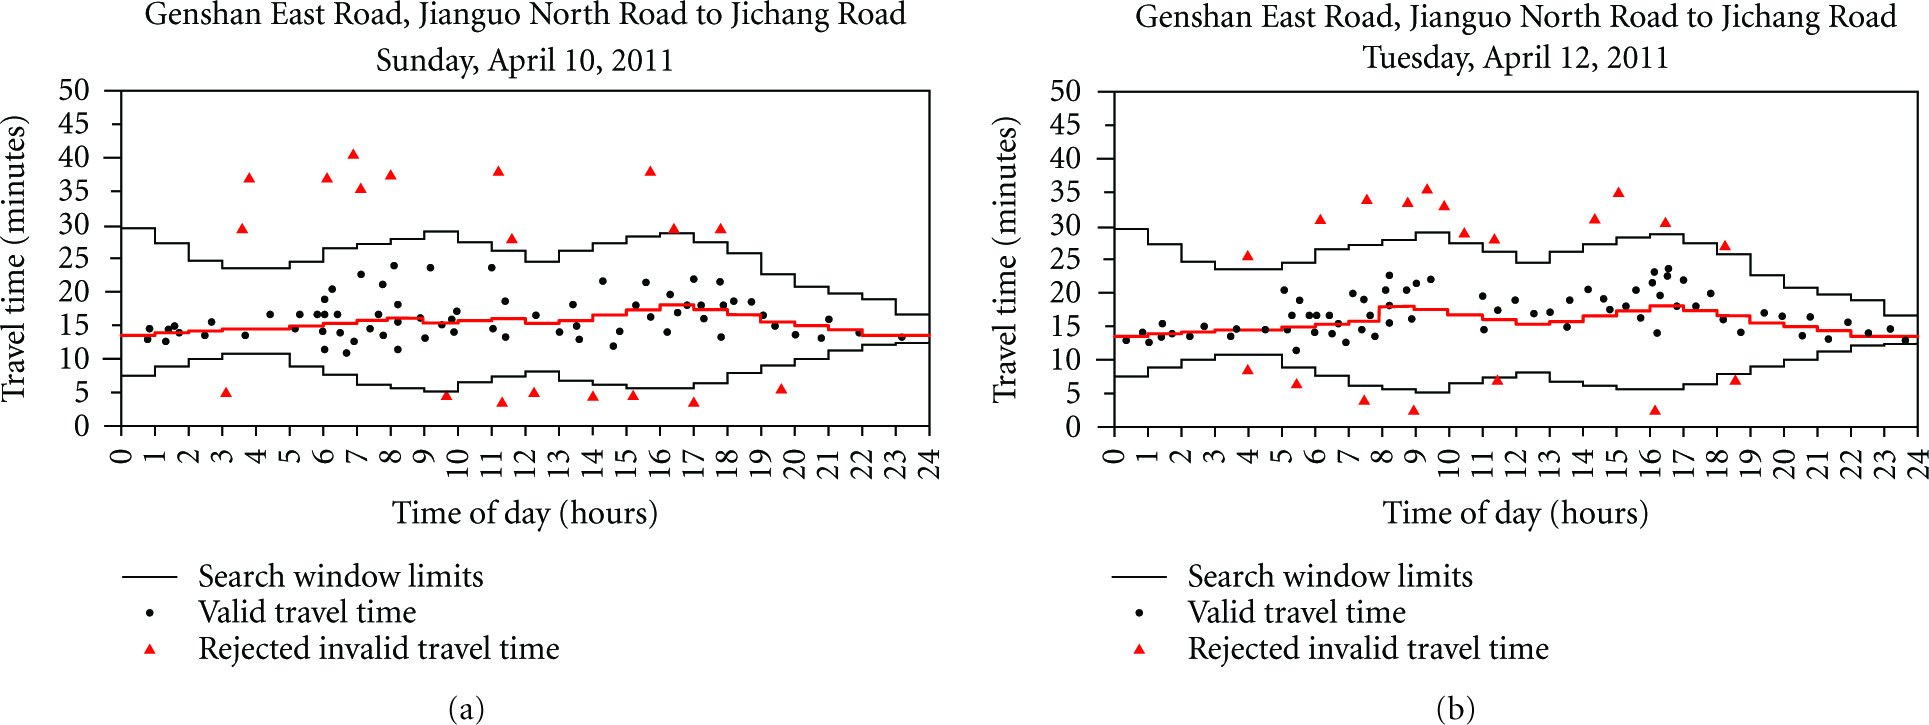
Application of filtering algorithm to survey data with Bluetooth sensor on Genshan East Road.

Application of filtering algorithm to survey data with Bluetooth sensor on Moganshan Road.
3.3. Comparison of Average Bicycle Travel Time
To verify the accuracy of travel time estimates obtained through the use of Bluetooth technology, we compared them with those obtained from data produced by video camera. Taking the observations on the 10th of April in Genshan East Road as an example, the travel time data were both collected using video cameras and Bluetooth sensors for 24 hours on the 10th of April using directional antennae. Predictably, the sample sizes varied greatly, with the video camera-collected data for each direction being roughly 25-times larger than the Bluetooth dataset. Furthermore, there are some differences between the travel time distributions collected by both devices. Figure 6 shows the distributions of Bluetooth and video cameras data. It can be seen that the variance of the Bluetooth travel times collected is larger than that of the video camera data. This can be attributed to the larger detection area and the uncertainty involved due to the random frequency hopping protocol [12].

Video cameras and Bluetooth travel time distributions from 0:00 a.m. to 24:00 p.m.
To add more insight to the analysis, the null hypotheses in these statistical tests was that the Bluetooth mean travel time (
The statistic that was used in this test is given as:
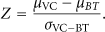
Results of the z-tests that were performed in the hypotheses testing are reported in Table 2. The null hypothesis could not be rejected at extremely high levels of significance for the observations from Genshan East Road and Moganshan Road. These statistical tests show that the Bluetooth sensor travel time data are a good representative of actual travel times.
Hypothesis test for similarity between means of bluetooth and video cameras.

4. Conclusions
One of the most important parameters in bicycle lane design and managing bicycle operations is bicycle travel time. For evaluating the quality of bicycle travel time information generated by bicycle surveillance systems, video camera data have been used as a proxy. This paper deals with a new travel time data collection methodology based on Bluetooth technology, which is capable of sampling travel time of bicycles in the bicycle stream. The bicycle travel time error with blue sensor was analyzed. A median filtering algorithm was used to eliminate the outlier observations. The filtering scheme has been applied on Genshan East Road and Moganshan Road. Test data were used to measure the quality of travel time data collected by the Bluetooth sensors, and the results show that the results by way of the new sensors are not significantly different from the actual travel times.
In summary, the use of Bluetooth sensors to measure travel time provides a comparable alternative to video cameras technology and can be used with significantly less effort and lower cost. On average, the Bluetooth sensors sample between 2.0% and 3.0% of the bicycles in the bicycle stream. Further research regarding the use of Bluetooth sensors should focus on improving detection rate through the use of multiple sensors and correcting errors through observing identical MAC addresses on multiple systems.
Footnotes
Acknowledgment
This work was supported by the National Natural Science Foundation of China (no. 50908205) and the National High-tech Research and Development Program (863 Program) (no. 2011AA110304).