
Abstract
As 2015 got underway, most Americans were poised for another Bush vs. Clinton presidential election, but by the middle of the year it was clear something unexpected was unfolding in the race for the White House. In this article, we illuminate the political landscape heading into the 2016 election, paying special attention to the public’s mood, their assessments of government, their attitudes about race and members of the other party, and the health of the nation’s economy. Fundamental predictors of election outcomes did not clearly favor either side, but an increasing ethnic diversity in the electorate, alongside a racially polarized electorate, was favorable to Democrats. Ultimately, an ambivalent electorate divided by party and race set the stage for a presidential primary that played directly on these divisions, and for a general election whose outcome initially appeared far from certain.
In the 1953 film The Wild One, a woman approaches Marlon Brando’s character, Johnny Strabler, the leader of a gang called the “Black Rebels Motorcycle Club” that had just rolled into town. She asks, “What are you rebelling against, Johnny?” His famous reply: “Whaddaya got?”
Brando’s famous line—indeed, his entire persona, with his sideburns and black leather jacket—evoked something new and even dangerous. At a time when much of America was enjoying the new comforts of life in the suburbs and the convenience of the automobile, the television, and fast food restaurants, Johnny Strabler tapped into some sort of contempt or frustration—but even he could not quite say what it was.
As the presidential campaign got underway in 2015, most Americans were not wearing leather jackets or riding motorcycles. In fact, they were increasingly optimistic about the economy, more than they had been for much of the past decade. But in the minds of many observers, there was an inchoate rebelliousness among Americans that sounded an awful lot like “Whaddaya got?”
Americans were said to be angry, anxious, and fearful. They were said to “be poised for a major reset” (Todd 2015). Some polls appeared to back up this characterization of the electorate. In October 2015, 69 percent of Americans agreed with this statement: “I feel angry because our political system seems to only be working for the insiders with money and power, like those on Wall Street or in Washington, rather than it working to help everyday people get ahead.” And 54 percent agreed that, “The economic and political systems in this country are stacked against people like me.” 1 Between November 2015 and March 2016, the share of news stories about the presidential election that contained the word “angry” increased by 200 percent.
“Voter anger” would be a common refrain throughout the campaign, and there clearly were signs of anger in the electorate. But there were also signs of other, more positive sentiments. Americans felt far more favorably about the economy than they had during the presidential campaigns in 2008 or 2012. Indeed, they felt as favorably about the economy as they had more than 10 years ago. This optimism reflected the slow but steady economic recovery after the recession and financial crisis of 2007–9.
What was most striking about Americans in 2015 was not their diffuse “anger” but an unusual disjuncture: despite their optimism about the economy, they were distinctly less positive about the overall direction of the country and about their president, Barack Obama. This disjuncture suggests that Americans were not so much “angry” as ambivalent. They saw both good and bad in the country. For example, in that same October poll where a majority said they were “angry” about the political system, 58 percent agreed that they were “cautiously optimistic about where things are headed.” 2
What was behind this disjuncture? One factor is partisanship. Even as the recovery proceeded apace, Democrats and Republicans held divergent views of the economy and Obama. This helped to depress approval of Obama in particular. In an era where opposite partisans are increasingly unwilling to support the president except under extraordinary circumstances, it may be harder to gain some measure of bipartisan support, even when economic times are good.
A second key factor is race. The Obama administration was not just eight years of a Democratic president; it was also eight years of a black president. Obama’s impact on public opinion was profound. During his administration, Americans’ racial identity became a more potent force in public opinion. Gaps between the political opinions of whites and blacks were frequently larger than they had been in the past.
Moreover, white Americans’ opinions of blacks and other minority groups became more intertwined with their partisan identities and more potent predictors of their opinions about the economy and many other issues—virtually anything even remotely associated with Obama. This growing “racialization” of public opinion began before Obama became president, but it became more pronounced during his time in office.
The public’s ambivalence—and these sharp cleavages based on party and race—have resonated throughout the 2016 presidential campaign. For example, even before the Republican primary got underway, there was already significant economic discontent among Republicans. The racialization of public opinion helped to create an increasing fraction of Republicans who expressed unfavorable attitudes toward various minority groups. Both economic discontent and hostility to certain minority groups would help to fuel the surprising success of Donald Trump.
In the Democratic party, where racialization has meant a growing liberalism on racial issues, both of the frontrunners—Hillary Clinton and Bernie Sanders—were freed to advocate for an agenda that spoke more directly than the party had in decades to the interests of the minority groups that were increasingly important to the Democratic coalition.
In the general election, the crucial fundamentals of presidential elections did not clearly favor either side, at least as of early 2016. A growing economy benefited the incumbent Democrats. And with the ethnic diversity of the electorate increasing year by year, a racially polarized electorate was increasingly favorable to Democrats, too.
On the other hand, even though Obama is not on the ballot in 2016, he matters a great deal. Presidential approval is crucial to presidential election outcomes—and Obama’s approval rating lagged the growing economy. Democrats also confronted the simple challenge of earning a third consecutive term in the White House.
Ultimately, an ambivalent electorate divided by party and race sets the stage for a presidential primary that plays directly on these divisions, and for a general election whose outcome we would typically expect to be far from certain.
Was It “Morning in America” Again? The Economic Recovery of 2010–15
Obama took office amid the worst recession since the Great Depression. This recession—the “Great Recession”—was particularly punishing because it was paired with a financial crisis, and some research suggests that this combination leads to an even more sluggish recovery (Reinhart and Rogoff 2009; Danziger 2013). The Great Recession bore this out.
For example, the deep recession that occurred in 1981–82—during Ronald Reagan’s first term—actually saw unemployment peak at a higher level (10.8 percent) than it did in the 2007–9 recession (10 percent). But after the 1981–82 recession was over, the economy grew at a much more rapid pace. Unemployment returned to its prerecession value in less than three years. By contrast, this took almost eight years after the Great Recession began. 3
Despite this sluggish pace, an economic recovery did occur. Figure 1 depicts the recovery by examining trends in four economic indicators: the quarter-to-quarter change in gross domestic product, which captures the overall size of the economy; the monthly unemployment rate; the monthly inflation rate; and real disposable income per capita, which is equal to personal income minus income tax payments and is adjusted for inflation. This figure begins in 2008, during the height of the recession, and continues through the end of 2015.

Trends in Key Economic Indicators, 2008–15
The recovery did not really begin until 2010. At that point, gross domestic product began to expand. On a quarter-to-quarter basis, the average growth in gross domestic product from 2009 to 2015 was somewhat below its historical median from 1947 to 2008, and there were a few quarters where growth was nearly nonexistent or even negative. But the overall trend was toward economic expansion.
As the economy expanded, unemployment began to fall and—with the exception of the first quarter of 2013—disposable income began to increase. By the end of 2015, the unemployment rate of 5 percent was below its median value over the 60 years from 1948 to 2008. Disposable income was nearly $2,000 above its prerecession peak in the second quarter of 2008. Meanwhile, the inflation rate—measured as month-to-month changes in the consumer price index—was consistently low, compared to its historical median.
This combination of falling unemployment and low inflation was particularly distinctive. These two indicators are often combined into the “misery index,” where the combination of high unemployment and high inflation, characteristic of the late 1970s, is the most “miserable” possibility. But by 2015, the misery index was nearly as low as it had been since 1950 (Dews 2016). This implied the opposite of stagflation: an active demand for goods and services along with low unemployment and inflation.
In short, as the election year was getting underway, the U.S. economy had made important progress since the Great Recession. And, perhaps more importantly, Americans realized it.
One of the longest measures of Americans’ views of the economy is the Index of Consumer Sentiment, which is tracked by the University of Michigan and dates back to 1960. The index is based on responses to five questions, three of which measure people’s views of their current financial circumstances and economic conditions in the country and two of which measure their expectations about the near future. 4
Figure 2 presents the trend in this index since 1980, when it is possible to separate the electorate by upper-, middle-, and low-income terciles. After Obama took office, there was an initial increase in consumer sentiment that soon plateaued before diving down again during the debt ceiling crisis in summer 2011—the possibility that Congress might cause the United States to default on its debts by not raising the debt ceiling provoked anxiety among financial markets and Americans alike.
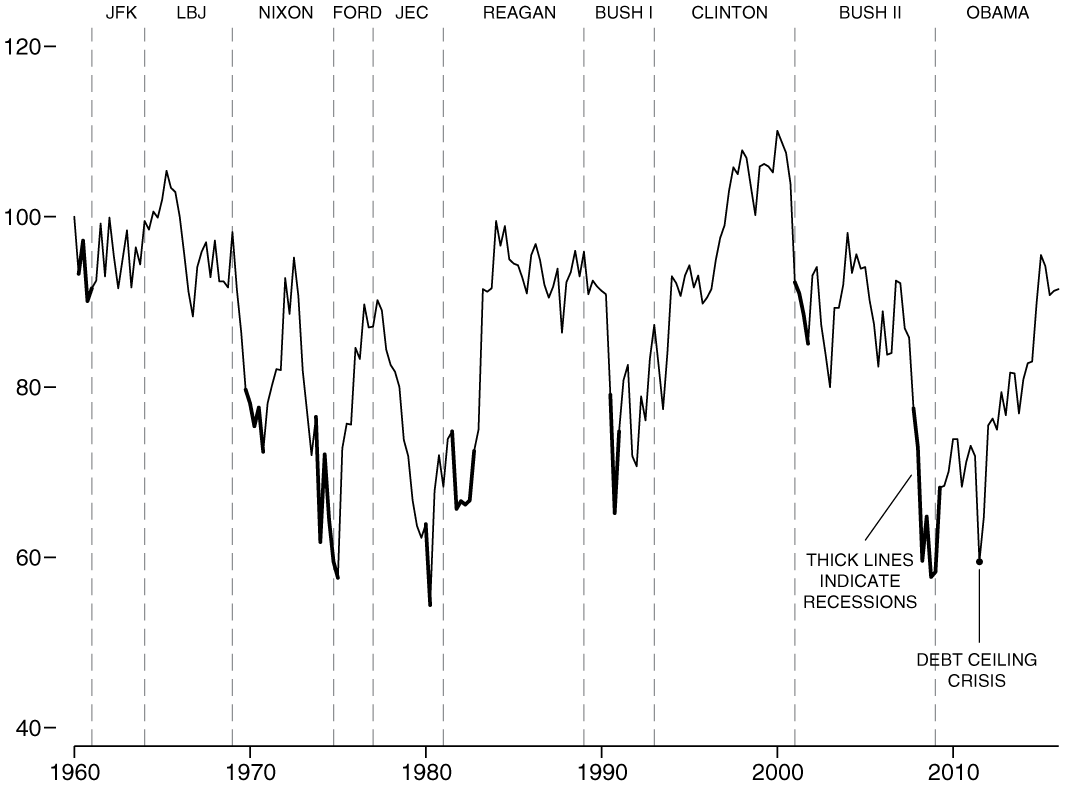
The Index of Consumer Sentiment among Income Groups, 1980–2015
But after that crisis passed, consumer sentiment resumed its swing toward greater optimism. By the end of 2015, even with a slight downturn in the second and third quarters of that year, consumer sentiment was as positive as it had been since the mid-2000s. It was also as positive as it had been in the mid-1980s during the recovery from the recession of 1981–82. For example, among all Americans, the value of consumer sentiment at the end of 1983, as Reagan’s reelection campaign was gearing up, was 91.6. At the end of 2015, it was almost exactly the same: 91.0. 5
Other measures of economic sentiment showed a similar trend. For example, in a February 2009 Pew Research Center survey, 71 percent said that economic conditions in the country were “poor,” 24 percent said “only fair,” 4 percent said “good,” and less than 1 percent said “excellent.” By December 2015, only 28 percent said poor, 45 percent said fair, 24 percent said good, and 3 percent said excellent. The December figures were essentially identical to those in August 2004. Similarly, through 2014–15, fewer Americans said that they were “falling behind financially.” 6
Figure 2 also shows that these positive sentiments about the economy were broadly based in the electorate. Throughout 2015, much had been written about the challenges facing the middle and working classes. The middle class was described as “losing ground” and “falling behind financially” (Pew Research Center 2015). The working class was described as “feeling screwed” (Arnade 2015).
It was true that the income gains visible in Figure 1 were not evenly distributed across the electorate. As of 2014, real incomes for a majority of American families were still below their prerecession levels. This was particularly true among the lowest income group. 7 Consistent with this, Figure 2 shows that people with high incomes have had a more positive view of the economy relative to those with low levels of income.
But at the same time, evaluations of the economy among all of the income groups had become more positive since the end of the Great Recession. 8 While middle- and low-income households may have experienced the economic recovery differently than those with higher incomes, it was not evident in these data.
Indeed, what is distinctive about the Obama years—especially compared with the Reagan years—is how small the gap was between income groups. The average gap between upper and lower income groups in their opinions of economic performance from 1981 to 1988 was 21.3 points. From 2009 to 2015, it was 13.4 points. This was also lower than during the administrations of George H. W. Bush (14.7), Bill Clinton (16.7), and George W. Bush (18.4). Evaluations of the economy were more consistent across income levels under Obama than in recent history.
How can perceptions of the economy be so favorable, even among groups that had not yet recovered fully from the Great Recession? One explanation involves the Index of Consumer Sentiment, combined with the most recent trends in family incomes. The index asks respondents to evaluate their financial situation compared to a year ago. As of 2015, the trend in the previous year was positive: even if family incomes had not fully recovered from the recession, they were recovering nonetheless. There was a notable increase in the incomes of most income quintiles between 2013 and 2014, which likely continued into 2015 as well.
These short-term trends were especially important because of how the economy typically matters in elections. Previous research (e.g., Bartels 2008; Achen and Bartels 2016) shows that voters are much more sensitive to election-year trends in the economy than the economy’s long-term performance. This “myopia” means that even if many Americans’ incomes were below their prerecession levels, the positive trend would be more electorally consequential.
Thus, at the eve of the election year, Americans—including Americans of all income levels—were relatively optimistic about the economy. That they felt as positively as they did at the end of 1983 is particularly noteworthy. When Ronald Reagan ran for reelection in 1984, he contrasted the country’s economic growth to what it had been under Jimmy Carter in 1980. It was “morning again in America,” said one famous Reagan advertisement. The difference in 2015 is that it somehow did not seem like “morning” at all.
A Distinctly Political Dissatisfaction
Based on consumer sentiment alone, Americans seemed to think that better days were upon them or at least on the horizon. But people were not yet expressing an unguarded optimism. As of 2015, there were significant currents of dissatisfaction with the country, the federal government, and Barack Obama. This disjuncture between views of the economy and political attitudes is unusual. Typically, people’s perceptions of the economy loom large in their political attitudes. When they perceive that the economy is doing well, they evaluate elected officials more favorably (Stimson 2004). They trust the government more (Chanley, Rudolph, and Rahn 2000; Keele 2007). They think that the country as a whole is going in the right direction.
But as of 2015, increasingly favorable economic evaluations had not yet affected these other attitudes. There was instead a persistent mistrust in government, dissatisfaction with the overall state of the country, and disapproval of Obama. Figure 3 shows trends in these political attitudes. From 2009 to 2015, even as consumer sentiment was increasing, trust in government, the perception that the country is going in the “right direction,” and satisfaction with how things are going in the country were either stagnant or decreasing slightly. Fewer Americans believed that the country was going in the right direction at the end of 2015 than did so at the beginning of 2009—at the height of the Great Recession.
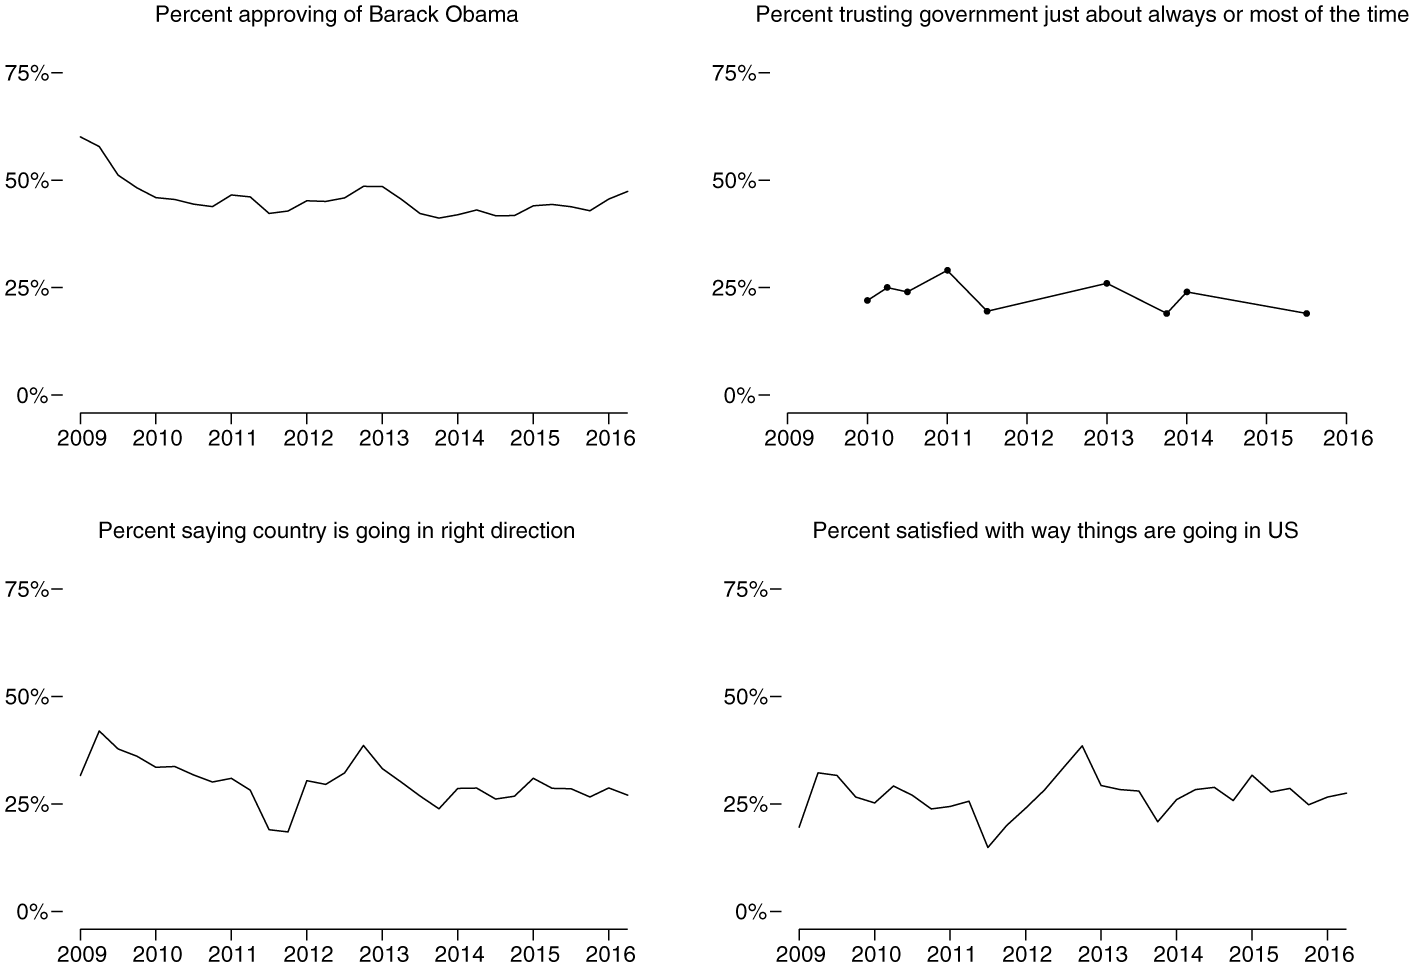
Trends in Presidential Approval, Political Trust, and Evaluations of Country, 2009–15
Even though economic evaluations at the end of 2015 were as positive as in the mid-2000s, fewer people said that the country was going in the right direction: 26 percent in the last quarter of 2015 as opposed to 40 percent in the third and fourth quarters of 2004. Trust in government was higher then, too: in a March 2004 Pew poll, 36 percent said they trusted the government just about always or most of the time, compared with 19 percent in fall 2014. 9
Other surveys showed a similar finding. In the Public Religion Research Institute’s American Values Survey, conducted in fall 2015, respondents were asked whether “America’s best days are ahead of us or behind us.” Americans were evenly divided, with 49 percent saying “ahead of us” and 49 percent saying “behind us.” In 2012, however, they were more likely to say “ahead of us” (54 percent) than “behind us” (38 percent). Remarkably, given their increasingly favorable views of the economy, 72 percent also said that the country was “still in a recession”—even in 2015. And 53 percent said that the “American culture and way of life has mostly changed for the worse” (Jones et al. 2015).
Americans’ ambivalence extended to Barack Obama as well. Four years prior, as 2011 came to an end, views of Obama were actually more positive than objective economic conditions and other factors would have predicted (Sides and Vavreck 2013). Four years later, as Obama entered the last year of his presidency, there was reason to believe that he would become even more popular. Although presidential approval typically declines the longer a president is in office, even after accounting for other factors (see Sides and Vavreck 2013, 20), Obama was presiding over a growing economy. The public’s increasingly positive evaluations of Obama could have translated into increasing approval ratings.
But as of the end of 2015, this had not happened. In fact, Obama has been the only president since John F. Kennedy whose approval ratings did not tend to increase alongside evaluations of the economy. Whereas in 2011 Obama was able to escape some of the blame for the Great Recession, in his second term, he seems to have also escaped the credit for the recovery. Figure 4 compares presidential approval and consumer sentiment for each president since Kennedy.
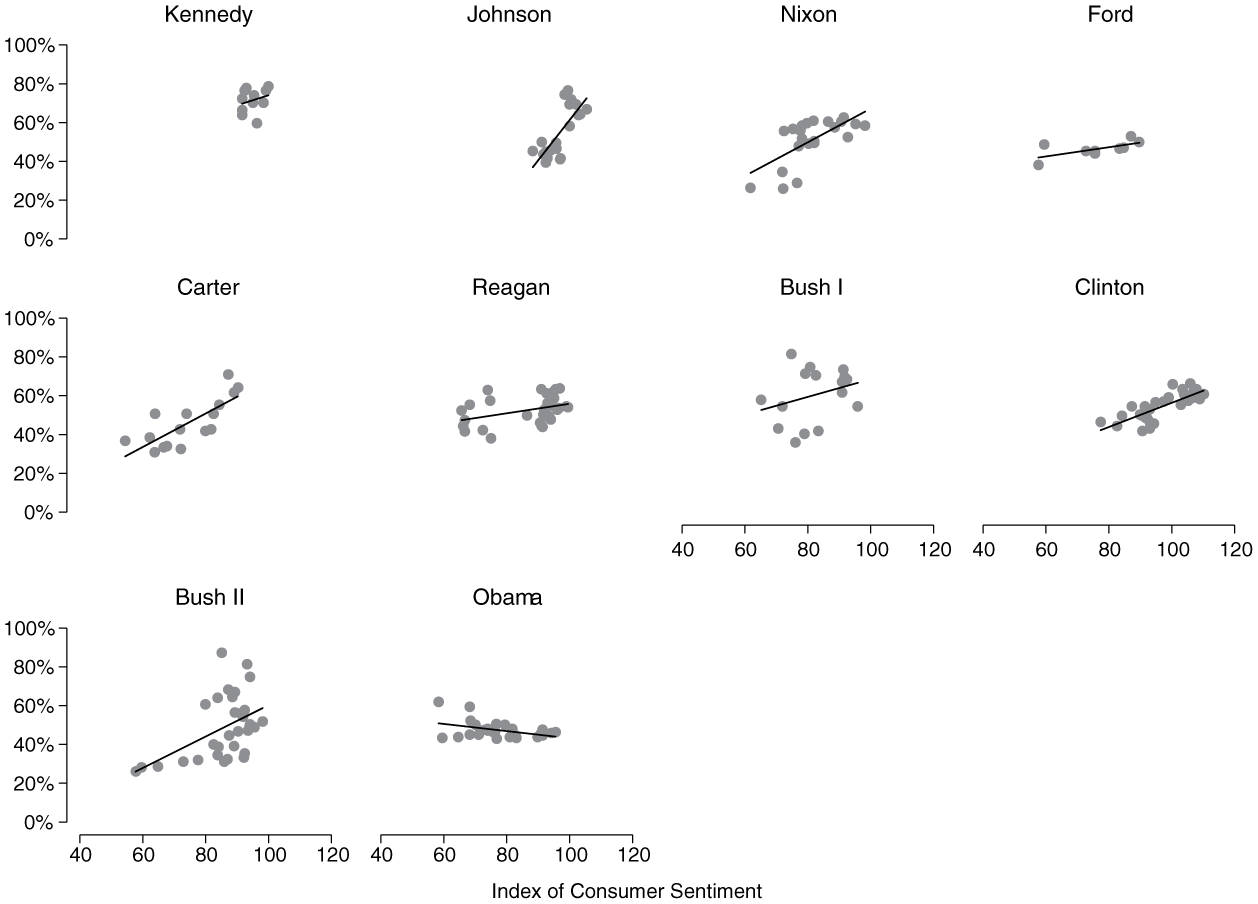
The Relationship between Consumer Sentiment and Presidential Approval
For every president except Obama, the relationship is positive: as consumer sentiment becomes more positive, so does presidential approval. In Obama’s case, the line is actually negative. Obama was relatively popular right after he was inaugurated—a brief honeymoon bump—but his approval rating fell quickly within his first several months in office. Even as economic evaluations began to improve, his approval barely budged. 10 If presidential approval were simply a function of consumer sentiment and nothing else, Obama should have been more popular than he was—approximately 11 percentage points more popular. But his approval ratings proved far stickier than consumer sentiment alone would predict. 11
Partisan Divides in the Electorate
One reason for the stickiness in Obama’s approval ratings was the partisan divide over his presidency. Partisan divisions in political attitudes are, of course, nothing new. These divisions have sharpened over many years as American political parties have become more ideologically sorted. Democrats are increasingly self-described liberals and Republicans are increasingly self-described conservatives (Levendusky 2009). The parties are also better sorted in terms of certain political issues, such as abortion (Adams 1997, Baldassarri and Gelman 2008).
Moreover, both Democrats and Republicans in the electorate are simply more hostile toward the opposite party. This growing hostility translates into opinions about everyday life: partisans are now more concerned that their son or daughter might marry someone in the opposite party (Iyengar, Sood, and Lelkes 2012). Experiments show that people are remarkably willing to discriminate against members of the opposite party (Iyengar and Westwood 2014) and even find members of the opposite party less physically attractive (Nicholson et al., 2016). This does not mean that the parties have become monoliths or that people have become orthodox liberals or conservatives. But it does mean that party differences and antagonisms are growing.
This trend was very much in evidence as the 2016 campaign began. Democrats and Republicans evaluated the country in different ways. Unsurprisingly, seven years of a Democratic president meant that Democrats felt far more positively than did Republicans. This was manifest in perceptions of the economy. Partisans typically think the economy is doing better when their party controls the White House. Some research also shows that this partisan bias increased substantially between 1985 and 2007, particularly during the Bush administration (Enns, Kellstedt, and McAvoy 2012). It then declined during the Great Recession, when the downturn was so severe that the vast majority of Americans—both Democrats and Republicans—evaluated the economy unfavorably.
But as the economic recovery proceeded, partisan bias reasserted itself and was very much evident in 2015. YouGov/Economist polls conducted between June and December 2015 found that Democrats believed their personal finances were doing much better than Republicans did. Among Democrats, 27 percent said that they were better off financially than a year ago, 48 percent said that their finances were about the same, and 20 percent said that they were worse off financially. By contrast, only 11 percent of Republicans said they were better off financially, while 43 percent said they were worse off.
This partisan divide was important enough to override the impact of social class. Although high-income people expressed more financial satisfaction than low-income people—among Democrats, Republicans, and independents alike—partisanship took precedence. In fact, Republicans in the highest income quintile, those making more than $100,000 per year, were actually slightly less satisfied than Democrats in the lowest income, those making less than $20,000 per year. Economic dissatisfaction was in large part a partisan phenomenon.
Democrats and Republicans also differed in their trust in government. Typically, Republicans’ trust in government depends a great deal on whether a Republican is in the White House. Democrats show some of this bias, but to a lesser degree (Hetherington and Rudolph 2015). As of February 2014, 33 percent of Democrats, but only 19 percent of Republicans, said that they trusted the government to do what was right just about always or most of the time.
Similarly, Republicans were far more pessimistic about the state of the country. In these YouGov/Economist polls, a whopping 87 percent of Republicans said that the country was on the wrong track. Only 38 percent of Democrats thought so, while the plurality (48 percent) thought the country was headed in the right direction.
Given the partisan polarization on these dimensions, it is hardly surprising that Republicans and Democrats had very different views of Barack Obama. Figure 5 shows the trend in presidential approval for every president from Truman to Obama—both for all Americans and for Democrats and Republicans separately. Obama stands out in two respects. First, his approval ratings were remarkably stable over time. The absence of a large-scale war, a foreign policy crisis, a major political scandal, or an economic recession that began under his watch meant that Obama’s approval ratings saw none of the wide swings that characterized the approval ratings of most previous presidents.
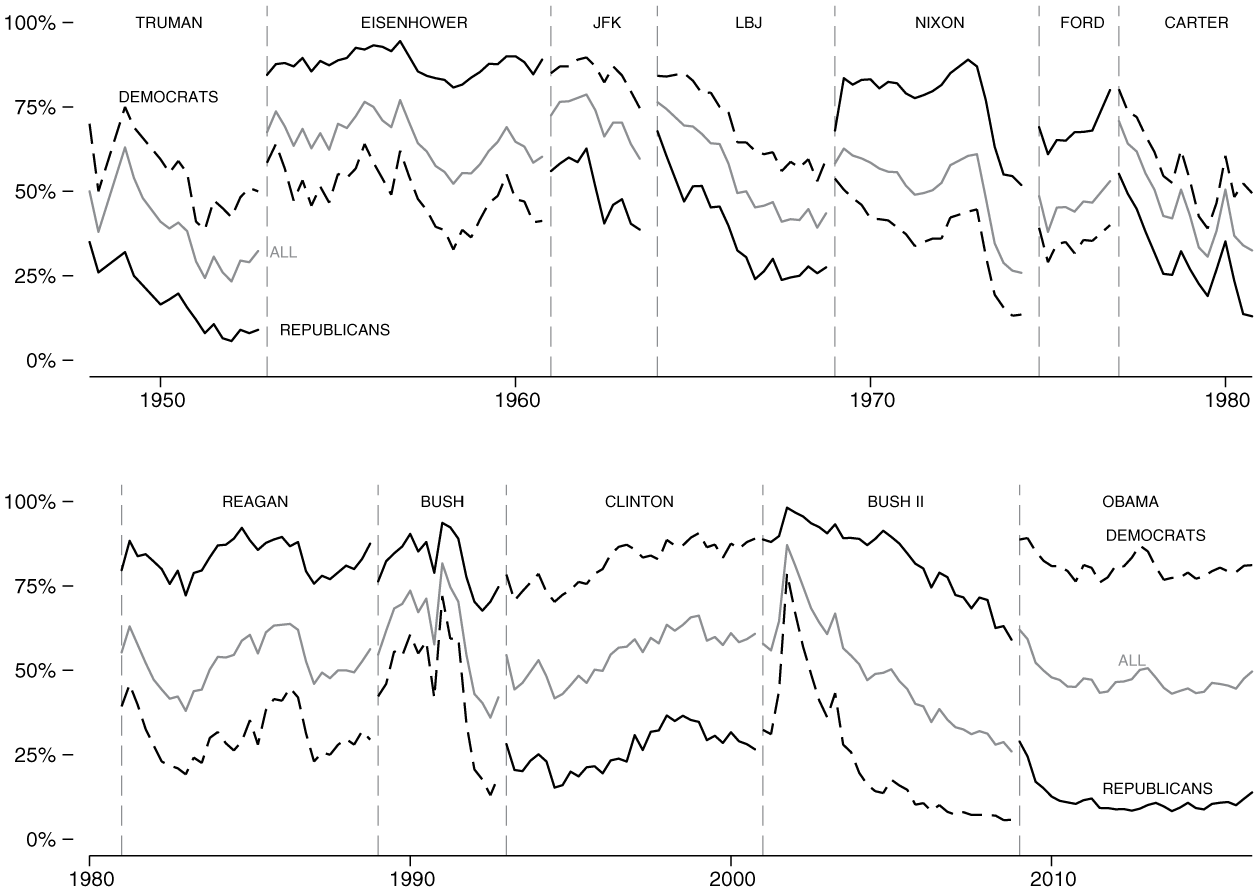
Trends in Presidential Approval by Party, 1948–2015
Second, partisan differences in assessments of Obama were larger than they had been for any previous president. On average, Obama’s approval rating among Democrats was nearly 70 points higher than his approval rating among Republicans. This was even larger than partisan differences during the administrations of George W. Bush (60 points) and Bill Clinton (55 points), both of whom held office when partisan polarization was increasing (Jacobson 2007).
This partisan polarization helps to explain why increasingly positive evaluations of the economy did not appear to improve Obama’s approval rating. Part of the reason is that the parties saw the economy differently. But another reason is that, in an age of polarization, Americans may give little credit to a president not of their own party. A good comparison is again to the last quarter of 1983, when consumer sentiment was essentially the same as at the end of 2015. At that point in time, 87 percent of Republicans approved of Reagan and so did 30 percent of Democrats. At the end of 2015, Obama’s support in his own party was almost as high (79 percent), but it was much lower among Republicans (10 percent)—exactly where it had been for almost six years.
Racial Divides in the Electorate
These partisan divides in the electorate were only part of the story, however. Eight years of a black president meant that the divides were also about race and ethnicity. Indeed, partisan divides in American politics have increasingly become racial and ethnic divides. That the 2016 election came at the end of Obama’s presidency in particular was crucial to the election. Eight years of an African American president magnified this “racialization” of politics.
To be sure, the roots of racialization were in place even before Obama became a national figure. Americans’ partisan attachments became more closely aligned with racial attitudes in the post–civil rights era as politicians from the two parties increasingly diverged in both their policies and rhetoric about race. Among white Republicans, racial resentment and opposition to preferences for blacks have increased, while these attitudes have become less common among white Democrats (Carmines and Stimson 1989; Stimson 2004; Valentino and Sears 2005; Tesler 2016). 12
But the presidential campaigns and administration of Barack Obama accelerated and intensified racialization. Among whites, attitudes such as racial resentment and opposition to affirmative action became tightly linked to partisanship (Tesler 2016). During the 2008 campaign, attitudes about African Americans were more strongly related to white Americans’ voting preferences than they had been in any modern election or than they would have been if Hillary Clinton or John Edwards had been the 2008 Democratic nominee (e.g., Jackman and Vavreck 2012; Kinder and Dale-Riddle 2012; Tesler 2016; Tesler and Sears 2010).
Racialization affected more than evaluations of just Barack Obama. Attitudes toward a whole host of issues or people linked to Obama became more influenced by both racial attitudes and race—a phenomenon termed the “spillover of racialization” (Tesler 2016; see also Henderson and Hillygus 2011; Knowles, Lowery, and Schaumberg 2010). Even racial attitudes that had never divided white Democrats from white Republicans became polarized by partisanship after Obama took office. Figure 6 shows that white Republicans were significantly more likely than white Democrats both to evaluate whites more favorably than blacks and to oppose interracial dating.
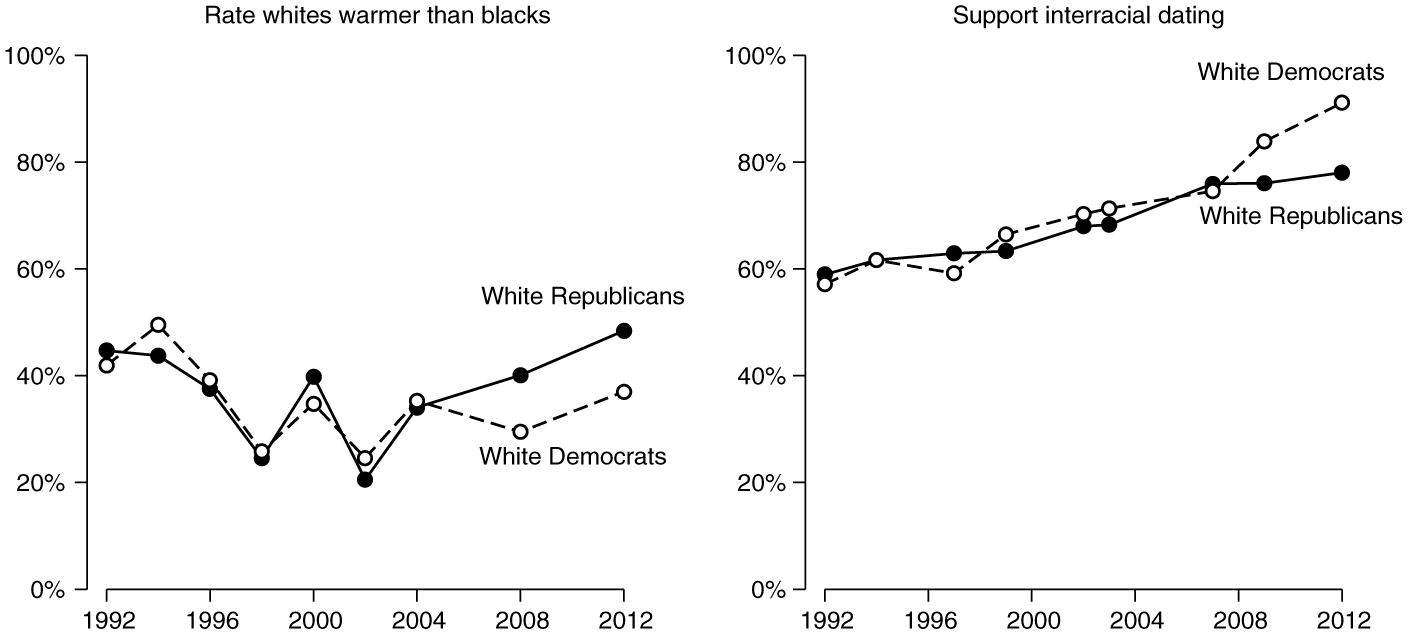
Growing Partisan Divisions on Racial Attitudes
Racialization in the Obama era also had implications beyond the attitudes of whites toward blacks. Because Obama was repeatedly characterized as Muslim or foreign-born, a general aversion to all minority groups, and to Muslims in particular, became more strongly correlated with white Americans’ voting preferences in both the 2008 and 2012 presidential elections (Kam and Kinder 2012; Tesler and Sears 2010; Tesler 2016). Consequently, Democrats and Republicans became increasingly divided in their attitudes about Muslims. Figure 7 shows, for example, that the percent of Republicans rating Muslims favorably fell during Obama’s presidency, while the percent of Democrats rating Muslims favorably rose. 13
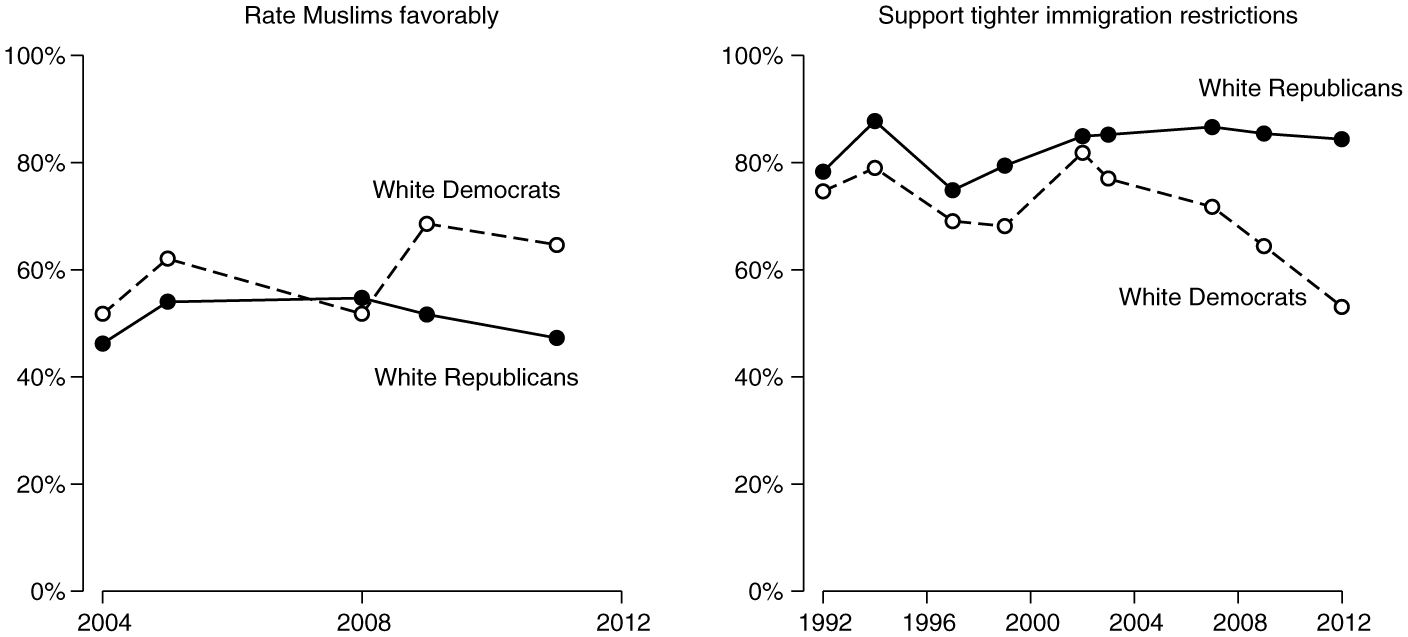
Growing Partisan Divisions on Attitudes toward Muslims and Immigration
Racialization also had implications for attitudes toward immigration. Figure 7 shows growing partisan polarization on whether there should be tighter restrictions on immigration. The trend is more evident among white Democrats than white Republicans, but other questions show changes in the views of Republicans as well. For example, Republicans’ feelings toward undocumented immigrants became less favorable in the Obama years (see also Abrajano and Hajnal 2015).
The growing alignment between party identification and attitudes about racial and ethnic issues occurred alongside important trends in the party identification of nonwhites. That the electorate is becoming less white is well known, and this trend seems certain to continue. It has been less certain, however, whether most nonwhites would become consistently aligned with one political party (Hajnal and Lee 2011).
In the years leading up to 2016, the answer became clearer: nonwhites began to move strongly toward the Democratic Party. The percentage of Asian Americans voting for Democratic presidential candidates increased sharply (Ramakrishnan 2012). An increasing number of Latinos also identified with the Democratic Party during Obama’s presidency. Latinos were 15 percentage points more Democratic in 2012 than they had been on average from 2002 to 2007. 14 This increase was most heavily concentrated among Hispanics who felt cooler toward whites (Tesler 2016), as Latinos increasingly viewed Republicans as a party of whites.
The Democratic Party further solidified its support among blacks as well. In the two decades leading up to Obama’s presidency, black identification with the Democratic Party had actually declined (Hajnal and Lee 2011). This trend reversed itself after 2008: African Americans were upward of 10 percentage points more Democratic than they had been before Obama’s election (Hajnal and Lee 2011; Jones 2014).
These racial divides in the electorate mattered a great deal to the landscape of the 2016 election. For one, race helps to explain apparent voter anger as well as the disjuncture between a growing economy and Obama’s approval rating. Racial attitudes evoke angry emotions in ways that other political attitudes do not (Banks 2014). The fact that race and racial attitudes were more strongly associated with evaluations of the economy during Obama’s presidency (Tesler 2016) may help to explain why many in the country were angry despite a growing economy.
For another, the growing nonwhite portion of the electorate—combined with its growing attachment to the Democratic Party—was reshaping the nature of the party coalitions. In 2008 and 2012, nearly half of Obama supporters were nonwhite. The previous Democratic president, Bill Clinton, won two terms with a coalition that was only one-quarter nonwhite (Abramowitz 2014).
Even without Barack Obama on the ballot in 2016, trends in previous decades—trends that only accelerated when Obama was president—made issues concerning race, ethnicity, and religion central to the strategies of the 2016 presidential candidates and immanent in the election-year discourse.
The Implications for 2016
In the months leading up to the 2016 campaign, there was an undercurrent of pessimism in the Republican Party. In early 2014, some party strategists seemed to think the presidential election was out of reach. In a piece titled “The Republican Party’s Uphill Path to 270 Electoral Votes in 2016 Elections,” the Washington Post’s Dan Balz (2014) wrote: “A recent conversation with a veteran of GOP presidential campaigns raised this question: Which, if any, of the recent battleground states are likely to become more Republican by 2016? The consensus: very few.” By fall 2015, at least some conventional wisdom still favored the Democrats. Bloomberg’s Mark Halperin (2015) declared “The Most Likely Next President Is Hillary Clinton.”
Others agreed. Forecasts based on betting markets—which have historically performed well in predicting election outcomes—consistently favored the Democrats. At the end of 2015, these prediction markets put the Democrat’s chance of victory at more than 60 percent. A January 2016 survey of seventeen academic experts on elections by the site PollyVote was similarly bullish about the Democratic Party’s prospects for victory in November (Graefe 2016). Their survey predicted a four-point Democratic victory, with only one expert out of seventeen expecting the Republicans to win back the White House.
What is fascinating about these predictions is that they did not necessarily align with the traditional fundamentals of presidential general elections. One of these fundamentals is the national economy. Incumbent presidents, or their party if the president is not running, tend to do better when the economy is improving. The trend in the economy is the most important, and in particular the trend in the election year. Figure 8 provides a demonstration, showing the strong correlation between election-year changes in gross domestic product and real disposable income and the incumbent party’s share of the major-party vote.
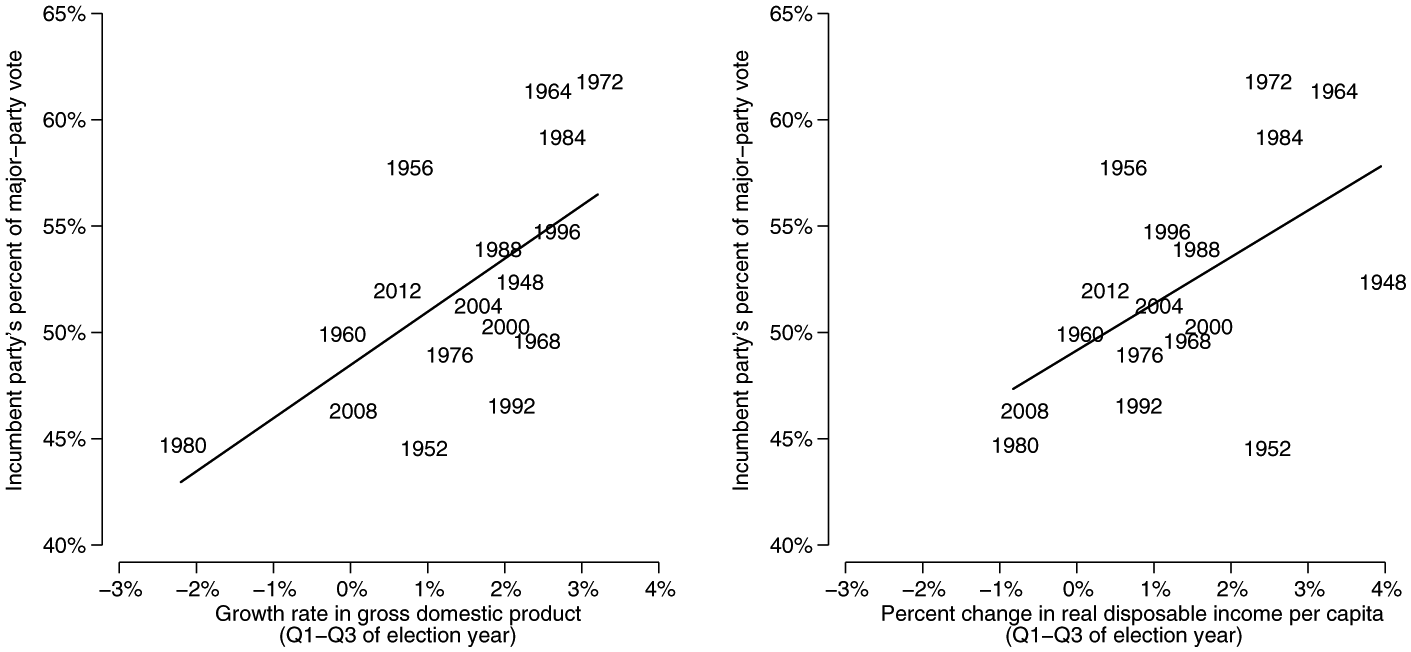
The Relationship between Economic Growth and Presidential Election Outcomes
A second fundamental is related: the incumbent president’s approval rating. Even if the president is not running, he casts a long shadow over the race. In 2016, higher approval ratings for Obama would buoy his party’s chances, other things equal. A third factor presented Democrats with a major disadvantage going into the election year: their party was running for a third consecutive presidential term in office. Across time and space, the longer a party has been in power, the less likely citizens are to vote for its candidates (Achen and Bartels 2016; Nannestad and Paldam 2002; Paldam 1986; Wlezien, forthcoming). Alan Abramowitz (2008) has described this phenomenon in U.S. presidential elections as the “time for a change” factor. The “time for a change” penalty may derive in part from the fact that public opinion typically moves in the opposite direction as the president is pushing public policy. Over two terms, the gap between the president’s policies and public opinion will grow even further.
To understand the effect of these factors, we estimated a simple statistical model of the incumbent party’s percent of the major-party vote in presidential elections from 1948 to 2012. We include a measure of economic growth (the change in gross domestic product from the first quarter to the third quarter of the election year), the president’s approval rating as of June of the election year, and whether the incumbent party had served one term or two or more terms in the White House.
The results are intuitive. For every percent increase in gross domestic product over these quarters, the incumbent party’s share of the vote increases by 1.7 points. For every five-point increase in presidential approval, the incumbent party’s vote share increases by 1.0 point. The “time for a change” factor imposes a significant penalty: an incumbent party seeking a third (or greater) term receives 3.7 points less of the vote. 15
If we assume that the election year would resemble the end of 2015—when gross domestic product had grown by about 0.74 percentage points in the last two quarters of the year, and when Obama had an approval rating of about 45 percent—this model would actually favor the Republican candidate. The predicted vote share of the Democratic candidate would be 48 percent. To be sure, the forecast comes with uncertainty: the 95 percent confidence interval spans 41 percent to 58 percent. But a 48 percent vote share still implies that the Republicans’ chances of victory would be well above 50 percent—closer to 75 percent, in fact.
The same finding emerges if we substitute a different measure of the economy—change in real disposable income per capita from the first to third quarters of the election year. Assuming that disposable income would grow as fast as it did in the last two quarters of 2015 (just under 1 percent), this model predicts a somewhat closer election, with the Democratic candidate winning 49 percent, but this would still imply that the Republican candidate had about a 62 percent chance of winning.
There is nothing magical about this kind of forecasting model or any such model (for an excellent critique and extension, see Lauderdale and Linzer 2015). We do not believe that such models are perfect predictors, tell us everything about presidential elections, or imply that the campaign is irrelevant. Figure 8, for example, shows that election outcomes vary quite a bit from a prediction based solely on changes in the economy.
But these models do provide a useful baseline. It is significant, then, that so many observers were more bullish on the Democrats than these fundamentals would suggest, based on at least the past seventeen presidential elections. What might create this discrepancy?
One potential factor is the changing demographic composition of the electorate. White Americans were expected to compose only about 70 percent of the electorate in 2016—a 13 percentage-point decline since Bill Clinton won reelection in 1996. Much of that decline was due to the expanding Latino and Asian American shares of the electorate. And with both Latinos and Asian Americans around 30 percentage points more likely than whites to have voted Democratic in 2012, the changing demographic compositions of the electorate may put the Democrats at a greater advantage than they had been in recent elections.
The question, however, is whether increased Democratic support from nonwhite voters may be offset by greater Republican support and higher turnout from whites (see Enos 2015; Bartels 2014). In 2015, however, the prevailing concern was that Republicans would be on the losing end of the country’s changing demography. As Republican Senator Lindsay Graham put it in June 2015, “My party is in a hole with Hispanics—the first rule of politics when you’re in a hole is stop digging” (Rappeport 2015).
Conclusion
In early 2016, two Washington Post writers, David Maraniss and Robert Samuels, set out to gauge the mood of Americans by traveling the country for more than a month. What they found was much more than simple “anger.” What they found sounded like ambivalence: For every disgruntled person out there who felt undone by the system and threatened by the way the country was changing, caught in the bind of stagnant wages or longing for an America of the past, we found someone who had endured decades of discrimination and hardship and yet still felt optimistic about the future and had no desire to go back. In this season of discontent, there were still as many expressions of hope as of fear. On a larger level, there were as many communities enjoying a sense of revival as there were fighting against deterioration and despair.
This is precisely what we have documented in a quantitative fashion. The economy has improved since the Great Recession, and voters realize it, but their assessments of Barack Obama and the country as a whole were less favorable than the economy alone might have predicted.
Underlying dissatisfaction with Obama, and part of any broader anger in the electorate, were both political partisanship and race. Republicans felt less favorably about the economy than did Democrats, and their persistent disapproval helps to explain why Obama’s approval ratings were so stable even as the economy improved.
Moreover, under Obama partisanship, many other attitudes had come to be increasingly correlated with race and racial attitudes. The Democratic Party increasingly comprised racially liberal whites and minorities. The Republican Party increasingly comprised people who were unfavorable toward African Americans, immigrants, and Muslims.
These factors clearly resonated in the 2016 presidential primaries. In the Republican primary, Donald Trump drew support from Republicans who were anxious about their financial situation as well as Republicans who expressed less favorable views of many different minority groups than and anxiety about the status of whites (Sides and Tesler 2016; Tesler and Sides 2016; Pew Research Center 2016). Some other Republican candidates, notably Ted Cruz, also took quite conservative positions on immigration. To Republicans like Lindsay Graham, this was evidence that some Republicans were still digging that hole.
Meanwhile, a Democratic coalition comprising racially liberal whites and minorities meant that the Democratic presidential candidates did not have to soft-pedal racial issues to avoid alienating white swing voters, as was typical even as late as the 1990s (see Kinder and Dale-Riddle 2012). Hillary Clinton and Bernie Sanders ran to Barack Obama’s left on matters of racial equality, with Clinton even repudiating some of Bill Clinton’s criminal justice and immigration policies for their adverse effects on racial and ethnic minorities.
Looking toward the general election, the American public’s ambivalence, coupled with the challenge of winning a third term, should have made the election a toss-up and perhaps even given the Republicans the advantage. But Democrats also seemed poised to benefit from an increasingly diverse electorate, thanks to two mutually supportive trends—the growing divide between Democrats and Republicans on racial issues and the movement toward the Democratic Party among nonwhite voters. Perhaps for this reason, many observers and forecasters gave the Democratic Party an edge early in the election year. Were that Democratic advantage to persist, it would produce a striking irony: an allegedly rebellious and angry electorate seeking “a major reset” ended up returning the incumbent party to the White House for a third term.
Footnotes
NOTE:
We thank Larry Bartels and the other contributors to this volume for helpful suggestions. We are equally grateful to Vanderbilt University’s Center for the Study of Democratic Institutions, which hosted us at a critical juncture in the writing of this article.
Notes
John Sides is an associate professor of political science at George Washington University. He is coauthor (with Lynn Vavreck) of The Gamble: Choice and Change in the 2012 Presidential Election (Princeton University Press 2013) and various articles on public opinion, campaigns, and elections. He is cofounder of The Monkey Cage, a Washington Post blog about political science and politics.
Michael Tesler is an assistant professor of political science at University of California, Irvine, and author of Post-Racial or Most-Racial: Race and Politics in the Obama Era (University of Chicago Press 2016) and coauthor of Obama’s Race: The 2008 Election and the Dream of a Post-Racial America (University of Chicago Press 2010). He is a contributor to The Monkey Cage, a Washington Post blog about political science and politics.
Lynn Vavreck, a professor of political science and communication studies at University of California, Los Angeles, and contributing columnist to The Upshot at the New York Times, is a coauthor (with John Sides) of The Gamble: Choice and Chance in the 2012 Presidential Election (Princeton University Press 2013), and the author of The Message Matters (Princeton University Press 2009) about presidential campaigns from 1952 to 2008. She is an inaugural Andrew F. Carnegie Fellow.