
Abstract
Scholars routinely cite the landslide defeats of Barry Goldwater and George McGovern as evidence that American electorates punish extremism in presidential politics. Yet systematic evidence for this view is thin. In this article we use postwar election outcomes to assess the electoral effects of extremism. In testing ten models over the seventeen elections, we find scant evidence of extremism penalties that were either substantively large or close to statistical significance.
Political narrative and scholarly theory claim that voters exact a penalty on ideologically extreme candidates. In the wake of the 2016 Iowa primary, the Washington Post editorial board suggested that Ted Cruz and Bernie Sanders were too extreme for general election voters. Pundits routinely invoke Barry Goldwater and George McGovern as cautionary figures: candidates destined for landslide defeat due to their ideological extremism. This conventional wisdom finds theoretical support in the median voter theorem, a classic model of candidate positioning that demonstrates that if voters favor a candidate with views closest to their own, a candidate can always capture more votes by moving toward the center, away from the extremes. 1
Yet evidence that extremism has mattered in presidential elections is thin. Indeed, while a great deal of attention is paid to candidate ideology during the course of a campaign, there is scant evidence that ideological position helps to predict electoral outcomes. Models based on data from the postwar elections have been able to explain much of the variation in presidential vote outcomes with just a few fundamental variables, but ideological extremism is not among them. 2 In this article, we build on two leading models of the presidential vote to learn how a candidate’s relative ideological location fares as a predictor of electoral performance, given political and economic fundamentals. Our results do not support the idea that the relative ideological location of candidates is an important factor in predicting presidential elections.
The remainder of this article is organized as follows: First, we describe the two models we take as our starting point: Christopher Achen and Larry Bartels’s (2016) “musical chairs” model and Douglas Hibbs’s (2012) “bread and peace” model. We then introduce our measures of candidate ideological location and explain the construction of five variations of an incumbent party relative candidate extremism variable based on these measures. Next, we present our analysis, examining the relationship between relative candidate extremism and presidential vote outcomes when the fundamental “musical chairs” and “bread and peace” variables are taken into account. We then provide some context to help gauge the importance of this relationship. We conclude with a discussion. Full replication files—from raw data to results—are available elsewhere. 3
Baseline Models
We make use of two well-established models of presidential vote outcomes to create a baseline context within which to evaluate the role of candidate ideology: Achen and Bartels’s (2016) “musical chairs” model and Hibbs’s (2012) “bread and peace” model. Both models account for a great deal of the variation in presidential vote outcomes over the years with just two variables, one political and one economic. The political variable in musical chairs is incumbent party tenure; the political variable in bread and peace is war casualties. For the economic variable, both models employ change in real disposable income (RDI), which Hibbs describes as “the broadest single aggregate measure of changes in the electorate’s economic well-being” (2012, 635). 4 As described below, the two models differ dramatically on how far back into a presidential term the voter’s economic memory reaches.
The “musical chairs” model
Achen and Bartels (2016) ground their model in two main ideas. First, they maintain that voters focus on their own wallets in deciding how to vote, but have a very short memory—voters consider only the most recent economic past. To incorporate economic performance in their model, Achen and Bartels test the predictive power of different configurations of quarterly RDI data. They find that presidential vote outcomes most closely correspond with economic growth in the six months immediately preceding the quarter in which the election is held. The best fit of the model is obtained when using RDI data only from the 14th and 15th quarters of a presidential term—adding RDI data from any other quarter weakens the model performance.
Second, Achen and Bartels (2016) note the strong tendency of the American electorate to tire of an incumbent party over time. As a party accrues years in the White House in a continuous stretch, that party’s vote share in presidential elections falls (Bartels and Zaller 2001; Mayhew 2008; see also Abramowitz 1988; Bartels 1998; Stokes and Iversen 1962). Achen and Bartels thus include the incumbent party’s years in control of the presidency as the second variable in their model. Exactly what the variable signifies is not clear, but it may represent many things: the exhaustion of the governing party’s agenda, the eagerness of the opposition to do whatever it takes to win, or a predilection of voters for change.
The dependent variable in musical chairs is incumbent party vote margin, in percentage points, in the U.S. presidential elections from 1952 to 2012. Third-party votes are implicitly included in this measure, which is calculated as (incumbent party percent of the vote) − (challenging party percent of the vote).
The “bread and peace” model
Hibbs (2012) proposed his bread and peace model in 1983 and has used it regularly to forecast and explain presidential elections. While Hibbs, like Achen and Bartels (2016), also employs change in RDI to measure economic performance, bread and peace allows RDI growth from every quarter of a presidential term to factor into the model, albeit discounted over time so that earlier quarters carry less weight. Hibbs applies a decay parameter—λ, estimated within the model as a number between 0 and 1—to progressively discount economic growth in earlier quarters of the presidential term. This discounting takes the following form: Because the election is held one-third of the way through the 16th quarter of a presidential term, RDI growth in this quarter is down-weighted by 1/3 * λ0. The 15th quarter of the presidential term is down-weighted by λ1, the 14th quarter by λ2, and so on for the preceding quarters. The closer the estimate of λ is to 1, the smaller the time decay, so that if λ = 1, economic growth in earlier quarters would matter just as much as economic growth immediately before the election; the closer the estimate of λ is to 0, the greater the time decay.5, 6 Bread and peace consistently estimates λ to be about .9, making the voter’s economic memory very long, as opposed to the short-term memory seen in musical chairs.
The bread and peace model includes a penalty for going to war as the other fundamental determinant of presidential vote outcomes. This variable is measured in the number of U.S. military fatalities per millions of U.S. population during the presidential term. This penalty is applied only for unprovoked, hostile deployment of U.S. military forces. In the 2004 election, for example, the penalty is assessed for the invasion of Iraq, but not Afghanistan, the latter considered to be provoked by the attacks of September 11, 2001. The penalty applies to the party of the president initiating the commitment of forces, and after a one-term grace period, to the party of presidents inheriting such a conflict.
The dependent variable in bread and peace is the incumbent party’s share of the two-party vote in the presidential elections from 1952 to 2012. The measure is calculated as: 100*(incumbent votes / (incumbent + challenger votes)).
Candidate Ideology
The purpose of this article is to evaluate the importance of candidate extremism in predicting presidential vote outcomes when other factors, which are well established as fundamental to presidential vote outcomes, are taken into account. The two models described in the previous section provide a baseline for this analysis.
In this section, we describe our measurement of relative candidate extremism. Candidate extremism is at the heart of our analysis, but difficult to measure. To guard against vagaries introduced by any single construction, we build and test five different measures of relative candidate extremism. In the first subsection, we describe three methods of measuring candidate ideological location—that is, where each candidate would fall on a spectrum from liberal to conservative. Then, in the second subsection, we calculate relative candidate extremism from these location measures. The relative extremism score characterizes how ideologically extreme the incumbent party candidate is relative to the challenging candidate, so that each pair of opposing candidates receives a single score. We use two different methods of calculating relative extremism; applied to the different location measures, this results in five variations of the incumbent party relative candidate extremism measure.
Ideological location measures
Our broadest measure of candidate ideological location combines information from two recognized scales: Steven Rosenstone’s (1983) political location scores, and the American National Election Studies (ANES) candidate ideology placement. With these two scales, we can measure the positions of both major party candidates in each election from 1948 to 2012.
Rosenstone (1983) was the first to study effects of the political positions of presidential candidates across a series of elections. To measure these positions, Rosenstone asked a group of American politics scholars and graduate students to place the nominees of each party on 100-point scales denoting policy position. For elections from 1948 to 1980, Rosenstone obtained candidate ratings on two axes, one denoting New Deal liberalism and the other racial liberalism. We use the average of the two ratings in our analysis as a measure of the general ideological location of candidates.
As Rosenstone’s measure ends at 1980, we splice in a scale from the ANES to bring our measure up to 2012. Since 1972, the ANES has asked respondents to place candidates on a 7-point scale, from one (extremely liberal) to seven (extremely conservative). The Rosenstone and ANES ratings overlap for three elections. Following Zaller (2003), we use this overlap to rescale the Rosenstone measure, mapping the earlier Rosenstone scores to the 7-point ANES scale. For our measure, we recenter this scale so that it ranges from −3 as the most liberal score to +3 as the most conservative score.
Our first two measures of candidate ideological location use these spliced ANES/Rosenstone scores. We use the rescaled Rosenstone scores for the presidential elections from 1948 to 1968, and mean candidate placements by ANES respondents for the elections from 1972 onward.
Our first and most basic measure of location uses the mean candidate placements from among all self-described presidential election voters in the ANES samples. Our second measure of candidate location refines the ANES ratings in two ways. First, we use only the ratings of respondents who scored in the upper quartile of a three-item measure of political information. The three items, common to all ANES surveys in this study, were knowledge of which party is more conservative, knowledge of which party has a majority of members in the House of Representatives, and interviewer rating of respondents’ general level of political information. Then from these well-informed placements we estimate candidate ratings that are purged of partisan bias.
Bias arises from the fact that ANES respondents who self-identified as partisans rated candidates from their own party as less ideologically extreme. That is, respondents who identified as Republican placed Republican candidates closer to the center of the ideology scale than they placed Democratic candidates, and respondents who identified as Democrat exhibited the opposite pattern of candidate placement. Using the response data from all self-described voters in the upper 25 percent of the political information score, we employ a simple model 7 to estimate candidate ideological locations that represent the placements by self-identified independent voters. Our second measure of candidate ideological location thus approximates ratings by well-informed nonpartisan voters. This measure generates about 50 percent more year-to-year variation in perceived candidate location than our first measure, which uses the mean ratings by all self-described voters.
Figure 1 plots candidate locations from the refined measure. The y-axis shows ideological locations in units of the 7-point ANES scale (centered on 0). The x-axis shows election years. As noted above, candidate scores in the elections from 1948 through 1968 are based on the Rosenstone scores recalibrated to the ANES scale. In the measure shown here, candidate scores from 1972 on are based on refined ANES candidate placements: estimates of well-informed, nonpartisan voter ratings. Democratic candidates are represented by solid points; Republican candidates are represented by clear points.
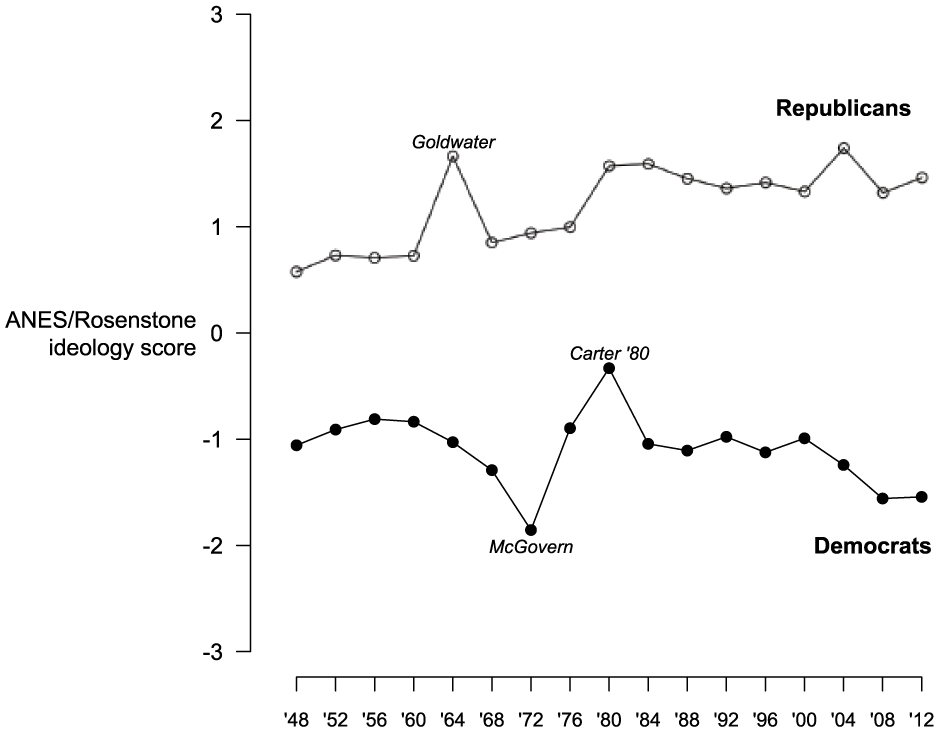
Candidate Positions on ANES/Rosenstone Ideology Scale, 1948–2012
The most notable feature of Figure 1 is the gap between the two parties. Voters, at least the informed and centrist voters driving these ratings, see a large difference between party candidates and comparatively small differences among party candidates. Most of the ratings are consistent with conventional understanding, but some merit notice. George W. Bush’s rating changed between his first and second elections. Calling himself a compassionate conservative, he was rated in 2000 as a typical conservative Republican; indeed, he was rated slightly more moderate than the median of all Republican nominees in the entire period. After four years of ideological struggle in Washington, Bush was perceived as the most conservative of all GOP nominees in our dataset. Among Democrats, Carter is notable for being rated as more conservative in his second election, probably due to the challenge for renomination he faced from the Left wing of his party. Finally, Obama’s rating in 2008 is the second most extreme Democratic position in the data—perhaps surprising given that Obama ran on promises of avoiding partisanship.
Our first two measures of candidate location, based on the ANES/Rosenstone ratings, deal in perceived rather than actual ideological location. For our third measure of ideological location we turned to NOMINATE scores, 8 which are rooted in actual positions legislators and presidents have taken. NOMINATE scores are available only for candidates who have supported or opposed legislation in the form of roll call votes (as a legislator) or Congressional Quarterly’s presidential support votes (as president). For eight of our seventeen elections, both candidates have NOMINATE scores as either a legislator or as president. 9 In these eight cases, we can use NOMINATE scores as a measure of candidate ideological location from which to calculate a relative candidate extremism score.
Figure 2 compares the ANES/Rosenstone scores with the NOMINATE scores. The correlation between the two series is +.97, but much of this high value is due to party difference. If the absolute values of the two measures are correlated, the value is +.75. Whether a correlation of .75 is reassuringly high or disappointingly low is hard to say, but it seems high enough to validate both measures as worth taking seriously.
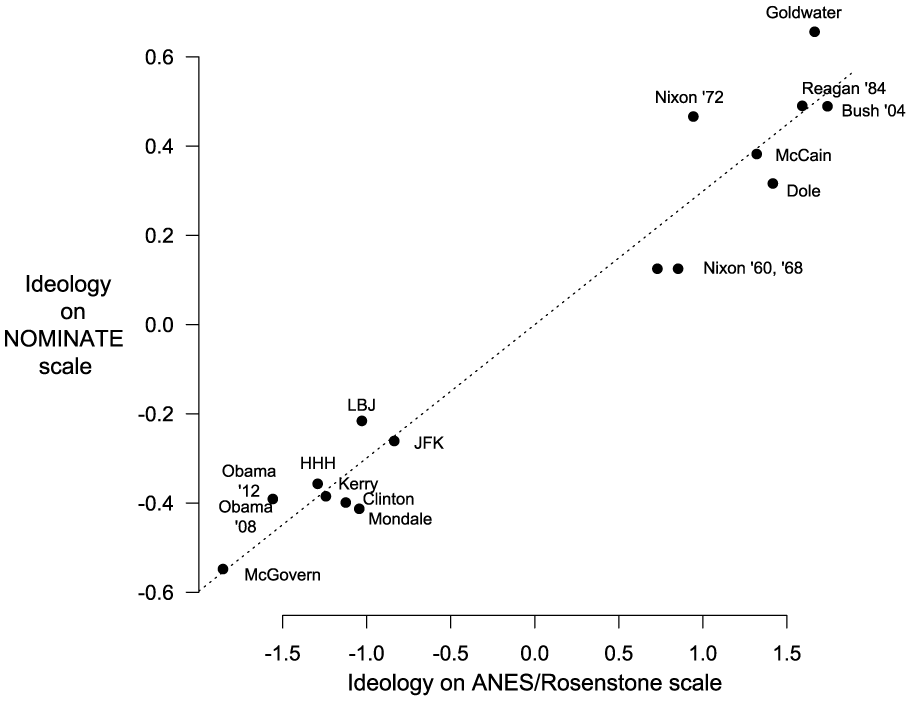
Ideology on NOMINATE and ANES/Rosenstone Scales
Relative candidate extremism variable
In this section we explain how we use the three measures of candidate ideological location to calculate relative candidate extremism scores. We use two different methods of calculating relative extremism.
The first method relies on the midpoint of the ideology scale as the reference point for determining relative extremism. The Rosenstone, ANES, and NOMINATE scales all have natural midpoints, halfway between most liberal and most conservative. 10 Rosenstone obtained his ratings on a 0 to 100 scale, which makes 50 an implicit moderation point. The NOMINATE scale has an implicit moderation point at 0, with liberal positions scored as negative and conservative positions scored as positive. The ANES uses a 7-point scale with an explicit moderation point at the middle position, described to respondents as “moderate or middle-of-the-road.”
On both the ANES/Rosenstone and the NOMINATE measures of ideological location, liberal positions are scored as negative and conservative positions are scored as positive. The dependent variable in the musical chairs and bread and peace models, however, is based on the incumbent-party vote (rather than the Democratic party vote, for example). This means that we must construct the incumbent-party candidate’s relative extremism for each election. To do this, we first transform our scale so that positive numbers represent incumbent-party candidates’ ideology (rather than conservative candidates’ ideology), and negative numbers represent challenging-party candidates’ ideology (rather than liberal candidates’ ideology). 11 Then we take the midpoint between each set of opposing candidates to arrive at a single relative candidate extremism score for each election. With this transformed scale, positive values of our relative candidate extremism variable indicate that the incumbent-party candidate is more extreme than the challenger; negative values indicate that the challenger is more extreme than the incumbent.
An alternative approach is to use the mean of voter ideology, rather than simply the midpoint of the ideological location scale, as the reference point for determining relative extremism. From 1972 onward, a suitable measure of voter ideology is available in the ANES 7-point measure of ideological self-placement. The stem for this question is the same as the one used in candidate placement. Based on the self-placement and two candidate placement scales—all recentered to a range of −3 to +3—we measure relative incumbent extremism as follows:
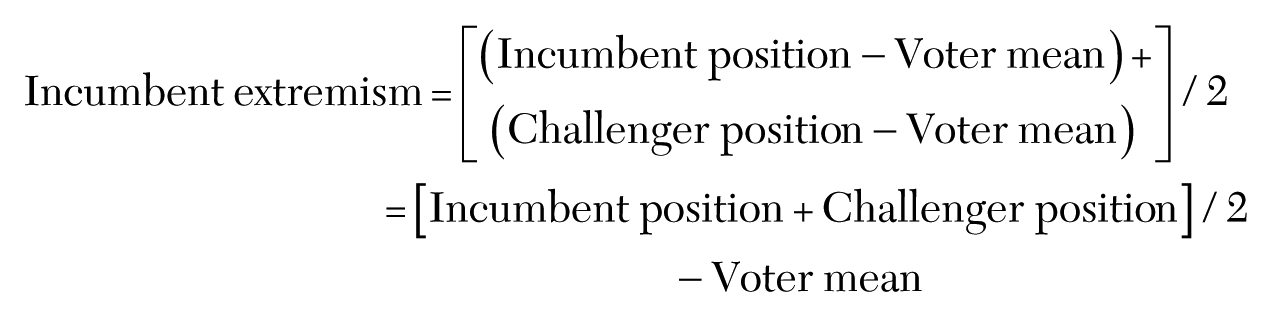
In the special case in which mean voter ideology is 0, this second method of calculating relative candidate extremism reduces to the first.
Because opinion surveys since the late 1940s have found that more Americans identify as conservative than as liberal, the question arises, Why consider the first approach to measuring candidate extremism at all? Should not extremism always be measured as departure from the mean position of voters rather than an implicit and perhaps artificial zero point?
Despite the common-sense appeal of using mean voter ideology as a reference point for candidate extremism, an argument can be made that using zero as the reference point might be preferable. Even though more Americans call themselves conservative than liberal, a large number do not view themselves as either. The modal self-placements of voters are as middle-of-the-road or centrist, an identification selected by about 25 percent of voters in the 1992 ANES survey. An additional 20 percent said they did not know or had not thought about their ideology. And these figures still understate the weakness of many Americans’ sense of ideology. When 1992 voters were asked their position on the ANES liberal-conservative scale in two different surveys, only about one-third stated a position on the same side of center in both interviews. 12 These data suggest that a majority of American voters are close to the middle of the ideological spectrum—if they have firm ideological views at all.
In light of the difficulties of measuring public opinion, and without a clear rationale for preferring either a zero-centered or a voter-mean-centered reference point, we test both methods for calculating relative candidate extremism. From the ANES data, we can calculate zero-centered and voter-centered relative candidate extremism measures for elections from 1972 to 2012. We can also calculate a zero-centered measure of relative NOMINATE extremism, but lacking a measure of voter location on the NOMINATE scale, we cannot build a voter-centered NOMINATE measure. We thus arrive at five measures of relative incumbent extremism, each of which can be tested in the musical chairs and bread and peace models. By testing the measures in these models, we control for the political and economic fundamentals that also influence outcomes, thereby increasing the likely precision of our tests. In testing five measures in each of the two models, we have a total of ten tests of voter sensitivity to extreme candidates in presidential elections.
Analysis
In this section, we present our results on the relationship between our measures of incumbent party relative candidate extremism, as developed in the previous section, and the incumbent party’s vote share. We begin with bivariate correlations among the key measures. We then present a visual juxtaposition of two relationships: the correspondence between RDI and vote share shown alongside the correspondence between relative extremism and vote share. Next, we gauge how relative extremism performs as a predictor of vote outcomes when well-established political and economic fundamentals are taken into account. In this same subsection, we present our replications of the musical chairs and bread and peace models, develop two composite models that combine variables from both baseline models, and introduce our extremism variables into these composites. Finally, we present some calculations intended to aid with interpreting the magnitude of our estimates.
Correlations between incumbent extremism and vote share
We begin our analysis by examining bivariate relationships between our relative extremism variables and incumbent party vote share. These data, in the form of correlations, are presented in Table 1.
Bivariate Correlations between Vote Share and Measures of Relative Candidate Extremism
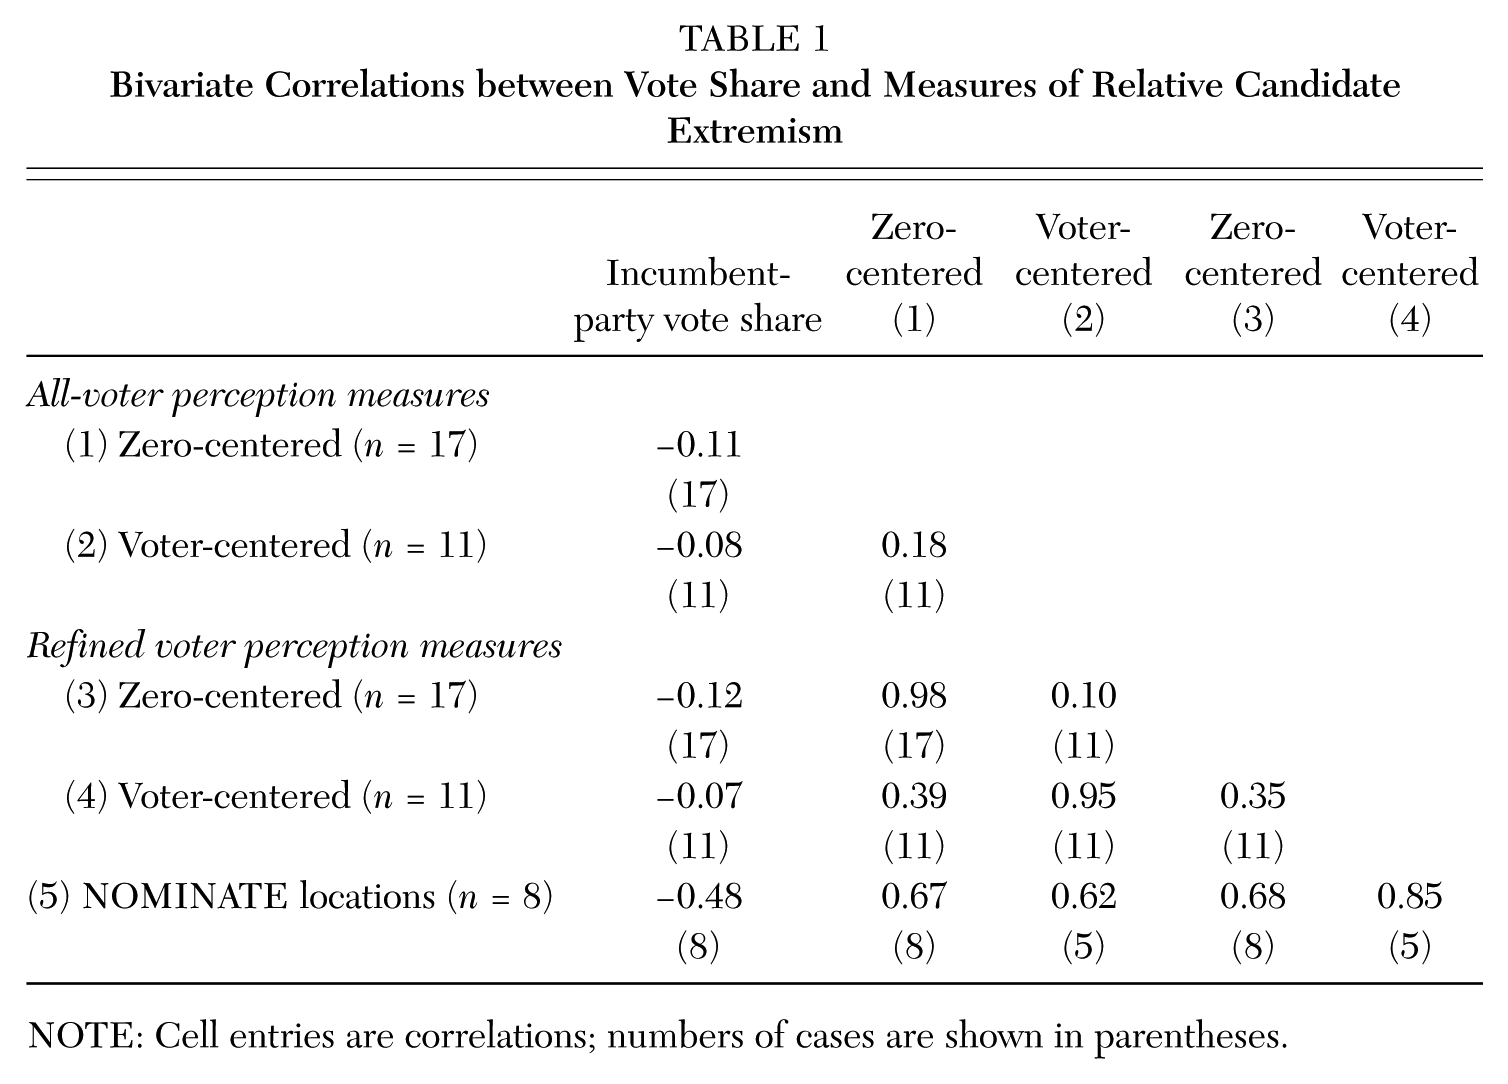
NOTE: Cell entries are correlations; numbers of cases are shown in parentheses.
The first column of Table 1 shows that all five measures of incumbent party relative candidate extremism have the expected negative relationship with incumbent party vote share, but the four measures based on voter perceptions generate small relationships. The correlation between the NOMINATE measure and vote share is stronger—a respectable −.48—but this correlation is based only on the eight cases in which both candidates have NOMINATE scores. When the two zero-centered measures are limited to just these eight cases, both measures show a correlation with vote share of −.44. Thus, the stronger showing of the NOMINATE measure seems based more on the cases for which it is available than a genuinely stronger performance.
It is possible that relationships between relative extremism and vote share will strengthen when political fundamentals are taken into account. Below we consider extremism in the context of these fundamentals. Because the refined, zero-centered measure turns out to have the most statistically reliable relationship with vote share, we feature this measure in the next two subsections. In the final subsection we examine effect sizes for all five measures.
Comparing RDI and extremism as predictors
Panel A of Figure 3 shows the relationship between incumbent-party vote share and RDI, using the musical chairs RDI variable. 13 A strong positive relationship is apparent: higher growth in quarters 14 and 15 generally corresponds to higher incumbent-party vote share. Panel B of Figure 3 shows the relationship between incumbent party vote share and our zero-centered, refined ANES/Rosenstone measure (relative incumbent extremism as measured by the estimated perceptions of informed and mainly centrist voters). If voters penalize candidate extremism and prize moderation, we should see high incumbent vote shares to the left, where negative numbers on the x-axis indicate that the challenger was more extreme than the incumbent; and low incumbent vote shares to the right, where positive numbers indicate that the challenger was more moderate than the incumbent. We do see a slight negative relationship between incumbent party relative candidate extremism and incumbent party vote share, but this relationship is weak and indistinct.

Relationship of Vote Share to RDI and to Incumbent Party Candidate Extremism
Accounting for political and economic fundamentals
Table 1 and Figure 3 suggest that relative extremism may not be a strong predictor of vote share. For a sharper look, we estimate the relationship between extremism and vote outcomes when political and economic fundamentals are taken into account, as represented by the musical chairs and bread and peace models.
Panel A of Table 2 uses the musical chairs model as a starting point. The dependent variable is incumbent party vote margin, and RDI is measured using the musical chairs version of the variable: change in RDI per capita immediately prior to the election (quarters 14 and 15). Incumbent party fatigue, measured by the number of years the incumbent party has spent in the White House, is also included in each of the specifications in Panel A. Column A1 replicates the original musical chairs model, with updated data from 1948 to 2012. Column A2 creates a composite model by introducing the war fatalities variable from bread and peace into the original musical chairs model. In column A3, we add our main incumbent party relative candidate extremism variable (the zero-centered, refined ANES/Rosenstone measure) to the composite model built in column A2.
Relative Extremism Variable in Baseline Models
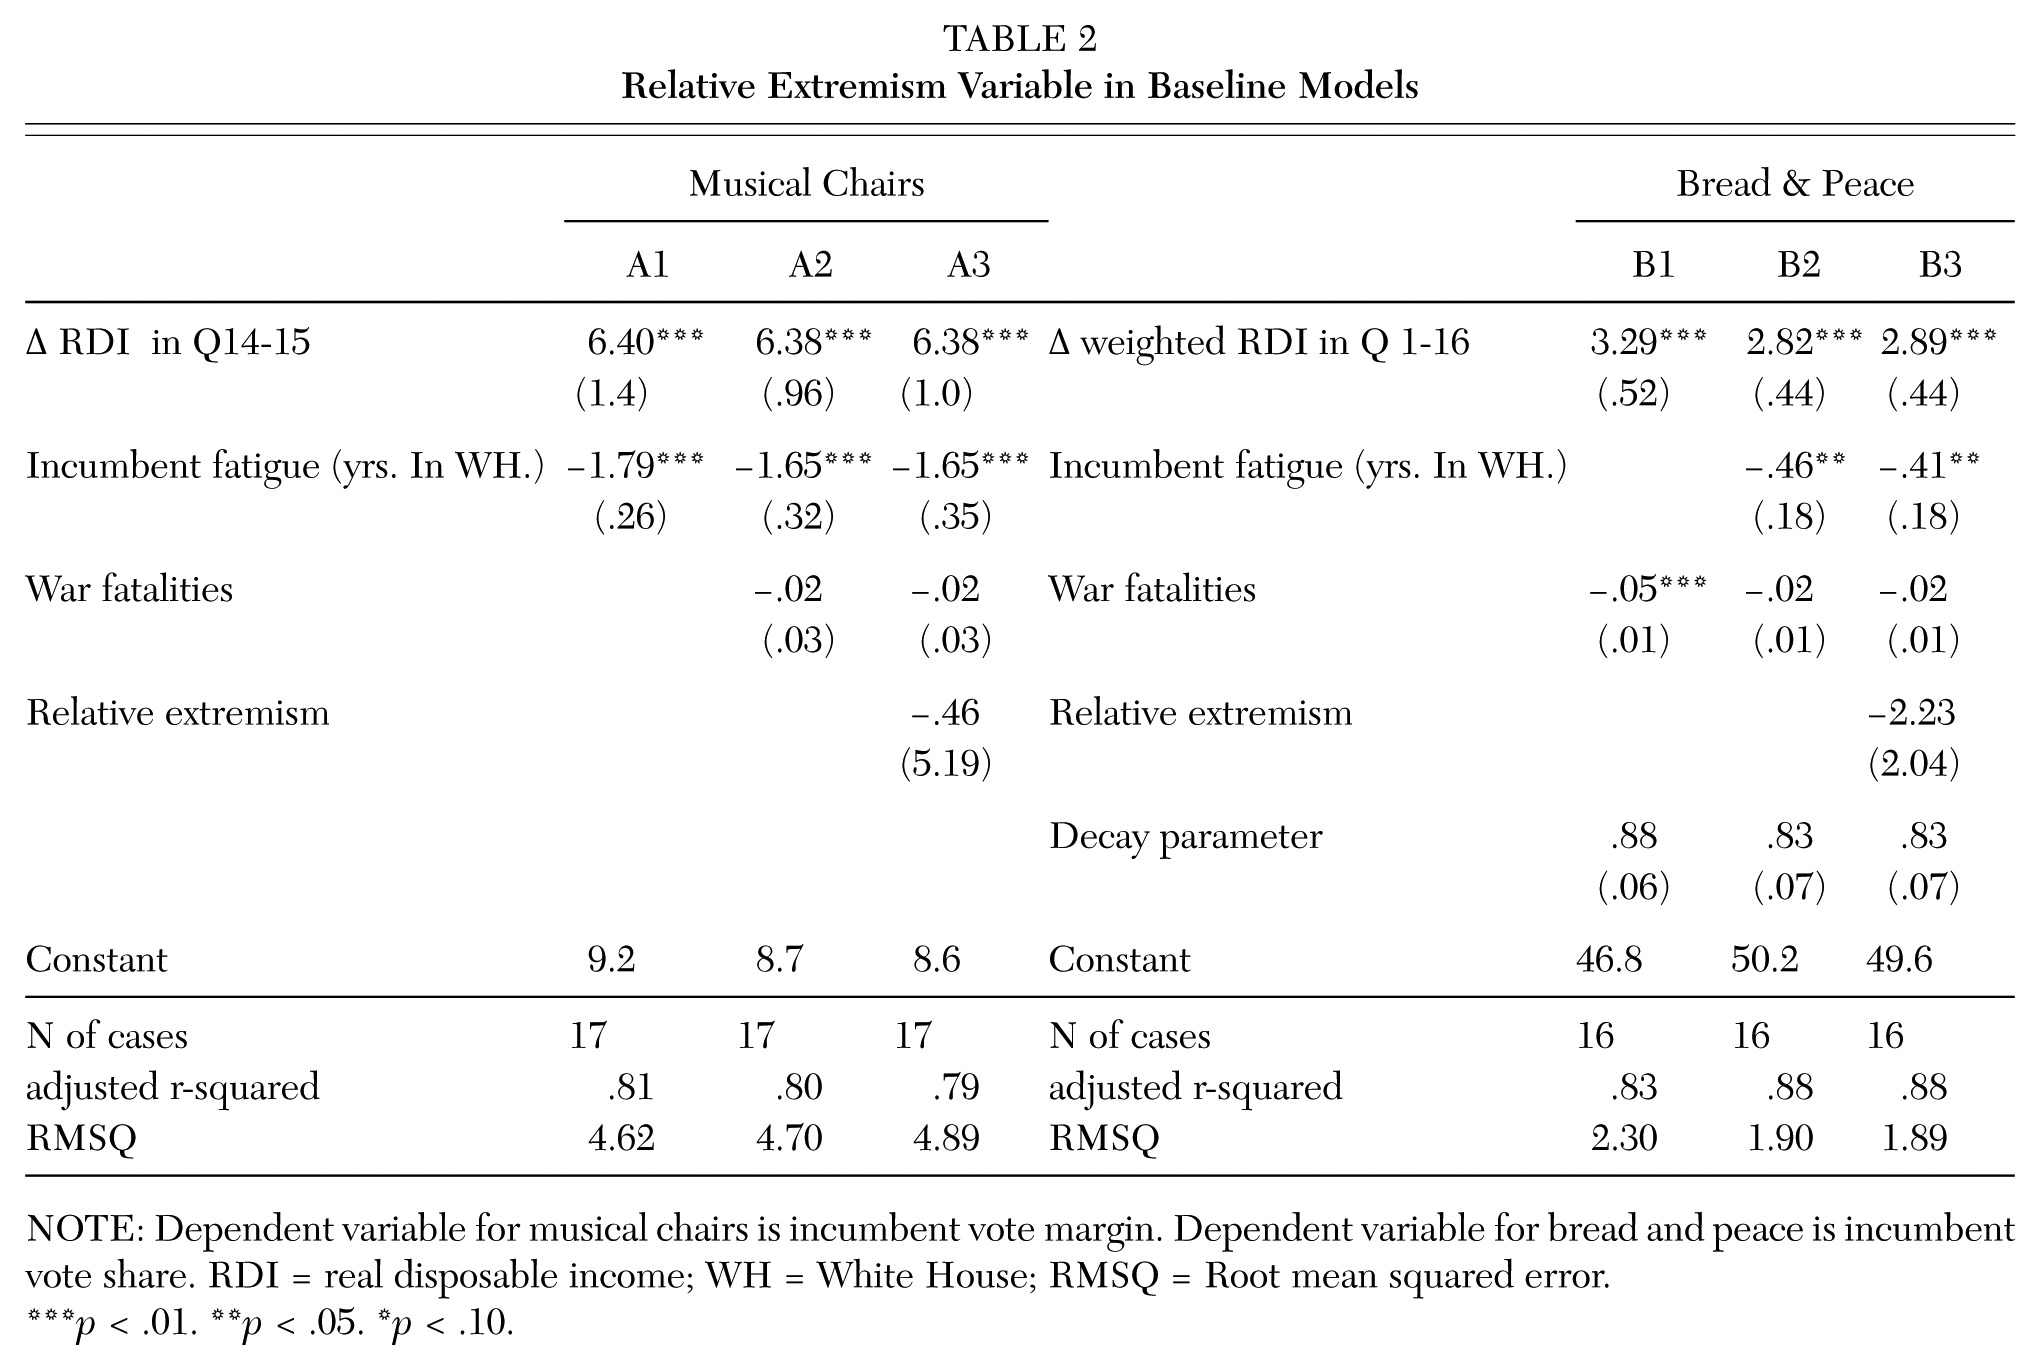
NOTE: Dependent variable for musical chairs is incumbent vote margin. Dependent variable for bread and peace is incumbent vote share. RDI = real disposable income; WH = White House; RMSQ = Root mean squared error.
p < .01. **p < .05. *p < .10.
Panel B of Table 2 starts with the bread and peace model and builds on it in the same manner that Panel A built upon musical chairs. The dependent variable in Panel B is incumbent party share of the two-party vote, and RDI is measured using Hibbs’s definition of the variable, with quarters 1–16 discounted by a decay parameter as described above. The war fatalities variable is included in each of the Panel B specifications. Column B1 replicates the original bread and peace model using updated data from 1952 to 2012. Column B2 incorporates the incumbent fatigue variable from musical chairs to create a composite based on the bread and peace model. Column B3 then adds our main extremism variable to the composite model from column B2.
The composite models in columns A2 and B2—musical chairs plus Hibbs’s war casualty variable and bread and peace plus Achen and Bartels’s incumbent fatigue variable, respectively—include all three variables that serve as fundamentals in these reputable models of presidential vote outcomes. These composites serve as our baseline models, within the context of which we will assess the importance of relative candidate extremism. We estimate the relationship between incumbent party relative candidate extremism and vote outcomes in columns A3 and B3. Column A3 shows that, in the context of a musical chairs–based composite, moving the relative extremism score by one ANES scale point corresponds with an estimated .46 percentage point decrease in incumbent party vote margin. Column B3 shows that within the context of a bread and peace–based composite, an increase in relative extremism by one ANES scale point corresponds to an estimated 2.23 percentage point decrease in incumbent party vote share. 14
The residuals from the composite models in columns A2 and B2 represent the variation in vote outcomes that remains unexplained by the three fundamental variables: change in RDI, incumbent fatigue, and war fatalities. Figure 4 plots the residuals from these two composite models against our main relative extremism variable. This provides a picture of how much of the unexplained variance in vote outcomes might be explained by candidate extremism.
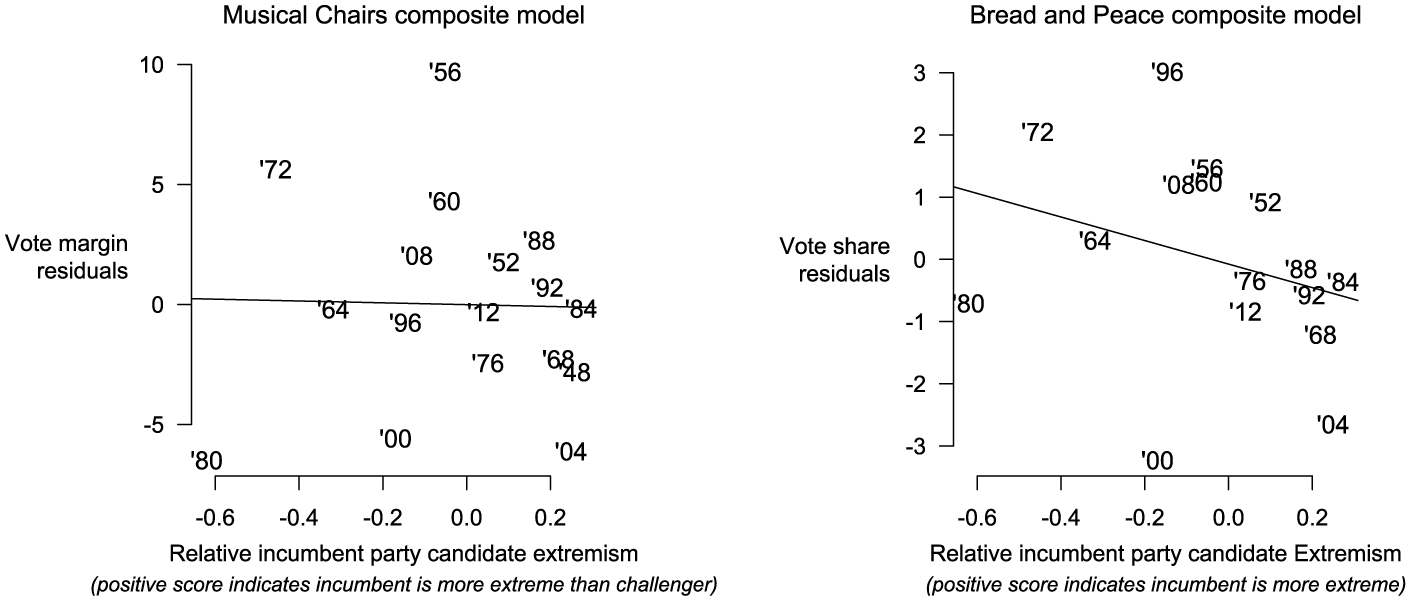
Additional Explanatory Force of Relative Candidate Extremism
Panel A in Figure 4 shows the residuals from model A2, the musical chairs–based composite. The y-axis shows percentage points of incumbent party vote margin; the x-axis shows relative incumbent extremism, with positive numbers indicating that the incumbent was more extreme than the challenger, negative numbers indicating a challenger more extreme than the incumbent. The relationship between extremism and the vote-margin residuals in panel A is essentially null—within the musical chairs–based model, incumbent extremism does not provide a good explanation of the variation remaining after accounting for the fundamentals. Panel B shows residuals from the bread and peace–based composite, with percentage points of incumbent party vote share on the y-axis. As in panel A, the x-axis scale is incumbent relative candidate extremism. The ability of candidate extremism to explain the remaining variation in vote share from the bread and peace–based model is stronger than in the musical chairs–based model, but the relationship depicted in panel B remains well short of statistical significance: the two-tailed p-value for the coefficient is .26.
Maximum predicted effect of relative candidate extremism
Table 3 reports the maximum effect of candidate extremism that would be predicted by each of our ten models. All estimates are based on regressions identical in form to those in columns A3 and B3 in Table 2 and fully documented in our replication files. Maximum effect is calculated as the coefficient for the variable × the largest value of that variable. To take one example, the coefficient for the zero-centered refined incumbent extremism variable is −2.23 in the bread and peace composite, as shown in Table 2. The largest value of the zero-centered refined variable occurs in 1980, when Reagan’s ideological location was a relatively extreme 1.58 and Carter’s location was −.34, the most moderate of any of the thirty-four candidate positions in the dataset. This works out to a relative incumbent extremism score of −.62 for that variable in that election, with the negative direction of the score showing that the challenger, Reagan, was more extreme than the incumbent, Carter. Based on these values, maximum effect is calculated as +1.38. The incumbent Carter should have been expected to gain a small amount of vote share—1.38 percentage points—from being less extreme than his challenger. As Table 3 also reports, the p-value for the coefficient underlying this estimate is .30 and based on ten degrees of freedom.
Maximum Effect Sizes for All Models
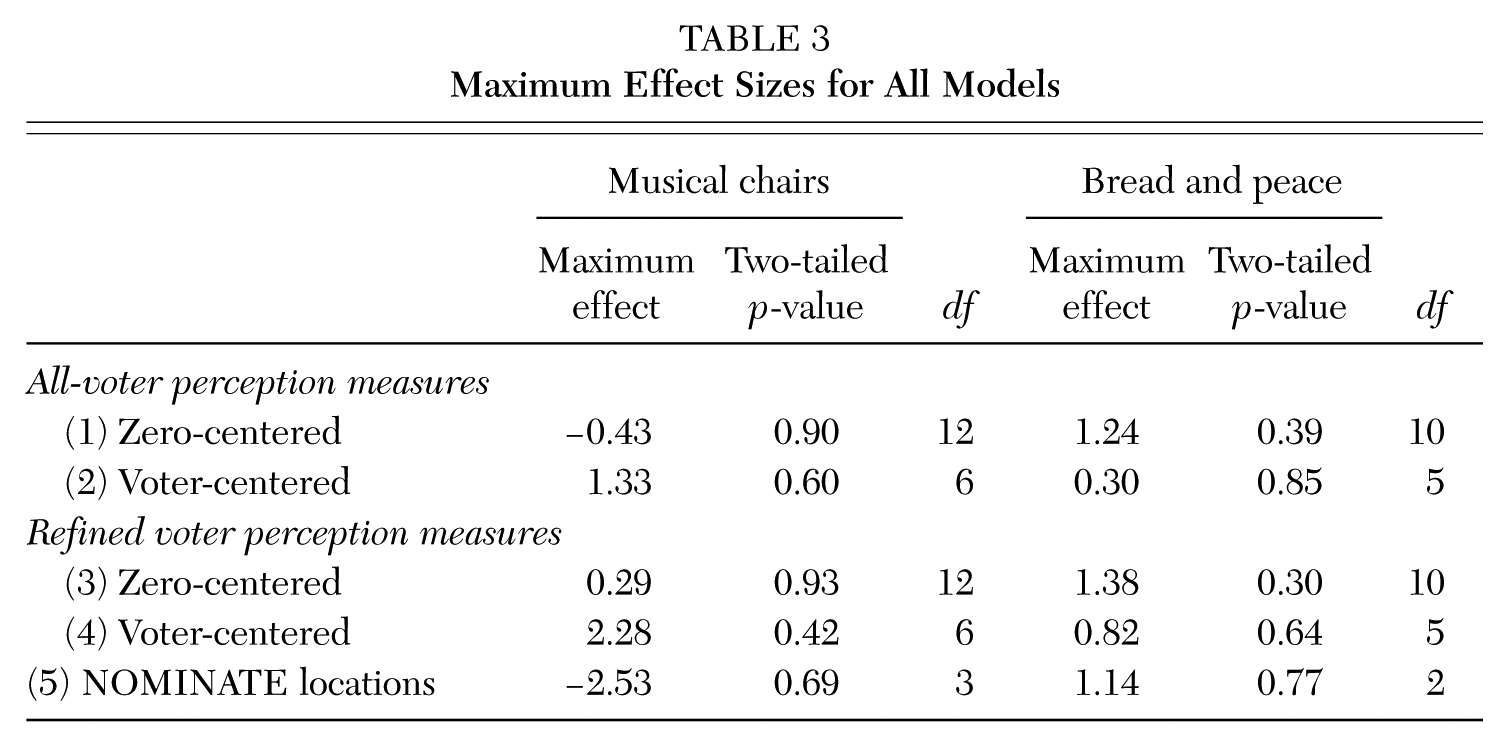
The ten maximum effect estimates in Table 3 are impressive for their modesty. For all five variables, the largest value represents an election in which the incumbent was less extreme than his challenger, so the relative extremism score employed in these calculations is always negative. 15 Then, under the standard assumption that extremism incurs a penalty, the extremism coefficients should all be negative, producing only positive maximum effect estimates in Table 3. But this minimal expectation that the extremism coefficient should be negative is met in only eight of ten cases. The NOMINATE measure and the zero-centered all-voter measure both produce differently signed estimates in the two baseline models. Notice, moreover, that no maximum effect estimate is substantively large and that the p-values for the coefficients underlying the estimates are extremely weak. It is hard to find evidence in these results that candidate extremism has any consistently important correspondence with vote share in U.S. presidential elections since World War II.
Conclusion
Based on our estimates of the relationship between candidate extremism and vote outcomes, ideological location seems unlikely to be of much predictive importance in elections where one candidate begins with an important advantage. The extreme candidates Goldwater and McGovern, widely cited exemplars of the dangers of extremism, met with landslide defeats. But these candidates faced a double whammy: they were running against incumbents whose parties had been in the White House only one term, presiding over strong economies. Meanwhile, Ronald Reagan in 1980 and Barack Obama in 2008 were rated almost as extreme as Goldwater and McGovern, but were challenging incumbent party candidates with poor economic records. In these more favorable conditions, Reagan and Obama both won comfortable victories.
If extremism does little apparent damage, neither does moderation always pay off. Dewey in 1948, Nixon in 1960, and Carter in 1980 were rated as moderates, and yet each lost—and in two of three cases, lost to candidates who were not at all moderate.
We therefore find little evidence of an electorally important relationship between candidate extremism and vote outcomes—but this is not evidence that no important relationship exists. Still less do our results imply that voters pay no attention to candidates’ policy positions in casting their presidential ballots.
The difference between policy voting and ideological voting is made clear by Rosenstone’s (1983) analysis. Recall that he measured candidate positions on two policy dimensions, New Deal economic liberalism and racial liberalism. Whereas we collapsed these two dimensions into a single ideological dimension, Rosenstone used them as separate policy dimensions and examined their effects at the level of state electorates over the period 1948 to 1980. He obtained effects that ranged from minimal to moderate to huge, depending on particular states and candidate configurations. 16 The largest effects were for racial liberalism on voting in southern states, flipping some from Democrat to Republican as Republican candidates became more racially conservative. Effects of New Deal liberalism registered more strongly in the North, with states voting more and less Democratic and Republican on the basis of candidates’ varying embrace of social welfare protections. The effects of candidates’ policy positions were cross-cutting, winning votes in some states and losing them in others. To take an important case, Goldwater’s racial conservatism helped him in the South but cost him in the North. While our results show little evidence that voters respond to candidates’ ideological positions, Rosenstone’s findings indicate that voters may respond to more narrowly defined policy dimensions.
The scholarly work most strongly identified with the importance of ideological positioning is Anthony Downs’s Economic Theory of Democracy (1957). Although many scholars have been impressed by Downs’s elegant reasoning, one who remained dubious of its significance for mass politics was Philip Converse. Converse argued forcefully in his “Nature of Belief Systems in Mass Publics” (1964) that most voters knew and cared little about ideology and that when they changed parties between elections, it was more likely to be because of “the nature of the times”—a term referring mainly to economic conditions—than anything about ideology. This judgment stands up much better to evidence from postwar presidential elections than does Downs’s more famous median voter theorem. To many political scientists—including some of the authors of this article—who have taught students, told journalists, and personally believed that extreme candidates have difficulty winning elections, this is a hard lesson, but it is one that needs to be taken seriously.
Footnotes
Note:
We thank Larry Bartels for advice at several stages of this project and Molly Offer-Westort for helpful comments on the paper.
Notes
Marty Cohen is an associate professor of political science at James Madison University. His main research focus is the electoral influence of the religious Right in the Republican Party. He is coauthor of The Party Decides: Presidential Nominations before and after Reform (University of Chicago Press 2008).
Mary C. McGrath is an assistant professor of political science at Northwestern University and a faculty fellow at the Institute for Policy Research.
Peter Aronow is an assistant professor of political science and biostatistics at Yale University and a resident fellow at the Institution for Social and Policy Studies.
John Zaller is a professor of political science at the University of California, Los Angeles. He specializes in public opinion, the mass media, and political parties.