



Abstract
In this article, I review the most prominent provision of the federal income tax code that targets low-income tax filers, the Earned Income Tax Credit (EITC), as well as the structurally similar Child Tax Credit and Additional Child Tax Credit. I discuss the programs’ goals: distributional, promoting work, and limiting administrative and compliance costs. The article reviews the history of the programs, the predicted economic effects, and what is known about program impacts and distributional consequences. I conclude that the EITC effectively targets low-income households and is efficient in reducing poverty while encouraging work and that increases in after-tax household incomes lead to improved outcomes over the life course for children of those households. I propose reforms to the program, including policies that expand the generosity of the credit and increase take-up, as well as structural reforms that include spreading benefits throughout the year and reducing reliance on paid tax preparers.
Entitlements operate not only through the transfer system, such as food stamps, social security, and disability benefits, but also through the tax system. The most prominent provisions of the federal income tax code that target low-income tax filers are the Earned Income Tax Credit (EITC), the less prominent Child Tax Credit (CTC), and the Additional Child Tax Credit (ACTC). These programs are explicitly redistributive, designed to transfer money to families and individuals rather than tax it away from them.
The EITC is a tax credit available to lower-income families and individuals with positive earned income. The credit operates as an earnings subsidy at low levels of income (in the phase-in region), reaches a maximum credit amount, and then is phased out at higher income levels. For example, a family with two children earning less than $14,290 will receive 40 cents for every dollar earned up to a maximum of $5,716 (in 2018). For a single parent with two children, the credit is phased out at incomes between $18,660 and $45,802. The credit is refundable; therefore, if recipients’ tax obligations are below the credit amount, they receive refund checks from the Internal Revenue Service (IRS). In 2016, 86 percent of the total tax expenditure of the EITC took the form of tax refunds (IRS 2018b, Table 2.5).
The EITC was introduced in 1975 as a modest tax credit to offset payroll taxes for those with low earnings. Expansions beginning in 1986 and continuing in the 1990s and 2000s have transformed the EITC into a central element of the U.S. social safety net for families with children (Bitler and Hoynes 2010; Hoynes and Schanzenbach 2018). While the EITC is available to all low-income wage earners, the tax credit is much more generous for families with children, reflecting the potential for intergenerational benefits (Hoynes and Schanzenbach 2018; Hendren and Sprung-Keyser 2019). In 2016, the EITC reached 27 million tax filers at a total cost of $67 billion. Almost 20 percent of all tax filers and 44 percent of filers with children receive the credit. The maximum credit in 2018 was $6,431 for families with three children, $5,716 for those with two children, $3,461 for those with one child, and $519 for those without children—this can be as much as 45 percent of a family’s pretax income. Overall, the average credit amount for families with children is a substantial $3,200 (IRS 2018a). The program dwarfs traditional cash welfare (Temporary Assistance for Needy Families, or TANF), which reached only 1.2 million families in fiscal year 2018, a more than 75 percent decline since 1994.
The CTC is more recent; it has been available in the United States since 1997. The CTC is similar to the EITC (e.g., a phase-in, maximum credit, and phase-out regions), with a maximum credit of $2,000 per child under current law (up from $1,000 from 2003 to 2017). However, the CTC is much less targeted compared to the EITC, as eligibility extends very high into the income distribution (phase-out of the credit begins at $200,000 for single parents and $400,000 for married couples). Additionally, unlike the EITC, it is not fully refundable, and thus the lowest-income families do not gain fully from the credit. The refundable component of the CTC—the ACTC—requires $2,500 in earnings, is phased in slowly, and is capped at $1,400. In 2016, the cost of the CTC was $52 billion, on par with the EITC. After the 2018 expansion, the CTC’s cost will likely far exceed that of the EITC.
What are the goals of these two tax credits? First, all means-tested programs are designed in part to achieve distributional objectives. In the case of the EITC (and the ACTC), these are to transfer funds to low- and moderate-income families, and particularly to those with children. The nonrefundable CTC distributes to families with children, but is not income targeted, given the eligibility up to the highest income percentiles. The CTC then may be better thought of as a near-universal (excluding the lowest earning and highest earning families) child benefit for working families. Second, the EITC is explicitly designed to encourage work. Third, by administering this benefit through the tax system, administrative costs associated with transfer programs are reduced.
In this article, I review the role of the EITC, what is known about its impacts and distributional consequences, and the possibilities for reform. I give less attention to the CTC given its less important role for lower-income families with children and the limited evidence on the behavioral effects of the credit.
I begin in the next section by reviewing the structure and history of in-work tax credits. Then, I discuss the economics of the EITC and briefly review the evidence from the research on the effectiveness of the EITC. The next section discusses possible reforms to the EITC, and I end with a concluding section that illustrates how the EITC has met its stated goals to date and possible reforms to improve on the program.
Current Policies and Recent Reforms
To be eligible for the EITC, a taxpayer—or tax filing unit—must have earned income during the tax year. The value of the credit is determined by a benefit schedule with three regions, known as the phase-in, flat, and phase-out. In the phase-in region, the credit increases by a share of each additional dollar earned. Once the credit reaches its maximum value, the taxpayer is in the second, flat region, where additional earnings do not affect the credit value. In the final region, the credit declines with each additional dollar of earnings (or, adjusted gross income [AGI], if that is higher) until it is zero.
The exact parameters of the schedule vary by filing status and by the number of qualifying children. The qualifying children definition for the EITC is complicated, occupying seven dense pages in IRS Form 596. 1 Figure 1 displays the EITC schedule in 2018 as a function of earned income for single taxpayers with zero, one, two, and three or more children. For families with children, the phase-in or subsidy rate is substantial at 34/40/45 percent for those with one/two/three or more children. The phase-out rate is modest, at 15.98 (21.06) percent for those with one (two or more) children. Maximum benefits range from $3,461 for families with one child to $6,431 for those with three or more. Eligibility for single taxpayers extends to incomes of $40,320 (with one child), $45,802 (with two children), or $49,194 (with three or more children). The credit for families without children is much less generous, with a phase-in rate of 7.65, a maximum credit of $519, and a maximum allowable income of $15,270. The dashed lines in Figure 1 denote the extended flat and phase-out regions for married couples ($5,680 in 2018) receiving the EITC. 2
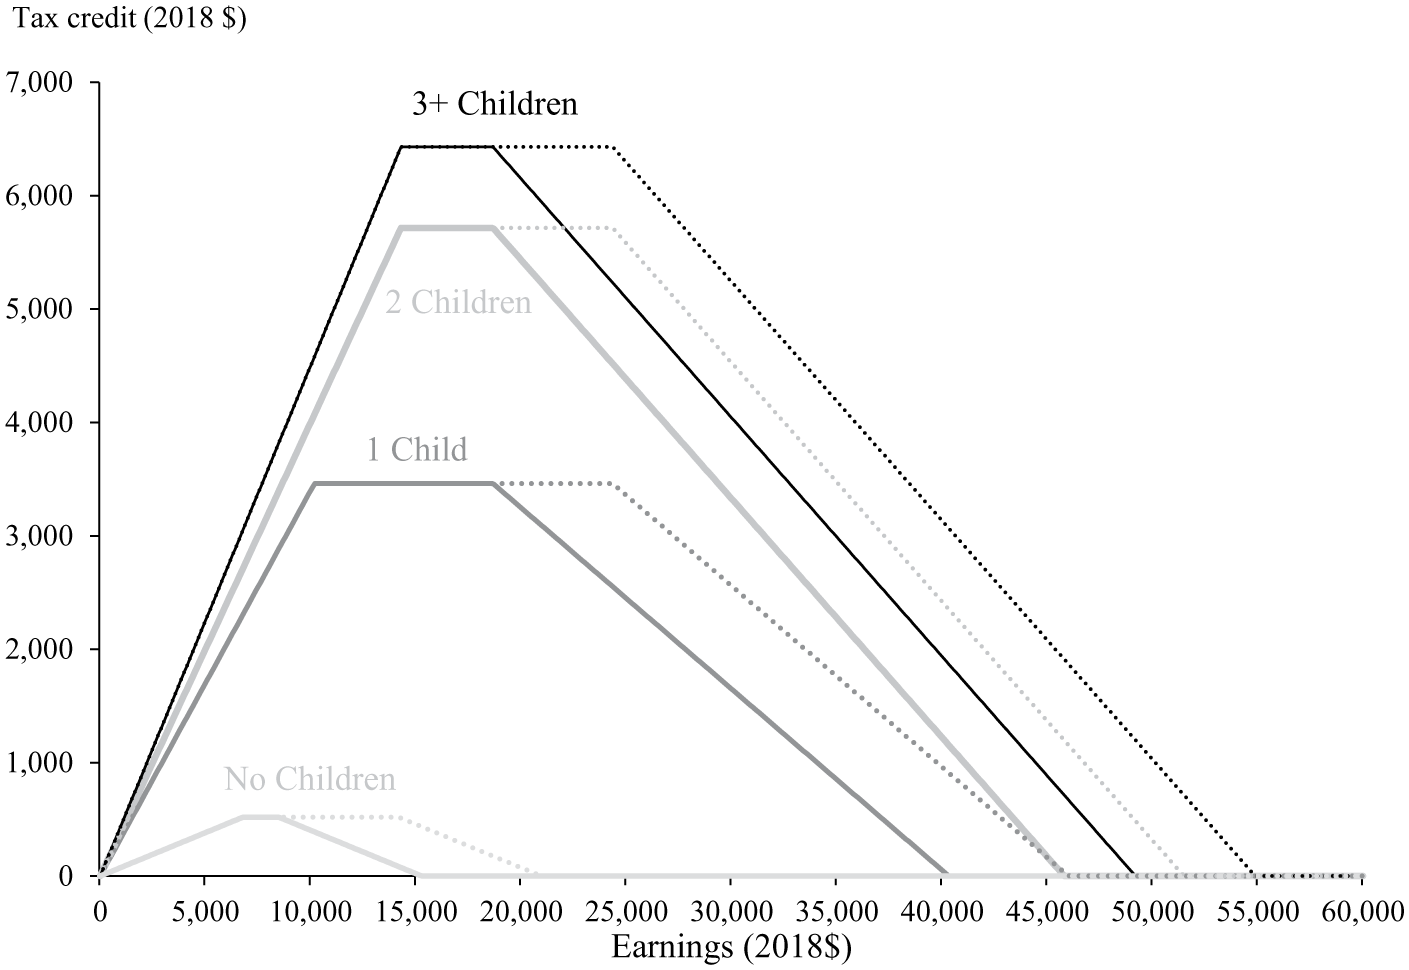
Earned Income Tax Credit Schedule, 2018
The EITC is a refundable tax credit, meaning that if the credit exceeds a taxpayer’s tax liability, he or she receives the difference as a refund. Typically, families with earnings below $20,000 to $25,000 will owe very little income tax, so the bulk of the EITC will arrive as a refund even when withholding is zero (86 percent of EITC costs in 2016 occured through refunds). EITC recipients receive the payment as an annual lump sum with most payments—about 80 percent— arriving in February and March (Lalumia 2013). The Advance EITC program allowed recipients to receive their credits throughout the year, but take-up was extremely low (under 1 percent), and this option was eliminated in 2011.
Table 1 shows the number of claimants and the cost of all claims for the EITC. In 2016, more than 27 million tax filers claimed the credit for a total of $67 billion. Almost 20 percent of all tax filers and 44 percent of filers with children receive the credit. About 75 percent of the EITC recipients and 97 percent of the total EITC benefits are for families with children. Married couples make up 22 percent of EITC filers and about a quarter of the total EITC spending. The average EITC payment is $3,200 for families with children.
Number and Claim Amount of EITC Claims by Filing Status and Number of Dependents (2016)

SOURCE: Calculations based on unpublished tax year 2016 IRS data provided by the Center for Budget and Policy Priorities.
Receiving the EITC requires filing a tax return and completing the necessary forms. The EITC take-up rate (defined as the share of eligible families/individuals that receive the credit) is approximately 80 percent for families with children and 56 percent for taxpayers without children (Scholz 1994; Plueger 2009)—fairly high compared to other programs serving low-income families (Currie 2006). 3
The CTC has the same basic structure as the EITC (requires income, 4 has phase-in, flat and phase-out regions) with a maximum credit of $2,000 per child under current law. However, the two programs are otherwise different. The CTC is not fully refundable, and thus the lowest-income families do not receive the full benefits of the credit. The refundable portion of the CTC (ACTC) is limited to those with earnings above $2,500 per year, is phased in at a 15 percent rate, and is capped at a maximum credit of $1,400. The CTC phase-in (15 percent) and phase-out (5 percent) rates are much smaller than the EITC and the ACTC. Additionally, the flat range for the credit is very large: the credit begins to phase out for single parents at incomes of $200,000 and for married couples at incomes of $400,000. The result is the CTC/ACTC is much less targeted than the EITC, and most of the spending on the program goes to families far above the poverty line (Hoynes and Rothstein 2017). 5
Figure 2 presents the budget constraint for the combination of the EITC and the CTC for 2018. For illustration, I calculate the credits assuming a single parent with two children. The figure separately identifies the portion of the CTC that is refunded and the portion that offsets other taxes. The figure also shows (labeled as “CTC forfeited”) the portion of the credit that is forgone by very-low-income families for whom the refundability limit is binding. The figure shows the significantly greater targeting of the EITC compared to the CTC. Further, the refundable portion of the CTC effectively expands the EITC, serving approximately the same income range but increasing the benefit. By contrast, the portion of the CTC that offsets other tax liabilities rises much higher in the income distribution, not even beginning to phase out until income is four times the end of the phase-out region under the EITC.

Budget Constraint for Combined EITC, CTC and ACTC, 2018
The EITC and CTC/ACTC have expanded several times over their history. To illustrate these changes, Figure 3 plots the EITC maximum credit over time for families of different sizes, and Figure 4 shows the total tax cost of the EITC and CTC/ACTC over time (in real 2018 dollars).

Maximum EITC, by Year and Number of Children

Total Spending over Time (2018 dollars)
The EITC was introduced in 1975, and in the early years inflation gradually eroded the real maximum benefit (Figure 3). The 1987 expansion of the EITC, passed as part of the Tax Reform Act of 1986, increased the generosity of the credit and indexed the credit schedule to inflation. The largest change was the 1993 expansion, which introduced a credit for families without children and greatly increased the credit for families with two or more children (and less so for one-child families). Elsewhere in the figure, one can see smaller expansions in the early 1990s, as well as the introduction of a separate three-child schedule in 2009 (as part of the stimulus package, which was later made permanent).
Overall, the EITC expanded from about $5 billion per year in the 1980s to nearly $50 billion in the mid-1990s (in real 2018 dollars), and it has grown gradually since then (Figure 4). The increases in the EITC tax cost follow the tax expansions in 1987, 1990, and 1993; the married couple expansions in 2002; and the three-child expansion in 2009. Another factor affecting the cost of the EITC is wage and earnings stagnation; as the earnings of lower-skill workers decline (Autor 2014), the cost of “toping up earnings” for these families increases.
Figure 4 also shows the cost of the CTC, the ACTC, and their combined cost over time. The CTC was introduced in 1997 with a nonrefundable credit of $500 per child, increased to $600 in 2001, $1,000 in 2003, and $2,000 per child in 2018. Unlike the EITC, the CTC maximum credit is set nominally, and the figure shows the real decline in periods between policy expansions. The ACTC began in 2001, allowing 10 percent of earnings over $10,000 to be refundable. It expanded in 2004 (raising the refund rate to 15 percent), and the earnings threshold was lowered in 2008 (to $8,500), in 2009 (to $3,000), and in 2018 (to $2,500). As of 2016, the combined CTC/ACTC cost $52 billion, almost as large as the EITC ($67 billion), with about half on the nonrefundable CTC and half on the refundable ACTC.
As already discussed, and reported in Table 1, EITC spending disproportionately goes to single parents with children. Figure 5 explores this further by presenting histograms for tax-return-reported earned income in tax year 2012 from the Statistics of Income (SOI) 2012 data (shown in 2018 dollars). I present the histograms for six demographic groups (single vs. married, for each with no, one, or two or more children). For each, the dashed line shows the 2018 EITC schedule, and I limit the sample in each case to those returns with earned income between $1 and $200,000. I do not condition on receipt of the EITC but tabulate the total number of returns within each $1,000 bin of earned income to see how these counts stack up across various points in the EITC schedule. On each graph, I also indicate the share of total filers for that demographic group that is excluded from the histogram (those filers with earned income that is ≤$0 or greater than $200,000).

Distribution of Earnings and EITC Schedule, by Filing Status and Number of Children
Several observations can be drawn from these figures. First, they illustrate well the variation in the generosity of the schedule across these six groups. The credit is substantially larger for families with children than for those without children, and the credit is larger for families with two or more children than for one-child families. Second, the distribution of earned income for single families with children is shifted considerably to the left of the distribution for married families with children. Only 29 percent of singles with one child and 18 percent of singles with two children have earnings higher than the top of the EITC phase-out range (compared to 76 percent and 75 percent for married families with one and two children, respectively). Third, consistent with Saez (2010), there is evidence of clustering at the first kink of the EITC schedule for single families with children. On net, the higher income levels of married couples leads to lower rates of EITC eligibility (compared to single families). Figure 6, calculated using the March Current Population Survey, plots the EITC eligibility rates by marital status and maternal education level from 1984 to 2017. It shows the higher eligibility rates for single-parent families compared to married (about 60 percent of single parents with less than a college degree are eligible compared to 35 percent of married couples with mothers having less than a college degree) as well as the increases over time as the program has expanded.
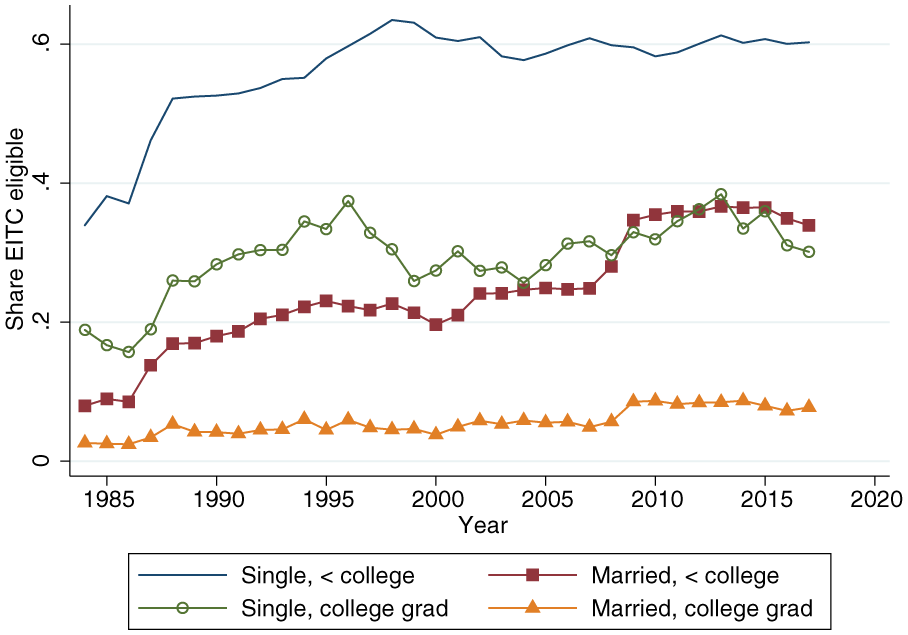
EITC Eligibility by Marital Status and Education
Economic Effects and Evidence from the Research
Labor supply
The EITC generates incentives for employment as well as how much to work, but the effects differ based on the beneficiaries’ marital status. Among single parents, who represent three-quarters of total EITC tax expenditures, the EITC increases the return to entering employment for those outside of the labor force and therefore results in a predicted increase in the extensive margin of labor supply. The incentives are quantitatively large due to the high phase-in rates in the credit (e.g., 40 percent for a single parent with two children). In contrast, the effects of the EITC on the intensive margin (hours of work), for those already in the labor market, are generally negative. In the phase-in region, the EITC generates a positive substitution effect and a negative income effect. In the phase-out region, where a large share of recipients reside (Figure 5), both substitution and income effects create an incentive to reduce labor supply.
The research finds consistent evidence that the EITC leads to increases in employment for single parents with children (see reviews by Hotz and Scholz 2003; Eissa and Hoynes 2006a; Nichols and Rothstein 2016; Hoynes and Rothstein 2017). Many studies take a quasi-experimental approach leveraging the variation across tax regimes and family size in the credit, using women without children as controls. The 1993 expansion provides a particularly attractive policy reform because it represents the largest expansion of the credit in its history, and the expansion for families with two or more children was much larger than the expansion for families with one child (thus allowing for a comparison among single women with children, comparing those with two or more children to those with one child). On the other hand, the 1993 expansion occurred during a period of broader changes including welfare reform and a very strong labor market (Blank 2001; Hoynes and Patel 2018).
Across the different studies and approaches, the evidence nearly universally points to a significant positive effect of the EITC on the employment of single women with children (Eissa and Liebman 1996; Meyer and Rosenbaum 2000, 2001). For example, Meyer and Rosenbaum (2001) find that the EITC raised labor force participation by 7.2 percentage points for single women with children relative to those without children between 1984 and 1996. The changes in employment are evident in the basic trends; Figure 7 uses the March Current Population Survey and plots the trend in annual employment for single women with no children, one child, and two or more children.

Employment Rates of Single Women, by Presence and Number of Children
Quasi-experimental approaches (such as that described here) do not confirm the predictions on the intensive margin of labor supply. However, such quasi-experimental approaches are not well-suited to this question, because of the confounding effects of changes in the composition of workers due to the extensive margin labor supply effect. Bunching methods, starting with Saez (2010), take a different approach and find evidence that workers in the phase-in region adjust to increase their credits (Saez 2010; see also Chetty, Friedman, and Saez 2013; Chetty and Saez 2013; Mortenson and Whitten 2015). Most of this effect derives from self-employed workers who, and in contrast to wage and salary workers, self-report earnings on their tax return and have limited third-party verification. It is thus difficult to determine whether it is a real behavioral effect or a change in reporting. The bunching approach yields much weaker evidence for the predicted reduction in labor supply in the phase-out region.
Because the EITC is based on family income, the credit leads to a somewhat different set of incentives for married taxpayers. Overall, as with singles, we would expect higher rates of “family” employment (participation by at least one family member) for married couples, as a result of the credit being tied to work. However, for most secondary earners, the EITC reduces the returns to work both on the extensive and intensive margin. Unless the primary earner has very low earnings (in the phase-in), the EITC reduces the after-tax wage for secondary earnings. There are fewer studies of married couples, but the available evidence shows that the EITC leads to small reductions in the employment of married women, consistent with the predictions above, and there is little evidence of any effects on men (Eissa and Hoynes 2004, 2006b).
Poverty and the distribution of income
Given the distributional goal of the EITC, it is useful to consider their expected effects on the distribution of income. In 2017, the poverty rate based on the supplemental poverty measure (SPM) was 13.9 percent, but the Census Bureau calculates that it would have been 16.5 percent without the EITC and CTC/ACTC (Fox 2018). The effect on child poverty is even larger: The SPM poverty rate for those under 18 years of age was 15.6 percent, but it would have been 21.7 percent without the refundable tax credits (Fox 2018). Based on these numbers, the EITC and CTC/ACTC are estimated to lift 8.3 million people, including 4.5 million children, out of poverty. These effects on child poverty are larger than any other government program. This measured antipoverty effect, however, captures only the direct effects of the tax credits. Additionally, there are indirect effects of the credit on after-tax and transfer income. Indirect effects come from earnings (with a positive effect if the extensive margin labor supply effect dominates) as well as a possible reduction in public assistance, Supplemental Nutrition Assistance Program (SNAP), or other income that results from the increase in earnings. Several studies estimate the effect of the EITC on income or poverty (Bollinger, Gonzalez, and Ziliak 2009; Grogger 2003; Gunderson and Ziliak 2004; Hoynes and Patel 2018), all showing that the direct and indirect effects combine to lead to large effects of the EITC on income. Hoynes and Patel (2018) find that the 1993 expansion of the EITC led to a 7-percentage-point reduction in poverty rates among single-mother families with less than a college education; and fully half of this reduction is due to the behavioral response of labor supply. Thus, the static or direct effects of the EITC account for only half of the antipoverty effects for this group. More generally, Hoynes and Patel find that the income-increasing effects of the EITC are concentrated between 75 percent and 150 percent of income-to-poverty, with little effect at the lowest income levels (50 percent poverty and below where earnings and hence in-work credits play less of a role) and at levels of 250 percent of poverty and higher (beyond the phase-out range of the credit).
The EITC may affect pretax wages. Since the phase-in rate encourages increased employment, standard tax incidence models suggest that the credit will be shared between the buyers and sellers of labor (Rothstein 2008, 2010; Leigh 2010). Specifically, the credit may reduce pretax wages, allowing employers to capture a portion of the money spent on the tax credit. Additionally, workers who do not receive the tax credit, but compete in the same labor market as those receiving the tax credits, will also experience a reduction in pretax wages. The reductions in pretax wages will be smaller in settings with higher minimum wages. While these predictions have a strong theoretical basis, there is little knowledge of its size given fairly limited empirical evidence (Leigh 2010; Rothstein 2008, 2010). This remains an understudied topic and one that may be important for the consideration of expansions of the tax credits. 6
These estimates of the effects of the EITC on after-tax income and poverty do not, however, take into account the recipients’ out-of-pocket costs of tax filing. In 2017, 54 percent of EITC filers used paid tax preparers for a total cost (among all filers) of at least $0.5 billion (Government Accountability Office [GAO] 2019). These costs significantly reduce the net transfers of the EITC: Weinstein and Patten (2016) estimate the average cost (in 2016) of $400 or 13 to 22 percent of the refund. The total fees paid include tax preparation fees as well as additional financial products. Refund anticipation loans (RALs), widely used through 2008, provided short-term loans for refunds allowing filers to obtain a refund more quickly, as early as the day of filing. These highly profitable loans peaked in 2002, but by 2012 most banks were out of that market, partially due to the 2010 IRS elimination of a debt indicator, which alerted tax preparers to liens against filers (M. Jones 2017). With the decline in RALs, refund anticipation checks (RACs) increased. RACs are a short-term loan for tax preparation fees and do not allow the filer to receive the refund any sooner. 7 The RAC might charge a fee of $30 for a $200 filing fee for three weeks, implying an annual percentage rate (APR) of 260 percent (M. Jones 2017). It is widely reported that in addition to the RAC fees, tax preparers add on other fees—document processing fees, e-filing, and transmission fees. In 2014, 40 percent of EITC filers used an RAC, for a total of $424 million in RAC and add-on fees (Wu 2015).
Marriage and fertility
Children in two-parent families have substantially lower poverty rates than those in single-parent families, reflecting the potential for two earners in the household. In part, due to these disparities, there is interest in knowing how and whether elements of the social safety net incentivize or disincentivize marriage. The EITC creates a somewhat complicated set of incentives surrounding marriage. In particular, the EITC creates incentives for low-income, one-earner couples to legally marry; while for low-income, two-earner couples, the incentive is to avoid marriage or separate. These incentives are consequences of a progressive tax system based on family income, such as the marriage penalties/subsidies in the broader tax code (Eissa and Hoynes 2000). Additionally, because the credits increase with the number of children, they may incentivize additional births. There are a handful of studies that examine the effect of the EITC on marriage (e.g., Ellwood 2000; Rosenbaum 2000; Herbst 2011; Michelmore 2016); the results are largely inconclusive, and any effects are quite small. There is even less evidence on the effects of the EITC on fertility (Baughman and Dickert-Conlin 2009) and, again, the results suggest small effects.
Child and family well-being
To begin, it is useful to review the evidence about how the EITC is spent. Survey-based self-reports among EITC recipients at the time of tax filing indicate that 70 percent plan to spend their refunds on durable goods (Smeeding, Phillips, and O’Connor 2000). Several empirical studies reinforce this finding, in particular showing that expenditures on durables are higher in the beginning of the year (when EITC refunds are typically received) relative to the remainder of the year (Barrow and McGranahan 2000; Goodman-Bacon and McGranahan 2008; Gao, Kaushal, and Waldfogel 2009). Patel (2012), using tax reforms over the 1980s and 1990s, also finds an increase in durables at the beginning of the year but, overall, finds a larger effect of the EITC on work-related and housing expenditures uniformly increasing over the year.
A large and growing literature uses the established first stage finding that the EITC increases after tax and transfer income, to examine the credit effects on downstream outcomes of child and family well-being. 8 The research finds that the EITC leads to increases in infant health, including a reduction in low birth weight (Baker 2008; Hoynes, Miller, and Simon 2015; Strully, Rehkopf, and Xuan 2010); an increase in maternal health, including reducing the incidence of risky biomarkers such as measures of inflammation, high blood pressure, and elevated cholesterol; and improving mental health (Evans and Garthwaite 2014). There are several studies documenting a link between the EITC and human capital, including a positive effect of the EITC on child test scores (Dahl and Lochner 2012; Chetty, Friedman, and Rockoff 2011) and educational attainment (Bastian and Michelmore 2018; Manoli and Turner 2018). 9
Possible Reforms
The evidence provided here indicates that the EITC is doing a good job of meeting its main objectives: it successfully targets low-income working families, bringing many of them out of poverty; and it has meaningful positive effects on labor force participation, with small or zero negative effects on the intensive margin and for secondary earners. In this section, I consider possible reforms to the EITC. One simple starting point is that the EITC has remained fixed in real terms for all but the largest families since the last expansion was fully phased in in 1996—more than 20 years ago. Yet since that time, wage stagnation and decline has been significant (Autor 2014), justifying an increase in the credit (Hoynes, Rothstein, and Ruffini 2018). More generally, the success of the EITC, and the consistent findings across the expansions to the credit over the past two decades (Nichols and Rothstein 2016) suggest that we should expand the EITC further. Several congressional proposals do just that (e.g., Senator Brown and Rep. Khanna’s Gain Act, Senator Harris’s Lift the Middle Class Act). One approach to increasing the EITC is to increase the credit along its current schedule. Given the evidence that the EITC increases the extensive margin of labor supply without much distortion due to the phase-out rate as well as the 2018 increase in the CTC (primarily benefiting those in the EITC phase-out and beyond), a more targeted expansion focused on the flat and phase in regions may be another choice.
Reforms aimed at equity across family types
One most commonly raised limitation of the EITC is the omission of a sizable credit for taxpayers without children. Figure 8 illustrates the variation in generosity of the credit by plotting the equivalence-scale-adjusted maximum EITC by filing status (married, single) and number of children (zero, one, two, three). 10 (The equivalence scale accounts for differences in family size.) For each family type, the equivalized maximum credit is expressed relative to the maximum benefit (equivalence scale adjusted) of a single adult with no children. If maximum benefits varied in a way that was consistent with equivalence scales, then all of the measures would equal 1. Clearly that is not the case. The largest deviation from equity across groups is the very low credit for childless tax filers; for example, the credit for single parents with one (two) children is more than five (seven) times as generous, taking into account differences in family size. The figure also shows that the EITC is less generous for married couples compared to singles (based on the maximum credit) and also exhibits variation in generosity across the number of children. Hoynes (2014) proposes reforming the credit such that it delivers an equitable benefit across different family sizes (thus the credit is equal in equivalence scale terms across groups).
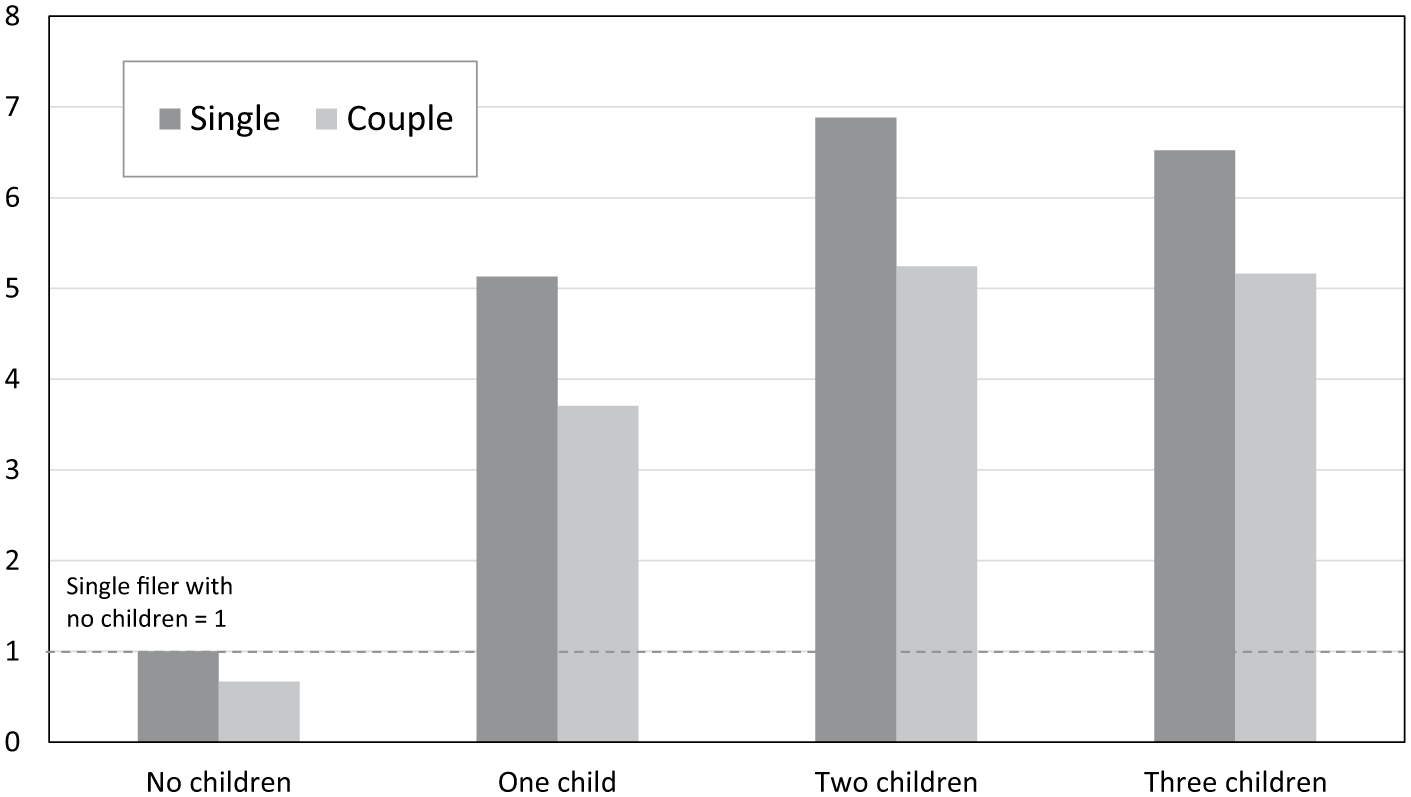
Equivalence Scale Adjusted Maximum EITC Credit by Filing Type and Family Size (Relative to Maximum Credit for Single/No children)
This argument could be extended to argue for covering for a more significant credit for childless workers. Given the EITC’s historical focus on targeting children (families with children), it is unclear whether support is sufficient for a sizable EITC to childless taxpayers. But given concerns about employment rates and poverty in this group (Joyce and Ziliak 2019) and the success of the EITC, there is a strong argument to be made in favor of an expansion for childless workers. 11
Reforms aimed at paid tax preparers
The discussion here described the large costs imposed on EITC filers through the paid tax preparation industry. Clearly there are benefits to tax preparers—tax filers may have limited knowledge of tax law, and the rules concerning refundable credits are particularly complex. However, this is a largely unregulated industry with predatory fees and little oversight. An often-proposed reform is to require preparers to meet criteria, including education, training, continuing education, and competency exams, as well as the requirement to register with the IRS. 12 A second reform is requiring a standardized disclosure of fees. A third approach is to expand IRS free filing and experimentation to improve use of these services. Currently the IRS provides free filing for taxpayers with AGI below $66,000; GAO (2019) estimates that 70 percent of taxpayers are eligible, yet only 3 percent use it.
Reforms aimed at reducing noncompliance
Noncompliance—errors in the claimed EITC—is an often-cited concern with the program. This represents a potential cost of engaging in redistribution through a complex tax system (where an often-cited benefit is the low administrative costs). The most recent IRS study (U.S. Department of the Treasury 2018), based on IRS audits of a sample of tax returns for tax year 2014, produces an estimated overpayment rate of 23.4 percent of all EITC dollars paid. 13
The largest source of noncompliance relates to misclaiming of qualifying children, which occurs in 30 percent of returns with overclaims and represents more than half of overclaimed dollars. As discussed in this article, the EITC’s qualifying child rules are complex, and understanding who should be claiming the child may be particularly difficult in changing family situations involving separated, divorced, or three-generation families. The residency requirement—requiring the child to live with the claimant for more than half the year—is particularly challenging to document.
The other major category of overclaiming is income misreporting; this is more common but results in smaller overpayments, on average. About two-thirds of returns with overclaims misreport income. Incorrect reporting of self-employment income is the primary source of income misreporting. This is widespread among self-employed and sole proprietors regardless of EITC eligibility, far exceeding overpayment costs in the EITC.
Commercial tax preparers account for a disproportionate share of returns found to have overclaims—60 percent of paid tax preparers had errors compared to 50 percent among self-filers (GAO 2014). Volunteers in the IRS-sponsored Volunteer Income Tax Assistance (VITA) and Tax Counseling for the Elderly (TCE) free assistance programs have the lowest error rates. One approach to reduce noncompliance could operate through the regulation of paid tax preparers. Additionally, we could adopt approaches to increase transparency, for example, in reporting tax preparer specific (or office specific) error rates. As with the development of compliance trainings for judges in the Social Security Disability Insurance (SSDI) program, high-noncompliance tax preparers could be required to engage in compliance training. In fact, the VITA volunteers are required to undergo rigorous certification training and pass a competency examination before they are allowed to prepare and file returns.
Additionally, expanding the EITC for taxpayers without children (and more generally equalizing EITC generosity across family types and family sizes as discussed) may have the added benefit of reducing noncompliance around qualifying children. Part of the EITC noncompliance around qualifying children may arise from the incentive to claim a child even if the rules are not satisfied—to move from a very small childless credit to the much larger credit for filers with children. The larger the childless credit, the smaller the incentives to misclaim.
One reform that would address this issue is to expand third-party reporting of self-employment income. By contrast, with third-party reporting of wage and salary income, there is very little noncompliance for wage and salary workers. Another approach would be to limit self-employment income for qualifying for the EITC, such as what California did in 2015 when it introduced the CalEITC. This limitation was ultimately eliminated, because of concerns for low-income self-employed workers being shut out of the state credit.
Structural reforms
As reviewed above, the EITC is highly effective at transferring income while encouraging work. But that leaves behind those that, for one reason or another, are not able to maintain stable work (in the short or longer run). In fact, after welfare reform and the reduction in the out-of-work cash safety net (Bitler and Hoynes 2010), there are concerns that our social safety net is inadequately protecting those not working. There are many ideas for how to address this, some that intersect with the tax credits that are the focus of this article. Shaefer et al. (2018) and Bitler, Hines, and Page (2018) proposed expansions of the CTC to extend to nonworking families. Senators Bennet and Brown have proposed the American Family Act, which extends the CTC to nonworking families and increases the maximum credit to $3,000 per child ($3,600 for younger children). This approach, also referred to as a child allowance, is present in many countries and was recently promoted in a National Academies of Sciences, Engineering, and Medicine (2019) report aimed at identifying policies to reduce child poverty. Dube (2018) proposed a reform to the EITC (called the Earned and Basic Income Tax Credit) where those with no earnings receive a benefit equal to some proportion (he suggests 50 percent) of the maximum benefits. Another approach gaining attention in the United States and around the world is to provide a Universal Basic Income (Hoynes and Rothstein 2019). All of these approaches would provide more assistance out of work but reduce the returns to entering work (illustrating the protection versus distortion trade-off present in all redistribution programs). 14
Another way to improve the performance of the EITC is to increase the take-up rate. We know that take-up is lower among those eligible for smaller credits, notably those with low earning levels and childless filers (Plueger 2009). A challenge with increasing take-up for this group is that it disproportionately includes those not filing a tax return (and not legally required to). Recent evidence based on experimental designs and IRS partnerships shows that informational mailers can lead to significant increases in take-up (Bhargava and Manoli 2015; Guyton et al. 2016). Ongoing work in California, using various information treatments, is aimed at bringing in nonfilers for the new CalEITC (targeted at workers with earnings in the phase-in region). This work should be continued to establish best practices for increasing program take-up. Another approach that needs testing is the use of prepopulated tax returns, at least for earnings obtained by third-party reporting.
A final type of change to consider would be one aimed at distributing EITC payments periodically over the year rather than as annual lump sums, as this is commonly raised as an impediment to assisting families throughout the year. If EITC recipients are liquidity constrained, then an annual lump-sum payment has a smaller effect on the household’s welfare than would one that is evenly distributed. Whether EITC recipients prefer periodic versus lump-sum payments is not well understood. Beginning in 1978, the Advance EITC provided a mechanism for recipients to receive their credits in their paychecks throughout the year, but take-up was extremely low (under 1 percent), and the option was canceled in 2010. This could indicate that recipients prefer their EITC payments as lump sums, seeing the program as a form of forced saving (Halpern-Meekin et al. 2015). On the other hand, the lack of use of the Advance EITC may stem in part because of lack of information or behavioral impediments to completing administrative processes and the power of changing defaults (Madrian and Shea 2001). Though prior experiments that informed recipients about the Advance EITC to overcome default behavior had only minor impacts on take-up (IRS and U.S. Department of the Treasury 1999; D. Jones 2010), recent evidence from the Chicago EITC Periodic Pilot suggests that there may be interest in a change to the delivery system (Bellisle and Marzahl 2015). In the pilot, the treatment group received half of their (projected) EITC payment in four quarterly payments (with the other half as the usual annual refund), while the control group had the status quo delivery system. At the end of the pilot, 90 percent of the treatment group stated a preference for this approach, and only 1.3 percent received overpayments (and often cited concern about period payments).
Conclusion
In this article, I examined the state of tax policy for low-income families with children. I focused primarily on the EITC but also discussed the much less targeted CTC. I discussed the goals of the programs (distributional, encouragement of work, and limiting of administrative costs) and summarized the existing research to assess how the programs meet the goals.
The EITC meets well all three of these goals. The policy provides substantial increases to income for low- to moderate-income families; it is the largest antipoverty policy for families with children in the United States. A large body of research shows that the first-order behavioral effect of the policy is to increase employment among single mothers with children. Married couples also benefit from the program, although the policy does induce modest reductions in secondary earner employment. Administrative costs are low, particularly compared to the income-support-based alternatives to the EITC. However, fees for paid tax preparers lead to a reduction in the net benefits to the credit. Compliance remains an issue, with complicated rules for claiming children and lack of third-party reporting for all self-employment income. The CTC is much less favorable: it is not targeted (particularly with the 2018 expansion), with a credit of $2,000 per child extending high up the income distribution and with a lack of full refundability for the lowest-income workers.
I also discussed possible reforms to the EITC and to a lesser extent the CTC. I organized possible reforms into four categories including those aimed at improving equity across groups, regulating paid tax preparers, reducing noncompliance, and other design and delivery reforms.
An often-cited reform possibility is to extend the EITC more equitably to adults without children, who are largely left out of the benefits for the EITC. This should reduce poverty and increase employment for this group, their noncustodial children (if they have any), as well as having some potential to reduce noncompliance. More generally, I discussed using equivalence scales to create horizontal equity across tax filing units, those without children and those with a varying number of children.
Another high-value set of reforms would be focused on the paid tax preparation industry, with goals of improving quality, reducing noncompliance, and generating price transparency. The industry is largely unregulated, with a history of charging predatory fees. The fees lead to a substantial reduction in the net benefits of the credit and potentially higher noncompliance. I also call out the need for more research and experimentation to learn more about how to increase take-up of the EITC particularly for those with the lowest earnings levels. Additionally, many have argued for delivering the EITC more smoothly throughout the year rather than in a lump sum; I argued here for more research to gain insights into the possible benefits for this structural reform. Finally, I discussed the merits of a structural reform to the CTC, which extends the benefits more fully to the lowest-income families.
Footnotes
Note:
I thank Janet Holtzblatt, Elaine Maag, and the Center for Budget and Policy Priorities EITC team for discussions about policy reform and Krista Ruffini for excellent research assistance. The article draws heavily from my prior reviews including Eissa and Hoynes (2006a, 2006b); Hoynes and Rothstein (2017); and Hoynes, Rothstein, and Ruffini (2018). I thank these coauthors for the many useful discussions on these issues.
Notes
Hilary Hoynes is a professor of economics and public policy and the Haas Distinguished Chair in Economic Disparities at the University of California, Berkeley, where she also codirects the Berkeley Opportunity Lab. She is a member of the American Academy of Arts and Sciences, the National Academy of Social Insurance, and is a fellow of the Society of Labor Economists.