
Abstract
This study investigates rural-urban differences in COVID-19 in terms of its impacts on the physical and mental health, social relationships, employment, and financial hardship of U.S. working-age adults (18–64). I use data from the National Wellbeing Survey collected in February and March 2021 (N = 3,933). Most respondents (58 percent) reported that COVID-19 has had a negative impact on their lives. Residents of rural counties adjacent to metro areas reported the worst outcomes: they were more likely than residents of large urban counties to report positive tests for coronavirus; to live with someone who tested positive or have a close friend or family member outside of the household test positive; to have a close friend or family member hospitalized; to seek treatment for anxiety or depression; to be late paying rent, mortgage, and other bills; to not be able to afford groceries or other necessities; and to get a loan from family or friends. Recovery policies must consider geographic variation in COVID-19 vulnerability and impacts.
In the early weeks of the spread of the COVID-19 pandemic in the United States, I suggested that COVID-19 could hit rural areas harder than urban areas (Monnat 2020). I argued that while lower population density may protect rural areas from spread early on, both the population composition (e.g., older, higher chronic disease rate) and contextual features (e.g., less health care availability, labor markets not conducive to remote work) of rural communities put them at risk of higher rates of mortality from COVID-19 once the virus spread to those places. I also suggested that the longer-term health and economic impacts could be worse in rural than in urban areas due to their less-diversified labor markets. Since then, a growing body of research has shown higher cumulative COVID-19 infection and mortality rates in rural counties (Cromartie et al. 2020; Huang et al. 2021; Pender 2021; Sun, Cheng, and Monnat 2021) but potentially less severe labor market impacts (Brooks, Mueller, and Thiede 2021; Cho, Lee, and Winters 2020; Cromartie et al. 2020). However, rural areas are not homogenous, and we have seen significant variation in COVID-19 spread and mortality rates among rural communities (Cheng, Sun, and Monnat 2020; Cohen 2020; Cromartie et al. 2020; Sun, Cheng, and Monnat 2021).
The consequences of COVID-19 extend far beyond the deaths that it has caused. The pandemic itself, and the spread mitigation policies that it prompted, may have adversely affected physical and mental health (Brodeur et al 2021; Czeisler, Lane, et al. 2020; Gassman-Pines, Ananat, and Fitz-Henley 2020; Killgore et al. 2020; McPhee et al. 2020; Twenge and Joiner 2020), led to employment loss and financial hardship (Board of Governors of the Federal Reserve System 2020; Congressional Research Service 2021; Horowitz, Brown, and Minkin 2021), disrupted family and social relationships (Calbi et al. 2021; Kovacs et al. 2021; Philpot et al. 2021), and disrupted health care access (Czeisler, Marynak, et al. 2020). Existing research on the secondary impacts of the pandemic in the United States generally shows worse outcomes among non-Hispanic Blacks, women, and individuals without a college degree (Collins et al. 2021; Dias 2021; Kesler and Bash 2021; Landivar et al. 2020; Montenovo et al. 2020; Perry, Aronson, and Pescosolido 2020). In a sample of rural residents of the western United States conducted in June 2020, Mueller et al. (2021) found significant negative self-reported impacts of the pandemic on employment, overall life satisfaction, mental health, and economic outlook, with half of rural western respondents perceiving some level of negative impact on their lives. However, to my knowledge, no research exists that examines rural-urban differences in COVID-19 experiences and secondary outcomes for the United States overall. More than forty-six million people live in rural America, including some the country’s most economically and health-vulnerable populations (Cromartie et al. 2020). Identifying the geographically differential impacts of the COVID-19 pandemic on well-being is essential for informing recovery policies and prevention strategies for future pandemics.
The lack of geographic identifiers and small nonmetro sample sizes in most national surveys that have assessed COVID-19 impacts prohibit examination of differences among rural communities. This article addresses this limitation by leveraging a unique and timely national survey of working-age adults that oversampled rural residents to identify differences in COVID-19 experiences and impacts related to physical and mental health, social relationships, employment, and financial hardship across the rural-urban continuum.
Rural Vulnerability to Negative COVID-19 Experiences and Impacts
Several individual-level differences exist between rural and urban residents, and contextual differences between rural and urban areas may drive differential vulnerability to COVID-19 and its secondary impacts. On the one hand, rural populations are more socioeconomically vulnerable, with higher rates of poverty (Thiede, Lichter, and Slack 2018) and underemployment (Jensen and Slack 2003; Slack, Thiede, and Jensen 2020) and lower levels of education (Carr and Kefalas 2009) and health insurance coverage (Gong et al. 2019). These factors may make them more vulnerable to COVID-19 related economic shocks and associated physical and psychological health consequences. On the other hand, recent research suggests that urban workers were less likely than their rural peers to be paid for missed work hours and more likely to be unable to work, to be unable to look for work, or to work remotely during the height of COVID-19 (Brooks, Mueller, and Thiede 2021). Rural schools were also more likely to remain open or operated remotely for much shorter periods than urban schools (Gross and Opalka 2020), reducing burdens on rural parents to home-school children. Differences in labor markets and working conditions may have reduced rural employment impacts, while simultaneously increasing risk of disease transmission. Government-deemed essential industries like meatpacking, agriculture, and prisons are disproportionately located in rural areas, placing rural workers at increased risk of infections, even as they continued to earn paychecks (Hooks and Sawyer 2020; Peters 2020; Taylor, Boulos, and Almond 2020).
Rural populations are also sicker than urban populations. They report worse self-rated physical and mental health and have higher rates of most chronic diseases (Meit et al. 2014; Monnat and Pickett 2011; National Center for Health Statistics 2019; Peters 2020). Not only do these poor health profiles increase risk of dying from COVID-19 among those who contract it (Li et al. 2021; Centers for Disease Control and Prevention 2020), but they may also increase risk of secondary physical and mental health impacts from the pandemic. Risks may be exacerbated for those who delayed or forewent medical care due to limitations on elective procedures and/or concerns about contracting the virus. Even before COVID-19, rural residents faced challenges with accessing health care. Since January 2005, 181 rural hospitals have closed, with a record 19 closures in 2020 alone (Cecil G. Sheps Center for Health Services Research 2021). Many of the rural hospitals that are available had less capacity to deal with surges in cases, limited medical personnel, and less access to ventilators and personal protective equipment for health care providers. COVID-19 testing rates were also lower in rural areas (Monnat 2020; Souch and Cossman 2021), increasing risk of community spread. These factors may all have secondary effects on physical and psychological health.
Finally, rural residents have been more resistant to engaging in preventive behaviors, such as mask wearing (Callaghan et al. 2021; Haischer et al. 2020), avoiding dining out (Callaghan et al. 2021), and getting vaccinated (Kaiser Family Foundation 2021). These factors may contribute to increased COVID-19 spread in rural communities but may also buffer against poor social and psychological health outcomes. Likewise, governors in rural states (those with lower population density) were slower to enact statewide state-at-home orders (Lin et al. 2021) and were less likely to enact physical distancing mandates (Adolph et al. 2021) than governors in more urban states. This may have reduced employment, economic, social, and psychological health impacts (at least in the short term) but simultaneously increased risk of disease spread.
Based on the differences described here, we might expect rural residents to face less severe employment and financial impacts but more severe physical and mental health impacts. However, rural areas are not homogenous. Some rural communities are more vulnerable than others to severe economic shocks and health crises. One specific delineating factor may be whether the rural community is adjacent to a metropolitan area. In the early months of the pandemic, COVID-19 infection rates were higher in rural counties adjacent to metro areas compared to remote rural counties that do not neighbor a metro area (Cheng, Sun, and Monnat 2020; Zhang and Schwartz 2020). Other recent research shows that remoteness may have buffered certain types of rural communities, particularly those dominated by services and recreation-based employment, from COVID-19 spread (Sun, Cheng, and Monnat 2021). COVID-19 may have had spillover effects from urban to adjacent rural communities due to employee and consumer commuting patterns. Likewise, the economic consequences of business closures in large urban hubs may cascade to workers and consumers in neighboring rural communities. Therefore, we might expect more severe COVID-19 impacts on residents in rural communities adjacent to metro areas than among residents of remote rural communities.
This study examines rural-urban continuum differences in self-reported COVID-19 infection experiences as well as health, social, employment, and financial impacts among working-age adults. While COVID-19 deaths disproportionately affected older adults, research to date shows larger employment (Montenovo et al. 2020) and psychological impacts (Czeisler, Lane, et al. 2020) on working-age adults. Working-age adults suffered nearly all of the excess mortality from causes other than COVID-19 in 2020, driven mostly by drug overdoses (Glei 2021). They also experienced the brunt of employment disruption and role strain related to work, family, caretaking, and homeschooling (Collins et al. 2021; Kesler and Bash 2021; Landivar et al. 2020; Montenovo et al. 2020), portending severe impacts on physical and mental health and social and financial well-being in this age group.
Data and Variables
Individual-level data on COVID-19 experiences and perceived impacts come from the National Wellbeing Survey (NWS; Monnat and Rhubart 2021). The NWS is a national cross-sectional survey of 4,014 U.S. adults ages 18 to 64 designed by researchers in the Syracuse University Lerner Center for Public Health Promotion and conducted from February 1 to March 18, 2021. The sample includes respondents from all fifty states and the District of Columbia representing 1,430 U.S. counties. We designed the survey using several validated measures from other national surveys. The original aim of the survey was to collect data on adult physical, mental, psychological, and social health and well-being, with most questions constructed before COVID-19 hit in 2020. With the arrival of COVID-19, we delayed the launch of the survey and added a COVID-19 module (described below).
The survey was administered using Qualtrics Panels, an online survey platform that maintains a database of several million U.S. adults who volunteer to participate in surveys. Online panels are increasingly used in social science research due to efficiency, cost, timeliness, and data quality (Hays, Liu, and Kapteyn 2015). Qualtrics recruits panel members from various sources, including website intercept recruitment, member referrals, targeted email lists, gaming sites, customer loyalty web portals, permission-based networks, and social media. Qualtrics panel members’ names, addresses, and dates of birth are typically validated via third-party verification. For our survey, panel members received an invitation with a hyperlink to the NWS. Qualtrics compensated respondents in various ways, such as airline miles and gift cards, to which respondents agreed when they joined the panel. The average time for survey completion was 22.9 minutes.
The sampling frame was adults ages 18 to 64 residing in the United States. We provided Qualtrics with quotas for age, race, sex, and rural-urban continuum based on the American Community Survey estimates for 2015 to 2019 and the U.S. Department of Agriculture Economic Research Service’s (ERS) rural-urban continuum codes (RUCCs). We intentionally oversampled rural residents to achieve large enough sample sizes to conduct robust within-rural analysis. Accordingly, Qualtrics constructed poststratification weights to align the sample with the U.S. population distribution. Given differential survey response by educational attainment, the poststratification weight also incorporated education. Online appendix Table A1 shows that, when weighted, the NWS sample is representative of the U.S. population ages 18 to 64 by age, sex, race/ethnicity, education, marital status, presence of children in the household, and rural-urban continuum. Means across several county-level demographic and socioeconomic characteristics from the 2015 to 2019 American Community Survey are also comparable between counties represented by NWS respondents and U.S. counties overall (see online appendix Table A2).
The overall response rate (number of surveys completed vs. number of surveys invited) was 5 percent, which is in line with the rate of 7.3 percent on the Census Household Pulse Survey in the same time period and higher than the Census Household Pulse response rates of <4 percent in its first three weeks of collection (U.S. Census Bureau 2021). However, the traditional response rate is not a useful measure for opt-in online panels because they use passive recruitment (e.g., invitation could be embedded in a longer email, repeated invitations are not sent), and it does not account for whether the email was opened or sent to junk folders. Instead, the completion rate is a better response measure. Of the 11,580 panel members who accessed the NWS landing page and reviewed the informed consent, 4,014 met the age eligibility criteria and data quality threshold, 1 providing a strong completion rate of 40.4 percent. We also compared prevalence rates on several health conditions and COVID-19 NWS items to similarly worded items from other national surveys, including the Census Household Pulse Survey waves that were conducted during the same weeks as the NWS. We found prevalence rates to be comparable (see online Appendix Table A3).
Data were missing on 6 percent of cases (N = 242) for the variables included in this analysis. Most of the missing responses (N = 161) were on household income. Rather than exclude these respondents, I created a dummy variable for missing income. Accordingly, the final analytic sample size was 3,933.
Outcomes
The outcomes are several items related to COVID-19 infection and exposure experiences and how COVID-19 impacted respondents along domains of mental and physical health, relationships with friends and family, employment, and financial hardship. A benefit is that the “causal attribution” of COVID-19 on people’s lives is supplied by the respondents themselves. The survey was conducted approximately one year after COVID-19 took root in the United States. Therefore, the information is timely and captures the cumulative toll of the pandemic in its first year. Nonetheless, because we do not have baseline measures on well-being outcomes, the relationships cannot be concluded to be causal.
General COVID-19 impact is measured with the item: “All things considered, what impact would you say COVID-19 has had on your life?” with the response options of: “COVID-19 has had a negative impact on my life”; “COVID-19 has had a positive impact on my life”; and “COVID-19 has not really affected my life one way or the other.” This was the first item asked in the COVID-19 module, reducing the probability that respondents’ answers on this item were influenced by subsequent items about specific COVID-19 experiences. For analysis, I dichotomized this item so that 1 = negative impact and 0 = positive or no impact.
Experiences with COVID-19 exposure and infection are captured with eight dichotomous items that were prefaced with, “Which of the following experiences of COVID-19 applied to you?”: received a coronavirus test (calculated by combining responses on two items that asked about whether they received a coronavirus test and it came back positive or negative); tested positive for coronavirus; hospitalized due to coronavirus; close family member hospitalized due to coronavirus; lived with someone who tested positive; close friend or family member outside of household tested positive; anyone in household (including self) had to quarantine due to exposure; and family member or friend died from coronavirus.
Physical and mental health impacts are captured with six items. Global physical health impact is captured with the item, “Overall, please rate how the COVID-19 pandemic has affected the following aspects of your life: physical health,” with a 5-point response scale of substantially improved to substantially worsened. An item with the same wording captures global mental health impact. I dichotomized each of these items so that 1 = somewhat or substantially worsened and 0 = no change or somewhat or substantially improved. Health care access impact is measured with the dichotomous item: “Was there a time in the past 12 months when you needed to see a doctor but could not: because of COVID-19?” Mental health treatment seeking is measured with the dichotomous item, “Which of the following experiences did you have as a result of COVID-19 related closures and/or other social distancing protocols? I sought treatment for anxiety or depression.” Anxiety and depression were captured in the survey with the PHQ-4. Depression is measured with the two items: “During the past two weeks, how often have you been bothered by: having little interest or pleasure in doing things; and feeling down, depressed, or hopeless.” Anxiety is measured with the two items: “During the past two weeks, how often have you been bothered by: feeling nervous, anxious, or on edge; and not being able to control worrying.” Responses are measured on a 4-item scale from not at all to nearly every day. I classified respondents as experiencing anxiety or depression based on optimal cut-point criteria (scores ≥3 on each combined two-item scale; Kroenke et al. 2007). Although these items did not ask explicitly about COVID-19 impacts on anxiety and depression, the NWS survey was administered while the United States was still in the midst of the pandemic (February/March 2021), and the items asked about experiences in the past two weeks. The Census Household Pulse Survey also regularly includes these items to surveil anxiety and depression prevalence throughout the pandemic.
Social impacts are captured with two items: “Overall, please rate how the COVID-19 pandemic has affected the following aspects of your life”: “relationship with immediate family”; “relationship with friends”, with a 5-point response scale of substantially improved to substantially worsened. I dichotomized both items so that respondents who reported somewhat or substantially worsened are coded 1 and all others are coded as 0 for each item.
Employment impacts are captured with eight dichotomous items prefaced with the question: “Which of the following experiences did you have as a result of COVID-19 related closures and/or other social distancing protocols?”: lost job; experienced a reduction in pay; was considered an essential worker; worked remotely; worked fewer hours than normal; worked more hours than normal; worked remotely while taking care of own children who could not attend daycare or school; unable to work because children could not attend daycare or school. I restricted analysis for the last two items to respondents who indicated that children under age 18 were living in the household (N = 1,495).
Finally, financial impacts are captured with five dichotomous items prefaced with the question, “Which of the following experiences did you have as a result of COVID-19 related closures and/or other social distancing protocols?”: late paying rent or mortgage; late paying other bills; could not afford groceries or other necessities; paid bills of friend or family members; and got a loan from family or friend. In addition, I include, “Overall, please rate how the COVID-19 pandemic has affected the following aspects of your life - financial situation.” I recoded the original 5-point response scale on the financial situation item so that those who responded with substantially or somewhat worsened were coded as 1 and everyone else was coded as 0.
Metropolitan status
The NWS includes respondent FIPS (Federal Information Processing System) codes, enabling me to identify the metropolitan status of county of residence. I classified metropolitan status with four categories based on the USDA ERS rural-urban continuum codes (RUCCs): large urban (RUCC 1, counties in metro areas of one million population or more); medium/small urban (RUCCs 2 and 3, counties in metro areas of less than one million population); rural adjacent to metro (RUCCs 4, 6, and 8, nonmetro counties adjacent to metro areas); and remote rural (RUCCs 5, 7, and 9, nonmetro counties not adjacent to metro areas). Sample sizes do not permit further disaggregation.
Covariates
Regression models control for sex, race/ethnicity, marital status, number of adults and children under age 18 in the household, and whether the respondent moved to the county in the past 12 months. In stepwise models, 2 I examine the potential roles of socioeconomic status (household income in 2019, educational attainment, homeownership status) and political ideology (political party affiliation and 2020 presidential vote) in driving any observed rural-urban differences in outcomes. In the interest of space, I present only unadjusted prevalence rates and regression coefficients from the full models that include all variables listed here.
Analysis
I first present prevalence rates for each outcome for the sample overall and by metro status. I then present results from a series of three-level multilevel logistic regression models with random intercepts for counties and states to account for the geographic clustering of respondents. In lieu of random effects for states, I attempted models with state fixed effects (dummy variables). Several of the models did not converge, indicating that the sample sizes do not permit the inclusion of state dummy variables. Moreover, although significant state-level clustering occurred for some of the outcome variables (requiring a state-level random intercept in the model), this was not the case for all outcomes. For the sake of model consistency, I present findings only for the three-level models with random state-level intercepts. Accordingly, the models for some outcomes may be overspecified, and the findings related to metro status differences should be considered as conservative estimates; the standard errors are larger than they would be without the inclusion of state-level random intercepts.
The models predict metro status differences in the odds of each outcome. Large urban is the reference category. I first present results from unadjusted models that account only for the clustering of respondents within counties and states. The second set of models includes all covariates listed above. Given the large number of outcomes considered, I do not show coefficients for the covariates or for stepwise models, but they are available upon request. All models are weighted with the final poststratification weight created by Qualtrics to make the sample nationally representative by age, sex, race/ethnicity, educational attainment, and rural-urban continuum.
Results
Table 1 presents prevalence rates for all outcomes for the sample overall. Nearly 58 percent of respondents reported that COVID-19 has had a negative impact on their lives. More than a third of respondents met the criteria for depression (33.3 percent) and anxiety (34.2 percent) in the past two weeks and reported that their mental health (37.9 percent) and financial situation (34.6 percent) were worse due to COVID-19. Nearly 30 percent reported that their physical health was worse, and 18 percent reported seeking treatment for anxiety or depression due to COVID-19.
Prevalence Rates for Outcomes for Sample Overall
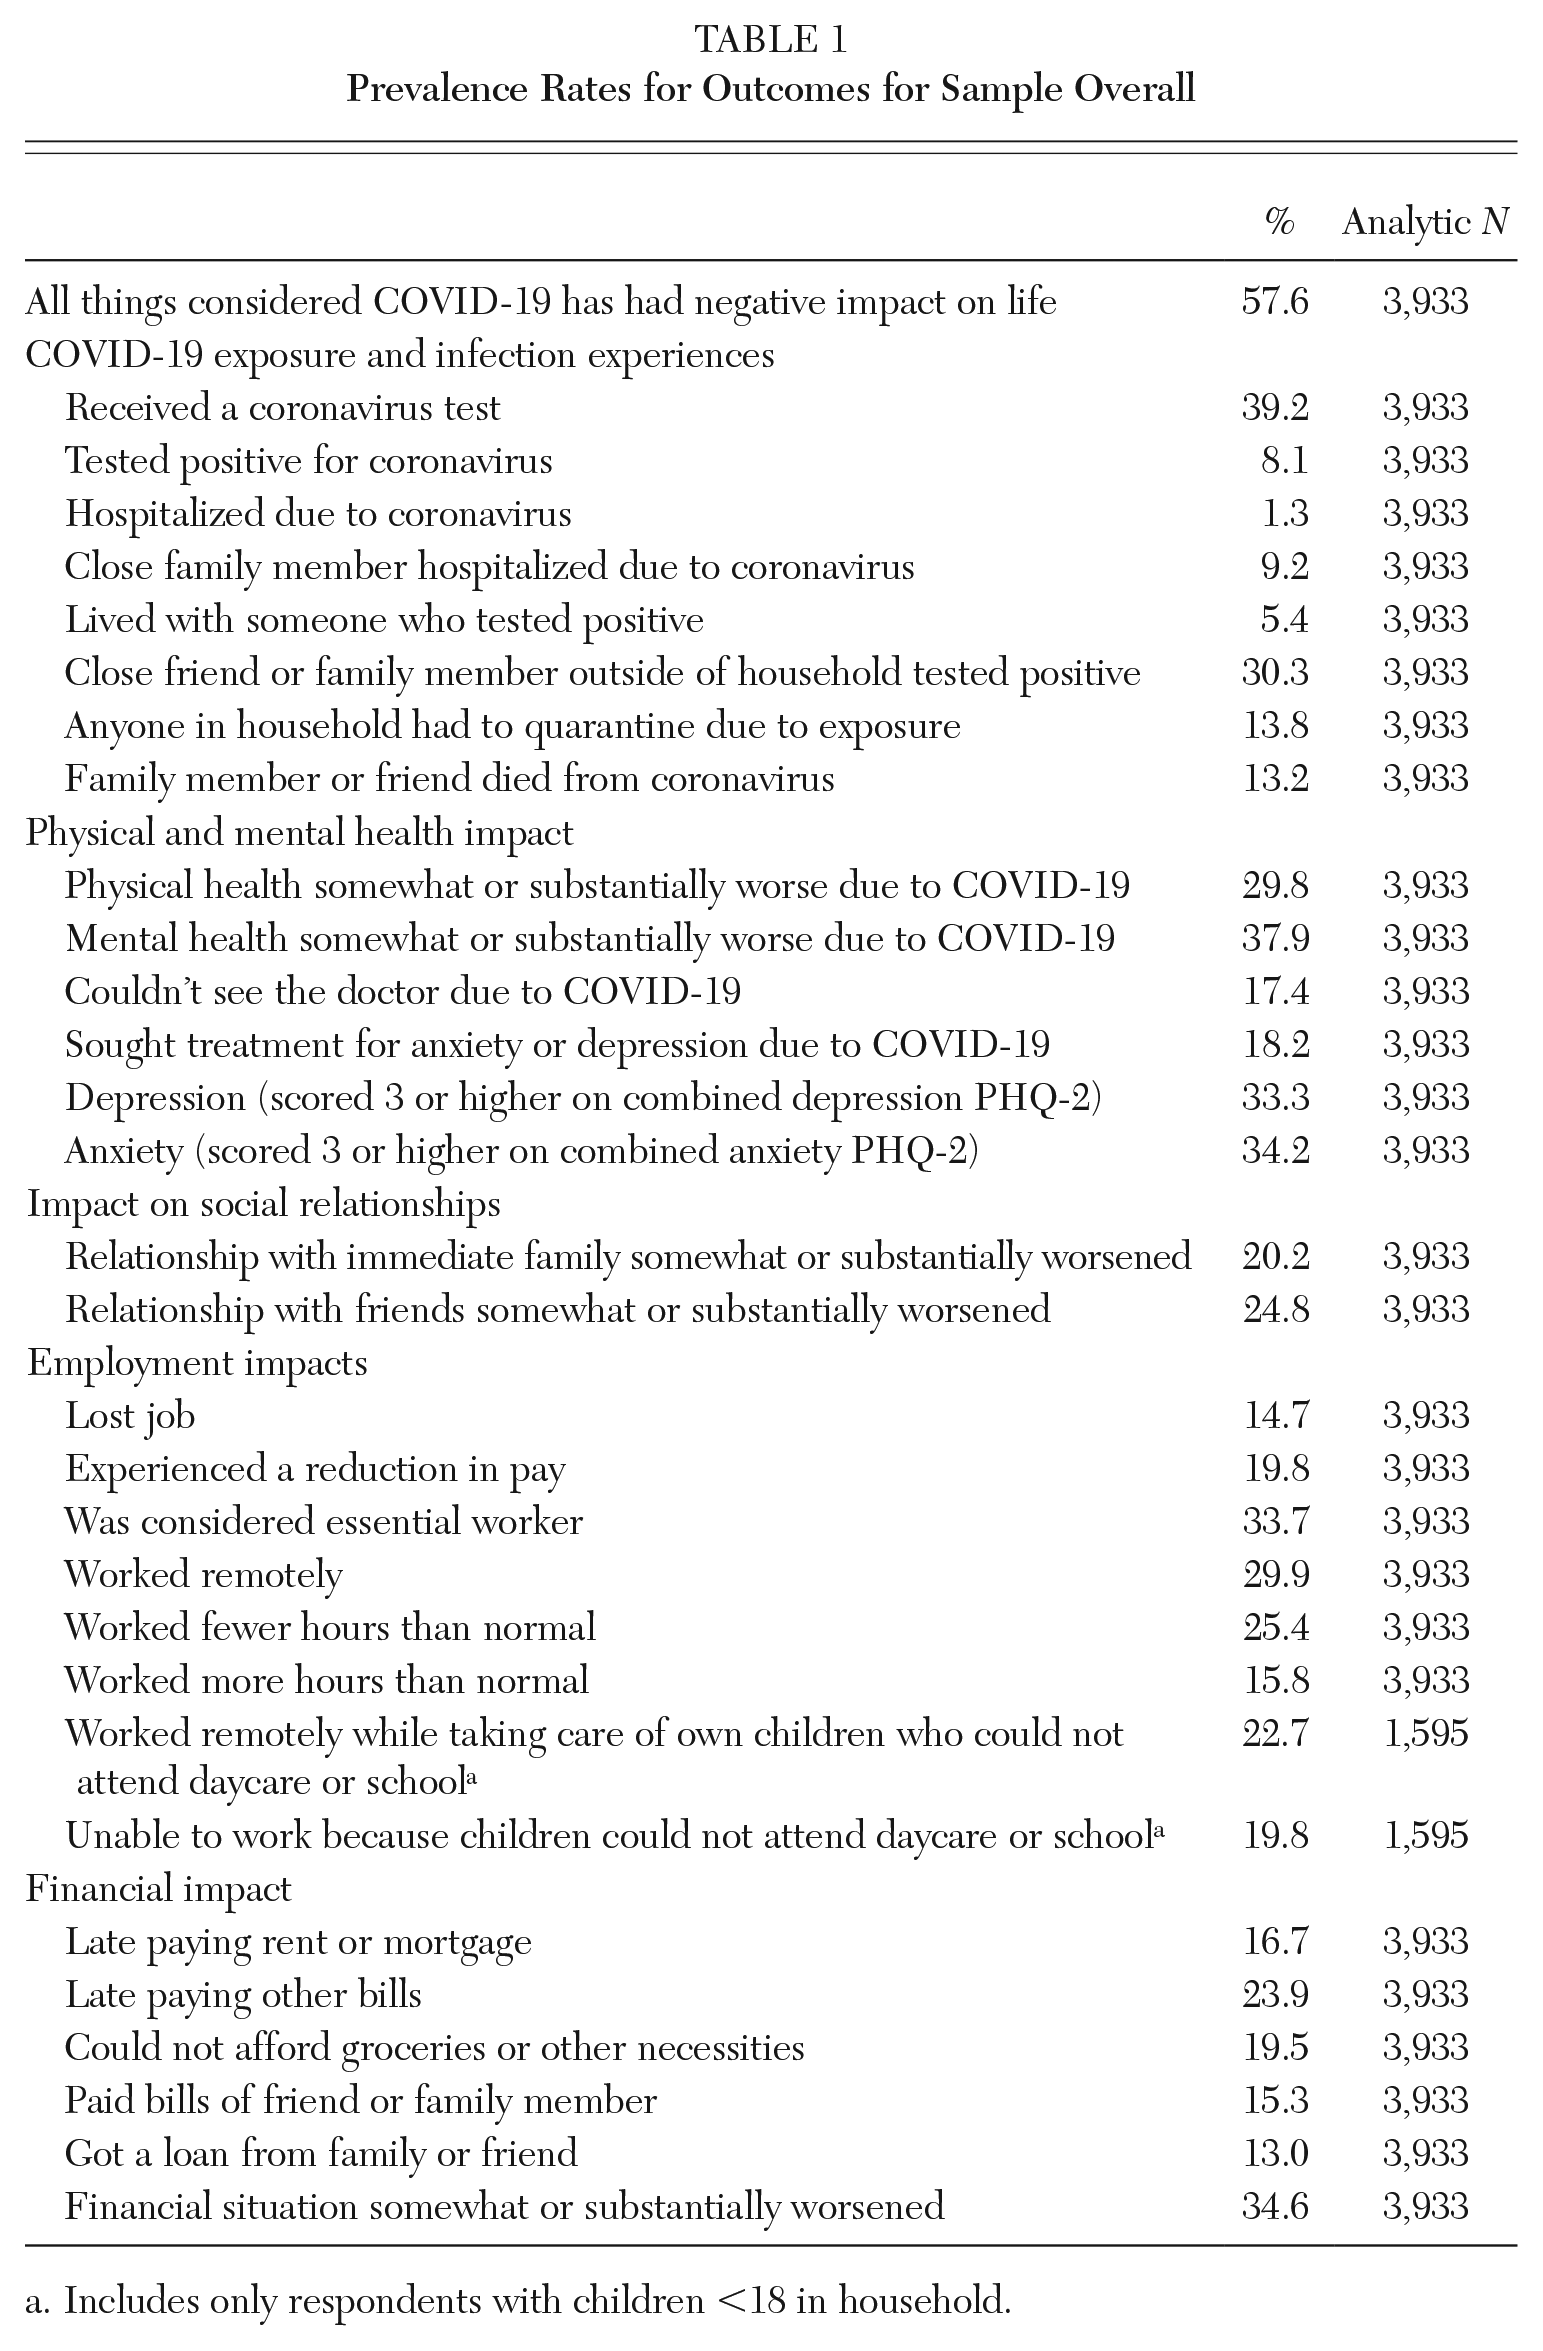
Includes only respondents with children <18 in household.
Figures 1 through 6 show metro status differences in unadjusted prevalence rates for each outcome. T-tests identify whether statistically significant differences existed compared to the reference category (large urban). Of the thirty-one outcomes, statistically significant differences exist in twenty-four. There are not significant differences in the global COVID-19 impact item (Figure 1).

COVID-19 Has Had a Negative Impact on My Life
In terms of experiences with COVID-19 exposure and infection (Figure 2), residents of large urban counties are significantly more likely than residents of small urban and rural counties to have received a coronavirus test. Whereas 42.3 percent of large urban respondents reported receiving a test, only 34.8 percent of remote rural respondents reported being tested. Residents of metro-adjacent rural counties are significantly more likely than residents of large urban counties to have had a close family member hospitalized due to coronavirus (13.3 percent vs. 9.0 percent), have a close friend or family member outside of the household test positive (38.2 percent vs. 28.2 percent), have had anyone in the household quarantine due to exposure (18.9 percent vs. 13.4 percent), and to have a friend or family member die due to coronavirus (15.2 percent vs. 12.0 percent). Residents of remote rural counties are also more likely than those in large urban counties to have a friend or family member outside of the household test positive (34.4 percent), and residents of medium/small urban counties are more likely than those in large urban counties to have had a friend or family member die from coronavirus (14.9 percent).
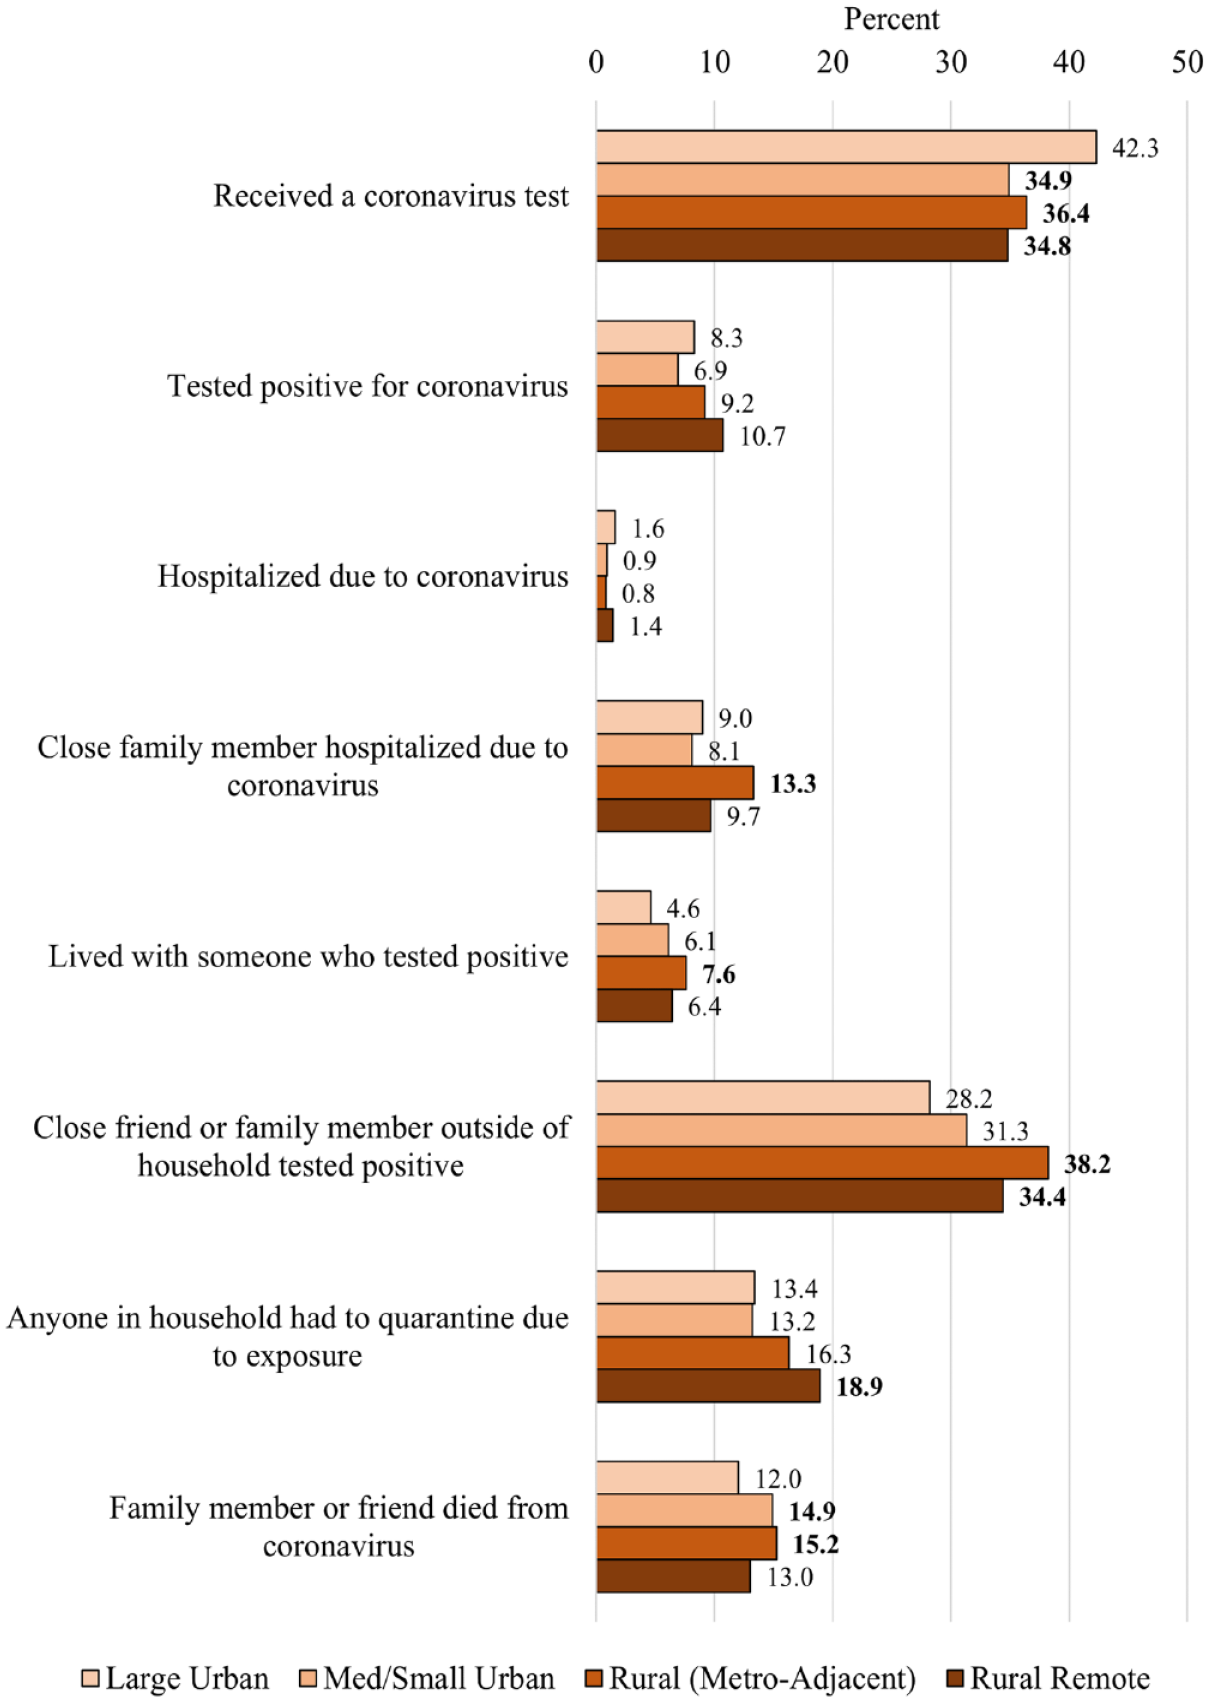
Experiences with COVID-19 Exposure and Infection
Residents of rural counties also experienced worse physical and mental health impacts than residents of large urban counties (Figure 3). Respondents in rural counties adjacent to metro areas were more likely than those in large urban counites to report that their mental health worsened due to COVID-19 (40.4 percent vs. 36.1 percent) and that they sought treatment for anxiety or depression (23.6 percent vs. 17.1 percent). They were also more likely to meet the criteria for depression and anxiety, as were residents of small/medium metro counties and remote rural counties.
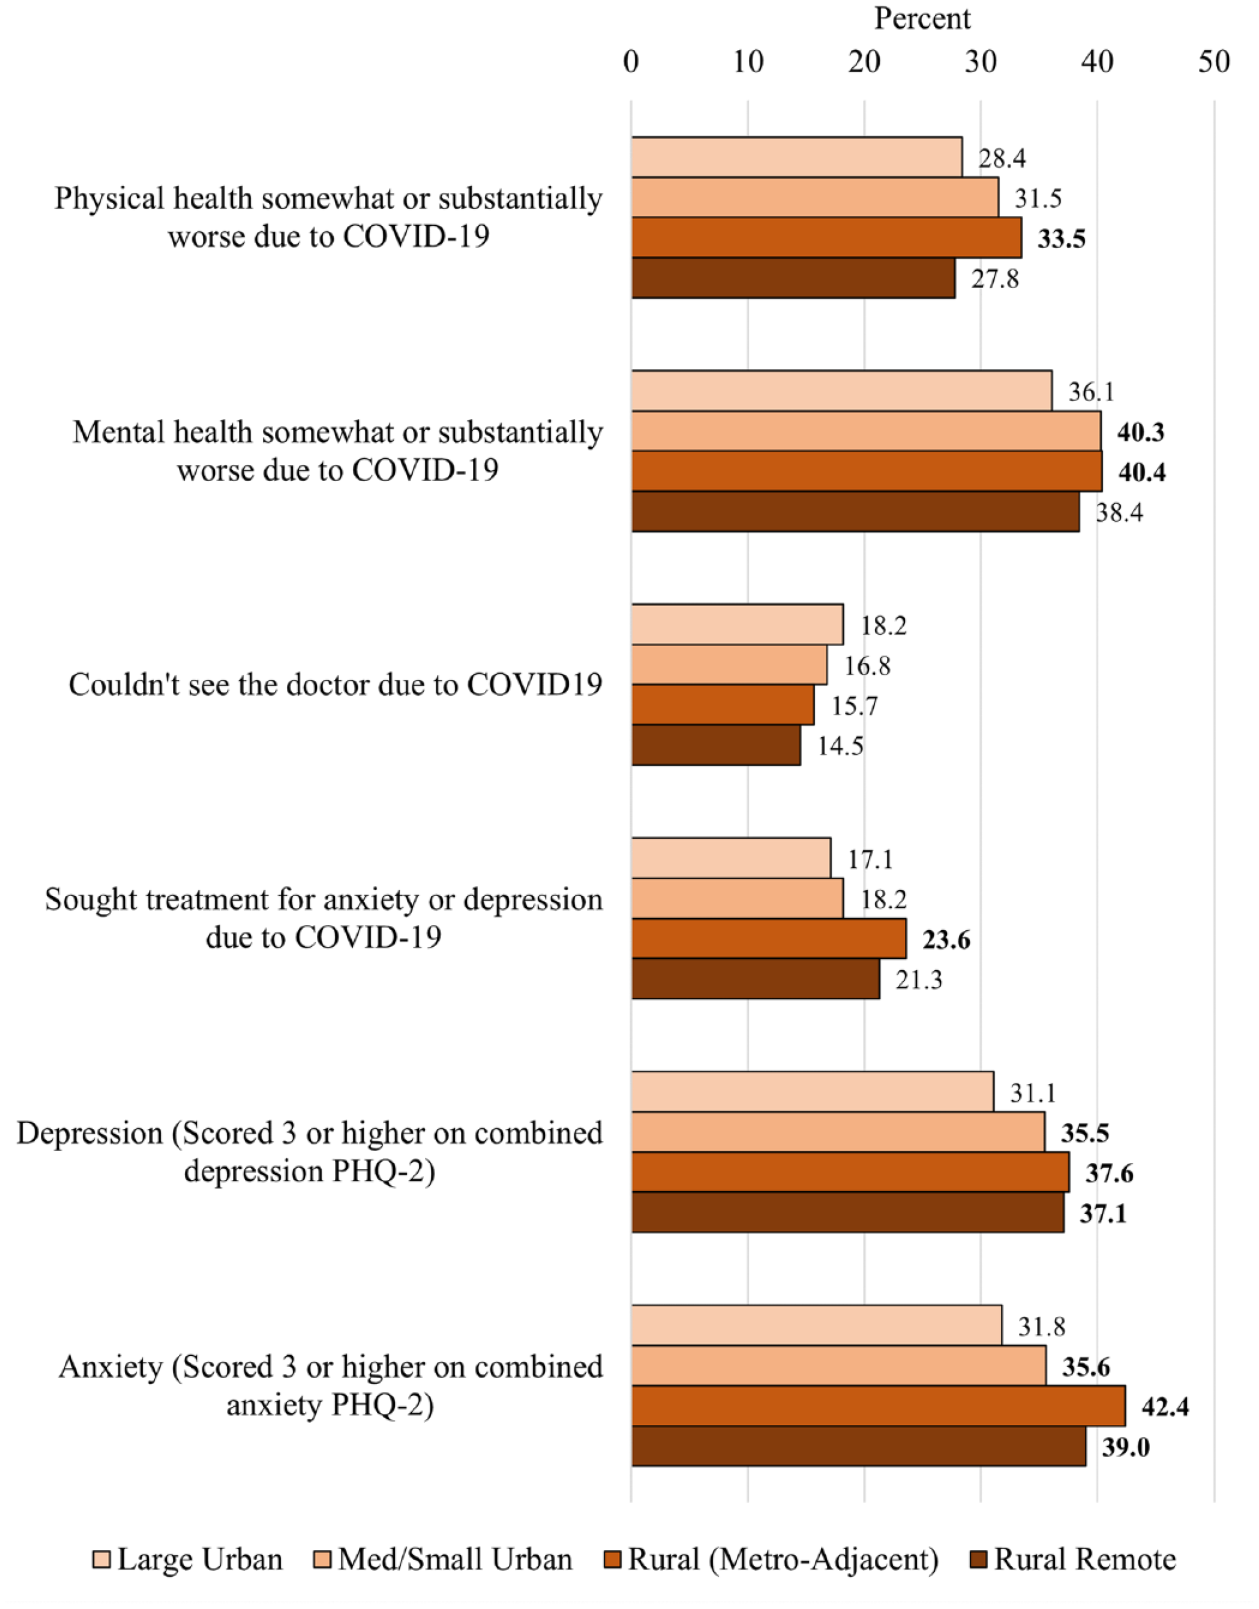
Physical and Mental Health Impacts
In terms of social impacts (Figure 4), residents of rural counties adjacent to metro areas were significantly more likely than their large urban peers to report that their relationship with their immediate family worsened (25.9 percent vs. 19.4 percent). The difference for relationship with friends was not statistically significant.
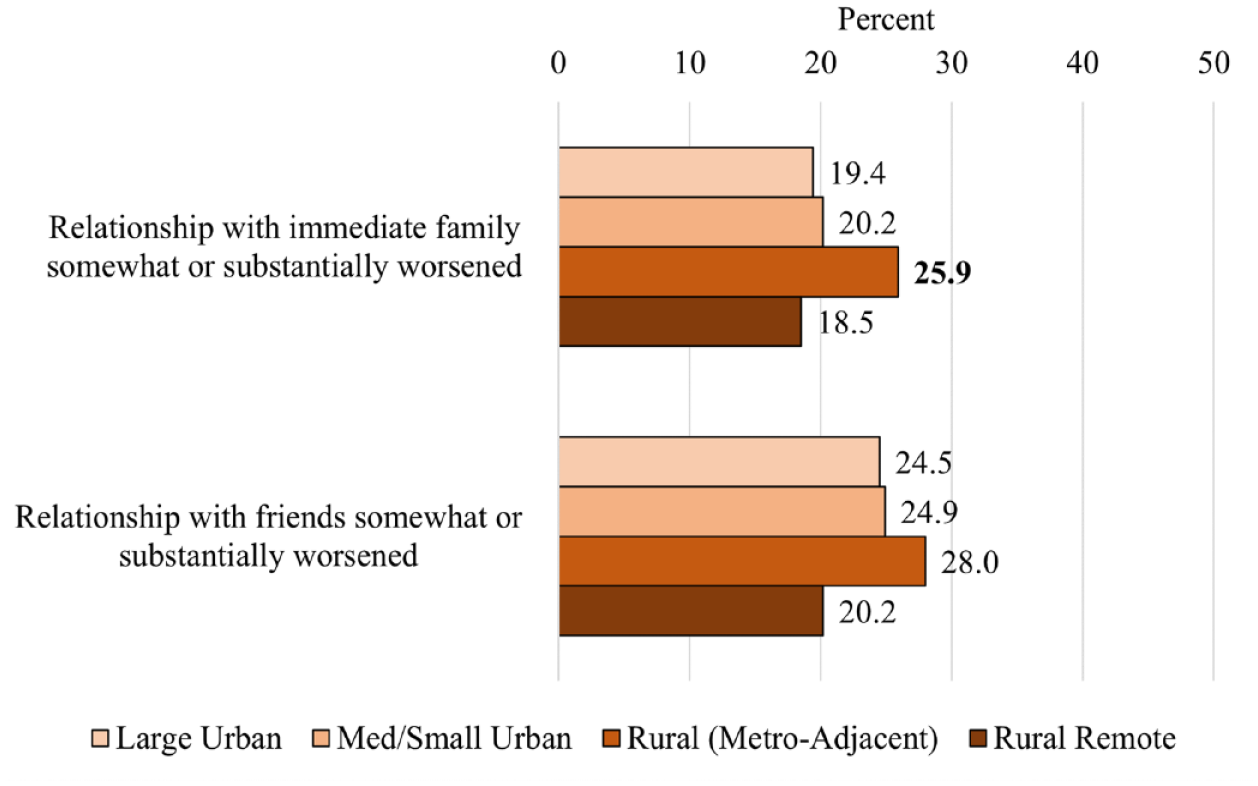
Social Impacts
Conversely, rural residents performed better on several employment outcomes (Figure 5). Residents of large urban counties were the most likely to report losing a job (16.2 percent), experiencing a reduction in pay (21.7 percent), working remotely (33.7 percent), working both fewer (27.1 percent) and more (17.3 percent) hours than normal, and working remotely while taking care of children who could not attend day care or school (31.3 percent).
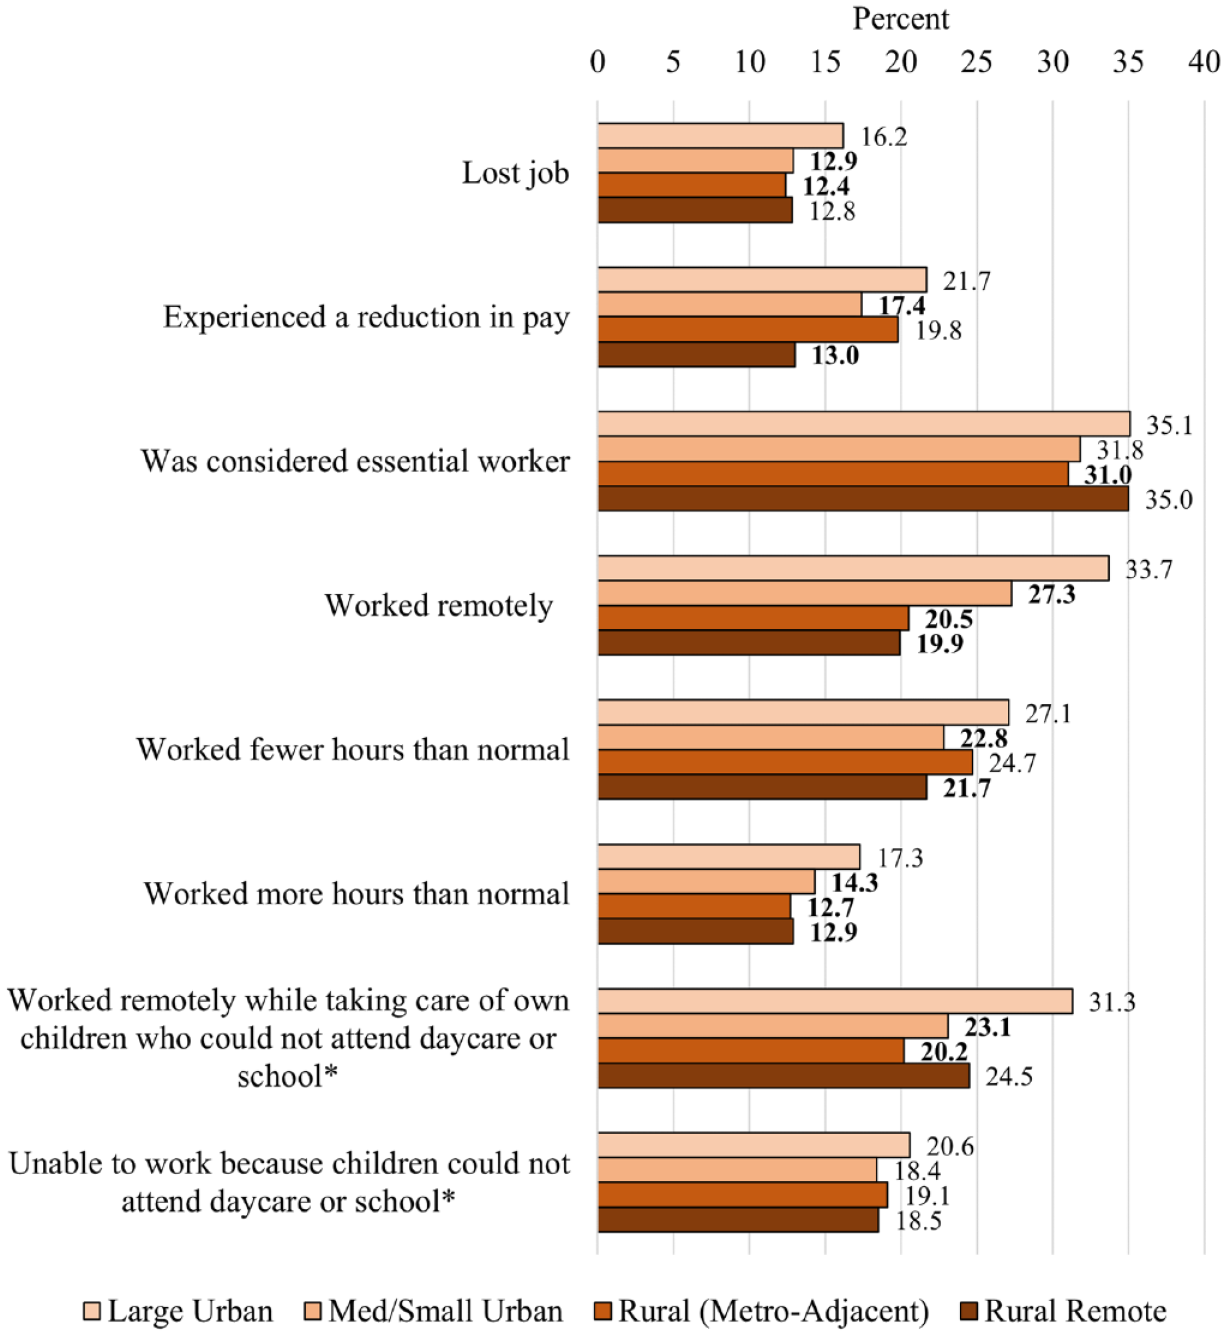
Employment Impacts
Despite their comparative advantage with employment outcomes, residents of rural counties adjacent to metro areas reported the worst financial impacts (Figure 6). They were the most likely to report being late paying the rent or mortgage, late paying other bills, not being able to afford groceries or other necessities, getting a loan from a friend or family member, and that their financial situation worsened during COVID-19. For example, whereas 33.1 percent of large urban residents reported that their financial situation worsened, 40.2 percent of rural residents adjacent to metro areas reported that their financial situation worsened. Residents of small/medium urban and remote rural counties were also more likely than those in large urban counties to report being late paying other bills and not being able to afford groceries or other necessities.
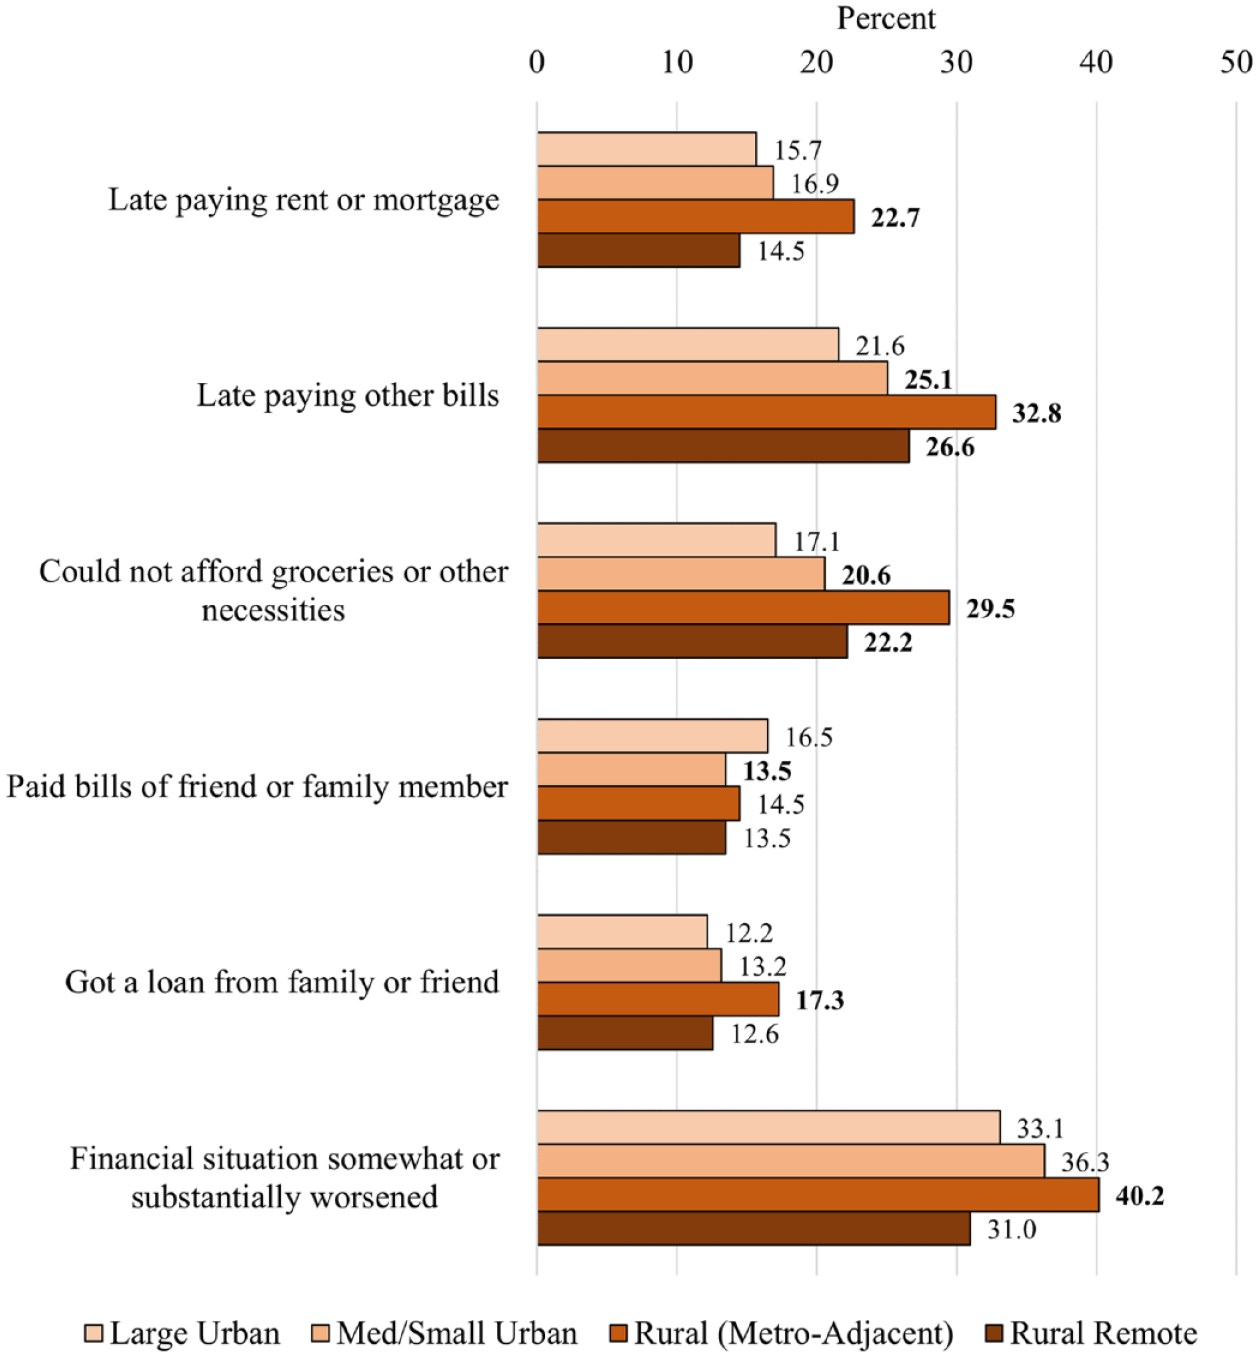
Financial Impacts
I present odds ratios (ORs) from unadjusted multilevel logistic regression models in Table 2 that account only for respondent clustering within states and counties. Although differences in some of the outcomes are no longer statistically significant after accounting for respondent clustering, the direction of the differences remains the same. Residents of rural counties adjacent to metro areas generally have higher odds of reporting adverse outcomes. Residents of remote rural counties were also more likely than those in large urban counties to report several of the negative health and financial outcomes, but few differences rose to the level of statistical significance.
Odds Ratios from Unadjusted Multilevel Logistic Regression Models Predicting COVID-19 Experiences and Impacts by Metro Status
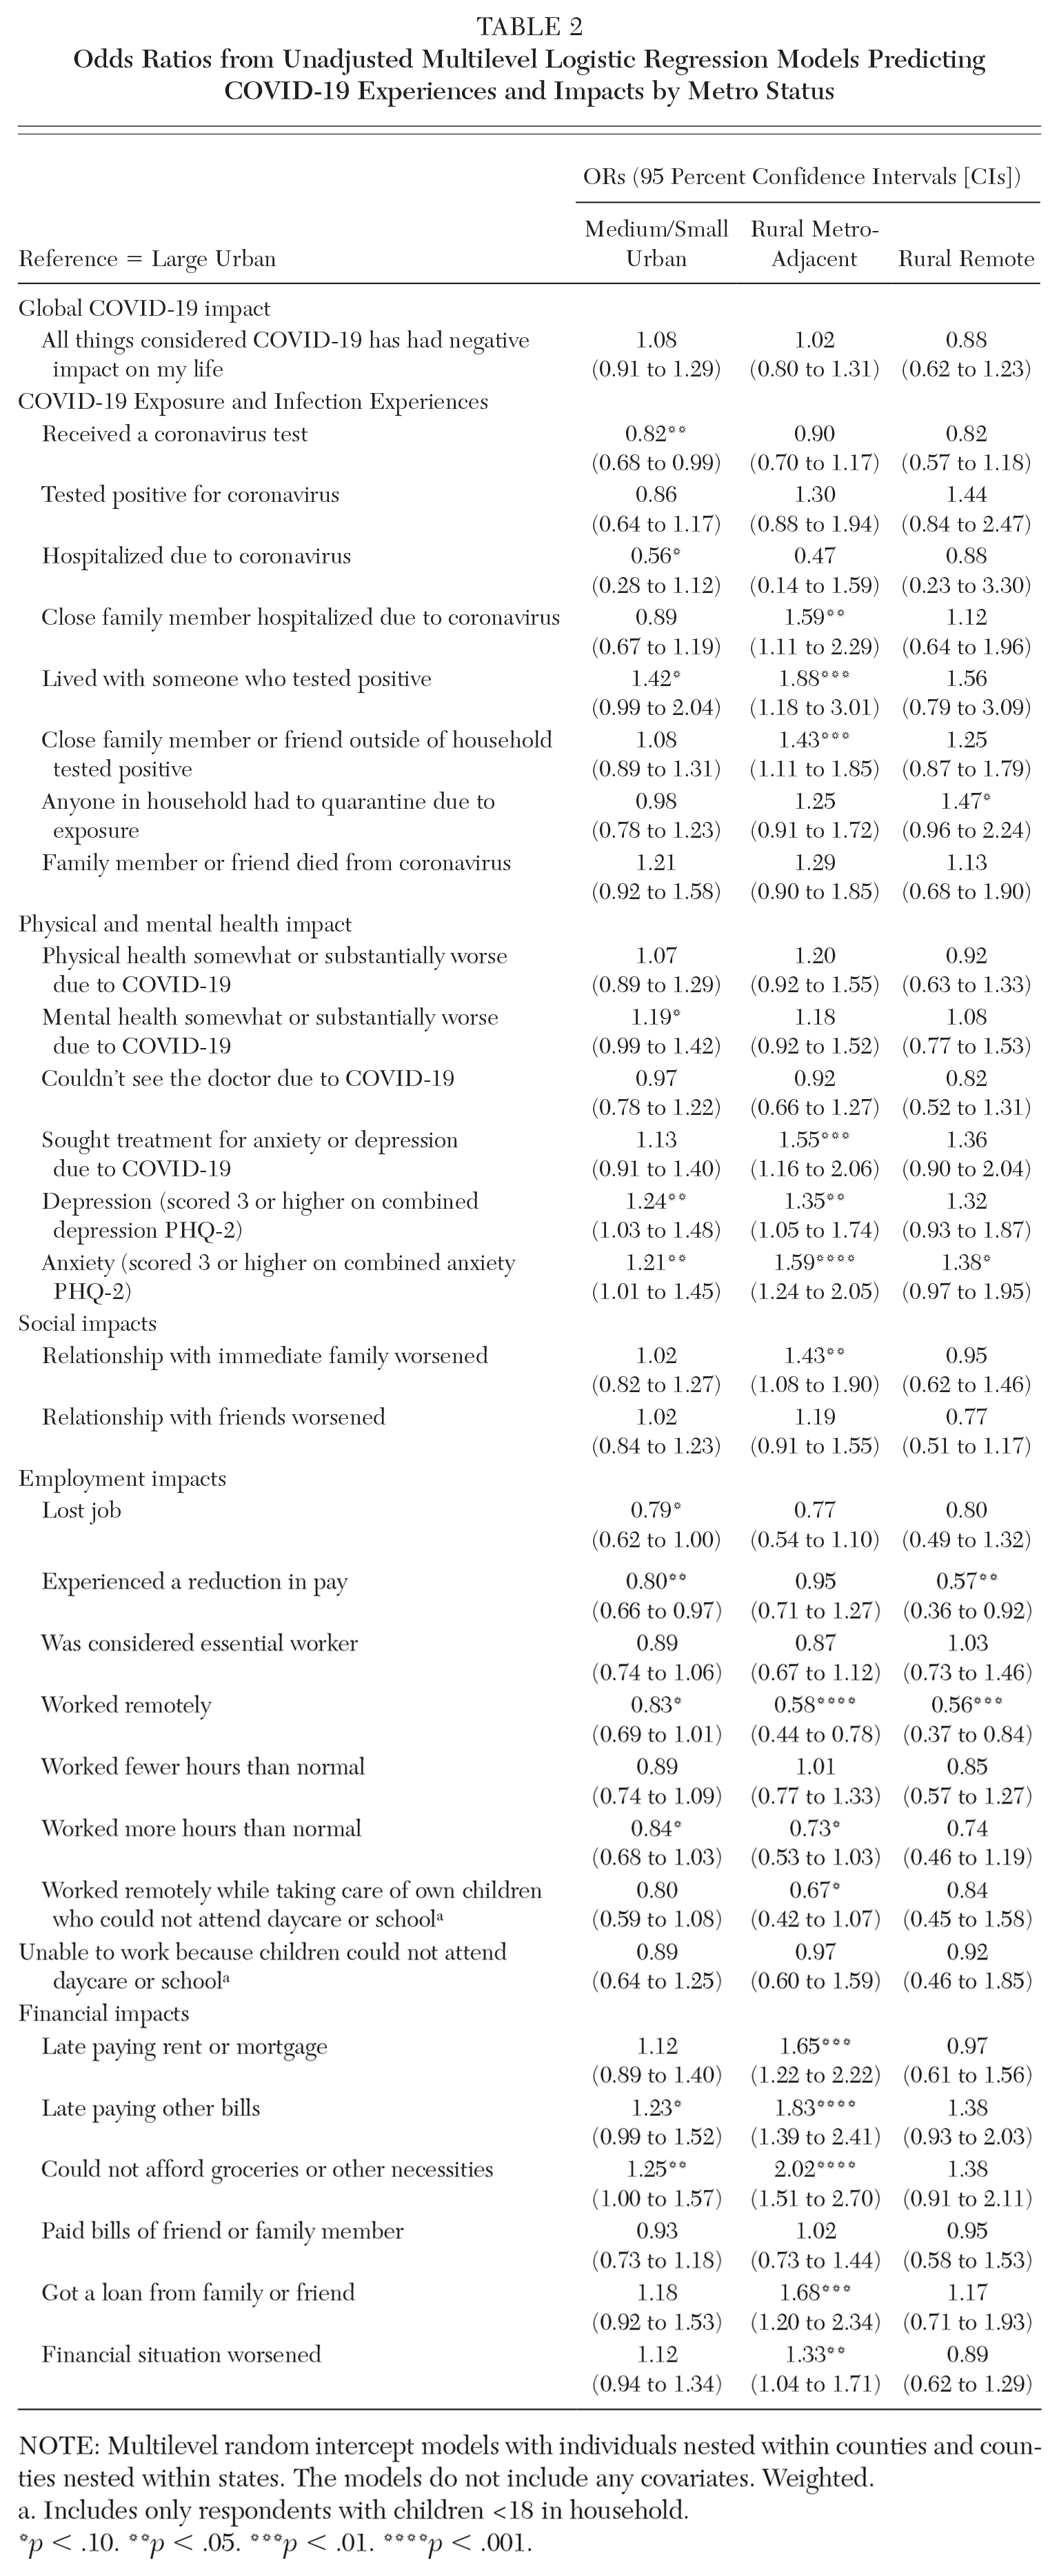
NOTE: Multilevel random intercept models with individuals nested within counties and counties nested within states. The models do not include any covariates. Weighted.
Includes only respondents with children <18 in household.
p < .10. **p < .05. ***p < .01. ****p < .001.
Table 3 presents ORs from the fully adjusted models. The inclusion of covariates eliminated the statistical significance for some, though not most, significant differences between residents of rural counties adjacent to metro areas and those in large urban counties. The magnitude of the rural metro-adjacent disadvantage declined or disappeared (depression, anxiety, relationship with family, financial impacts) due to the introduction of the socioeconomic variables (namely, household income and educational attainment). However, even after accounting for demographic characteristics, socioeconomic status (SES), and political ideology, residents of rural counties adjacent to metro areas remained more likely than their large urban peers to report testing positive for coronavirus (OR = 1.56 [95 percent CI = 1.01 to 2.37]) and living with someone who tested positive (OR = 1.94 [95 percent CI = 1.17 to 3.21]), having a close friend or family member hospitalized (OR = 1.65 [95 percent CI = 1.12 to 2.44]), having a close friend or family member outside of the household test positive (OR = 1.33 [95 percent CI = 1.01 to 1.75]), seeking treatment for anxiety or depression due to COVID-19 (OR = 1.40 [95 percent CI = 1.03 to 1.91]), meeting the threshold for anxiety (OR = 1.27 [95 percent CI = 0.97 to 1.67]), reporting worsened relationships with friends (OR = 1.30 [95 percent CI = 0.97 to 1.77]) and immediate family (OR = 1.31 [95 percent CI = 0.97 to 1.77]), working fewer hours than normal (OR = 1.29 [95 percent CI = 0.96 to 1.72]), being late paying rent or mortgage (OR = 1.56 [95 percent CI = 1.12 to 2.16]) and other bills (OR = 1.62 [95 percent CI = 1.20 to 2.17]), not being able to afford groceries or other necessities (OR = 1.58 [95 percent CI = 1.15 to 2.16]), and getting a loan from family or friends (OR = 1.66 [95 percent CI = 1.16 to 2.37]).
Odds Ratios from Adjusted Multilevel Logistic Regression Models Predicting COVID-19 Experiences and Impacts by Metro Status
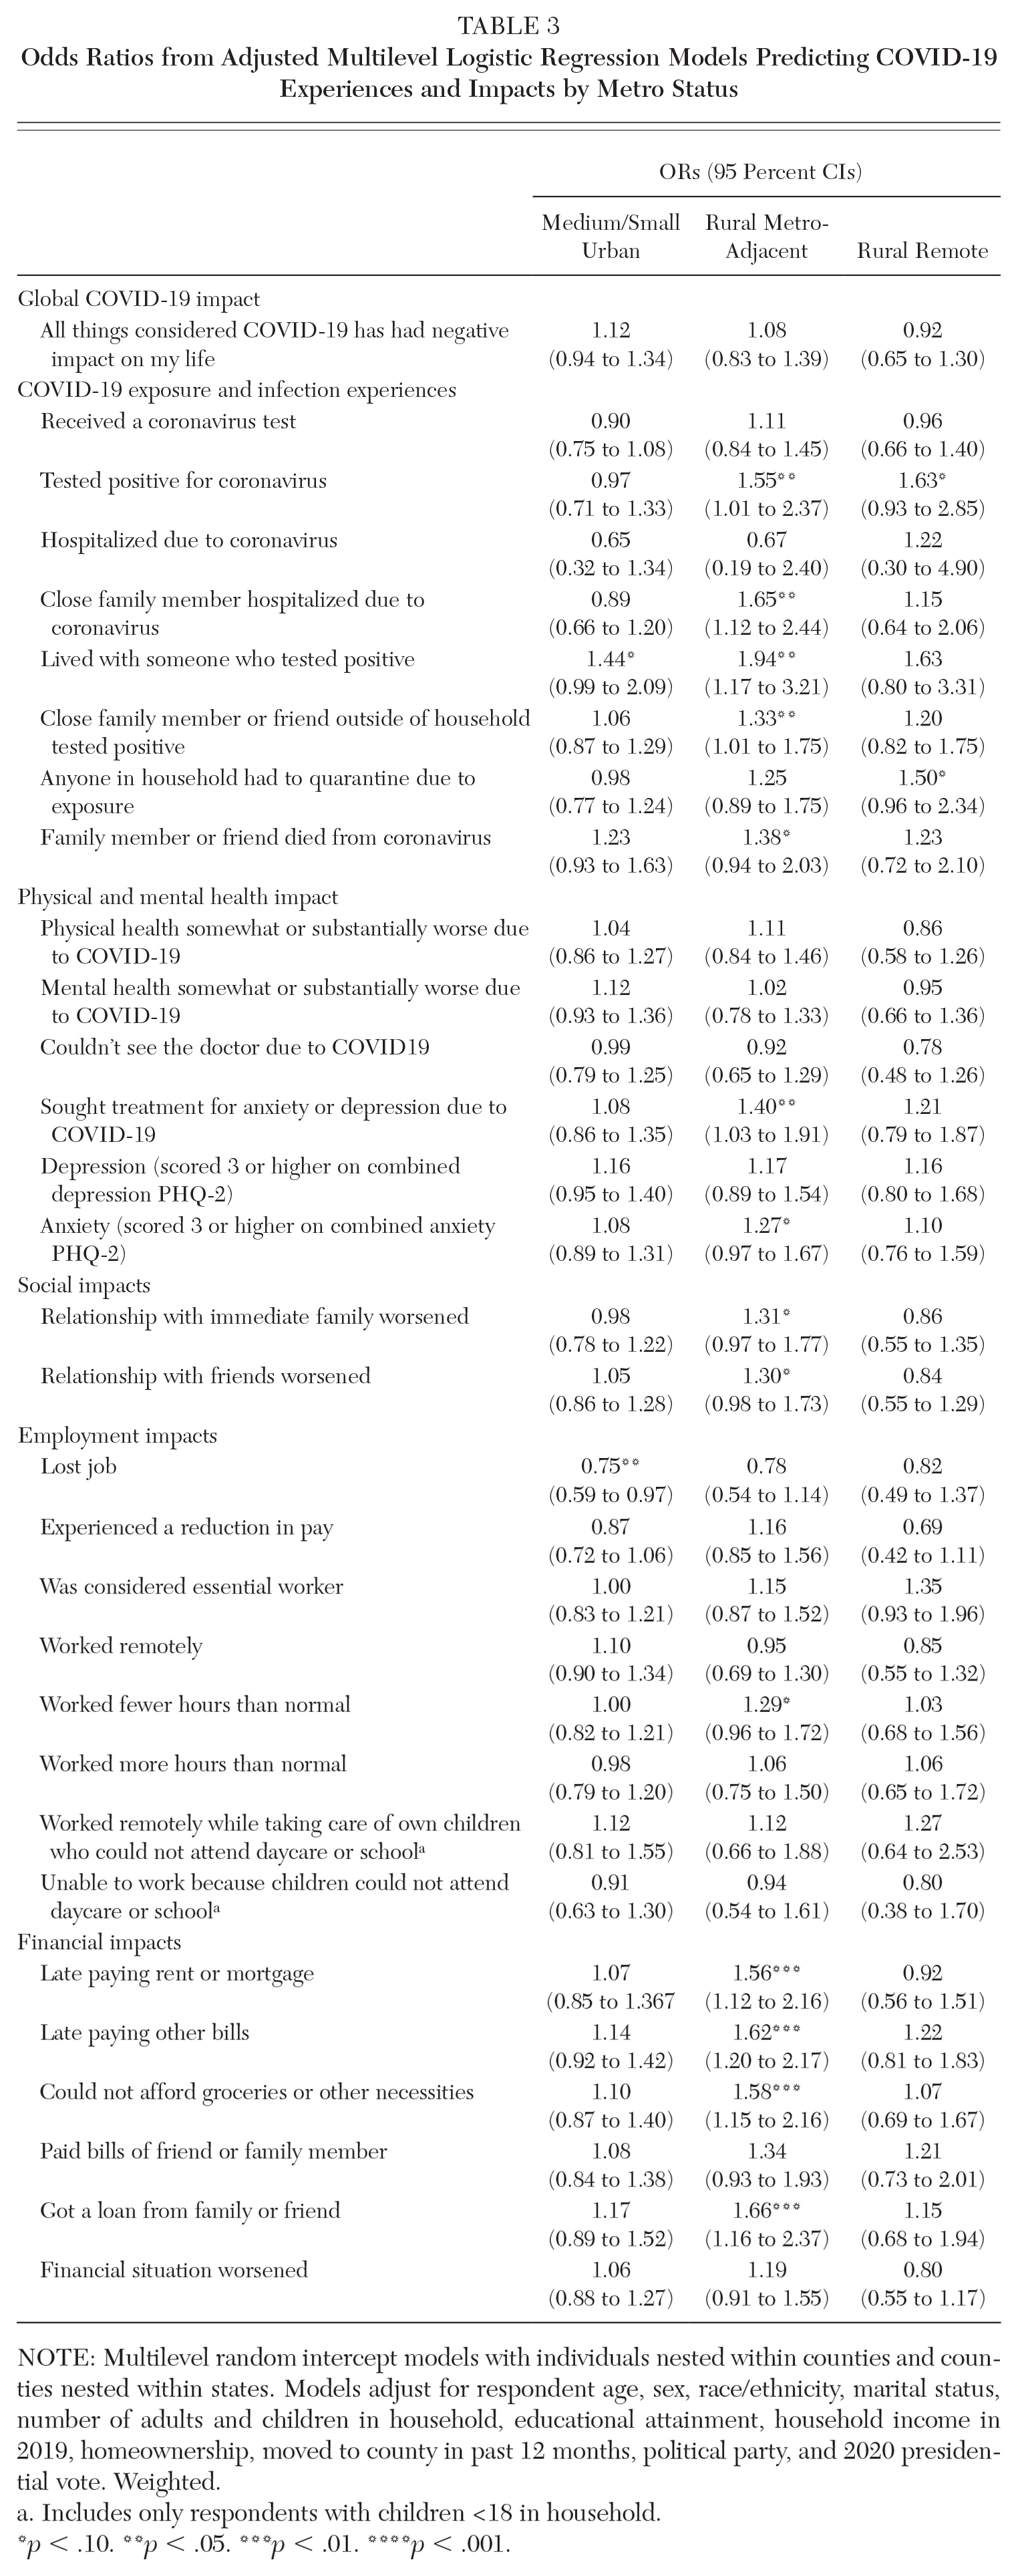
NOTE: Multilevel random intercept models with individuals nested within counties and counties nested within states. Models adjust for respondent age, sex, race/ethnicity, marital status, number of adults and children in household, educational attainment, household income in 2019, homeownership, moved to county in past 12 months, political party, and 2020 presidential vote. Weighted.
Includes only respondents with children <18 in household.
p < .10. **p < .05. ***p < .01. ****p < .001.
Discussion and Conclusions
The consequences of COVID-19 go beyond its direct impact on loss of life. Using data from a timely and novel survey of working-age adults (ages 18–64) conducted in February and March 2021 (the National Wellbeing Survey; Monnat and Rhubart 2021), this study shows widespread adverse secondary impacts from the COVID-19 pandemic, including to mental health, social relationships, and financial well-being. Well over half of respondents reported that the pandemic had a negative impact on their lives, and nonnegligible shares met the criteria for depression and anxiety and reported that their mental health, physical health, and financial situation were worse due to COVID-19.
As with COVID-19 mortality itself (Cheng, Sun, and Monnat 2020; Cromartie et al. 2020; Sun, Cheng, and Monnat 2021), the mental health, social, and financial consequences of the pandemic have not been distributed equally across geography. My findings show that residents of rural counties that are adjacent to metro areas were more likely than their large urban peers to report worse outcomes on multiple measures, including testing positive for coronavirus, living with someone who tested positive, having a close friend or family member outside of the household test positive, having a close family member hospitalized, seeking treatment for anxiety or depression, meeting the threshold for anxiety, and reporting that their relationships with friends or immediate family worsened. Consistent with previous research (Brooks, Mueller, and Thiede 2021), I found that residents of large urban counties were more likely to report losing a job, experiencing a reduction in pay, and working remotely. Despite their comparative advantage with employment outcomes, residents of rural counties adjacent to metro areas also reported the worst financial impacts, including being late paying rent, mortgage, and other bills; not being able to afford groceries or other necessities; and getting a loan from family or friends. Residents of remote rural counties also reported worse outcomes than large urban residents on several indicators.
Although it was beyond the scope of this study to attempt to explain these differences, results from stepwise models that included demographic characteristics, socioeconomic status, and political ideology suggest that much of the disadvantage experienced by residents of rural counties adjacent to metro areas is due to their lower household income and lower educational attainment. These disadvantaged socioeconomic profiles may make rural residents more vulnerable to economic shocks. However, SES may also be serving as a proxy for differences in workplace conditions and differences in types of jobs that can be done remotely versus jobs that can only be done in person. Differential engagement in prevention behaviors (e.g., mask wearing, avoiding gatherings) may also explain why residents of rural counties adjacent to metro areas reported the most personal experiences with COVID-19 infection (testing positive, having friends/family who tested positive, friend/family member hospitalized). Given recent research showing that higher county Trump vote share is associated with lower COVID-19 vaccination rates (Sun, Cheng, and Monnat 2021), it is noteworthy that the inclusion of political ideology (Trump vote share, political party) in these models did not explain rural-urban differences in the COVID-19 exposure outcomes.
The findings from this study should be considered in light of some limitations. First, the data are cross-sectional and capture one point in time during the pandemic (approximately one year after the virus began to spread in the United States). Although these analyses relied on questions where respondents place the causal attribution for outcomes on the pandemic, causality should not be presumed given that we do not have baseline measures of the outcomes and cannot assess how they changed from before the pandemic.
Second, the sampling frame for the NWS relies on a nonprobability opt-in survey panel, which raises concerns about noncoverage and differential nonresponse biases. Although the sample is demographically representative, it may not be representative on COVID-19 impacts. For example, those who were the most negatively impacted by COVID-19 (e.g., became most ill, lost loved ones) may be the least likely to complete surveys during this time. Conclusions drawn from research on consistency of findings between nonprobability and probability samples are mixed. While some raise doubts about the validity of nonprobability samples (Yeager et al. 2011; Loosveldt and Sonck 2008; Malhotra and Krosnick 2007), others find that even highly selective samples yield strong accuracy on demographics (Kalimeri et al. 2020) and risk factors for mortality (Batty et al. 2020); and for most questions, the differences between probability and nonprobability samples are small (Goel, Obeng, and Rothschild 2017). I found strong comparability between several univariate estimates from the NWS and those from other surveys such as the National Health Interview Survey, Census Household Pulse, and American Family Survey, lending credibility to the generalizability of the NWS. However, the NWS respondents lean politically liberal, 3 which may bias the findings.
Third, sample sizes did not permit the inclusion of state fixed effects. Results may be influenced by unobserved state-level variation in COVID-19 mitigation policies, politics, and other factors that may influence COVID-19 experiences and impacts. However, explaining the observed metro status differences was beyond the scope of this study, and state-level policies may act as mediators between metro status and COVID-19 experiences and impacts. Future research should consider the role of state policies and other potential mediators on rural-urban continuum differences in various immediate and longer-term COVID-19 outcomes.
Finally, just as variation exists between counties, important variations exist within counties, with certain population pockets within each metro status category at greater risk of poor outcomes than others, including racial/ethnic minority and low SES groups. The results presented here should not be presumed to apply equally to all population subgroups within a particular metropolitan status category.
Notwithstanding these limitations, this study is the first to examine rural-urban continuum differences in secondary impacts from the COVID-19 pandemic using a national sample of working-age adults—a population that has been hit especially hard by the pandemic’s economic and mental health consequences (Gassman-Pines, Ananat, and Fitz-Henley 2020; Glei 2021; Horowitz, Brown, and Minkin 2021; Kesler and Bash 2021; Montenovo et al. 2020). My findings reinforce the fact that rural areas are not homogenous and that some experienced worse outcomes than others during the COVID-19 pandemic. Recovery policies must consider geographic variation in COVID-19 vulnerability and impacts.
As with the Great Recession (Forbes and Krueger 2019), the economic, social, and psychological sequalae of COVID-19 and its related policies may reverberate for years given its broad and sustained disruption to the U.S.’s economic, social, and health care infrastructures. COVID-19 and its postpandemic contexts may precipitate major economic, social, cultural, and institutional changes that will have implications for physical, psychological, and financial health well into the future. Although the COVID-19 unemployment rate was higher than in previous recessions (Congressional Research Service 2021), several federal and state mitigation policies, such as extended unemployment benefits and eviction moratoria, potentially buffered some individuals, families, and communities from short-term material and psychological distress.
However, many states have phased out these policies, which may leave some people less financially secure than at the height of the pandemic. As a result, material well-being may decline and psychological distress may increase in the coming months. Also, as eviction moratoria are phased out, more people could be left homeless as they are unable to make overdue rent payments. Those who contracted COVID-19 or delayed medical care may have new health conditions with which to contend. It is also possible that COVID-19 may have prompted an “existential shift” for some individuals, who made adaptations that are beneficial to psychological well-being (e.g., more fulfilling employment, more time with friends and family).
Many businesses closed, perhaps permanently. As a result, people may not return to their same jobs or even their same industries. Some may retire earlier than expected (Bond, Doonan, and Kenneally 2021). Businesses may adopt remote, hybrid, or other flexible work arrangements. Labor shortages have already prompted wage increases that benefit workers. To the extent that these changes vary geographically, we should also expect to see geographic differences in physical and mental health outcomes and financial well-being. Researchers should continue to explore geographic differences in these longer-term outcomes, including along the rural-urban continuum and between different types of rural communities.
Supplemental Material
ds-doc-1-ann-10.1177_00027162211069717 – Supplemental material for Rural-Urban Variation in COVID-19 Experiences and Impacts among U.S. Working-Age Adults
Supplemental material, ds-doc-1-ann-10.1177_00027162211069717 for Rural-Urban Variation in COVID-19 Experiences and Impacts among U.S. Working-Age Adults by Michal Grinstein-Weiss, Carol Graham, Edward F. Lawlor and Shannon M. Monnat in The ANNALS of the American Academy of Political and Social Science
Footnotes
NOTE:
The author acknowledges support from two research networks funded by the National Institute on Aging (R24AG065159 and 2R24AG045061); the NIA-funded Center for Aging and Policy Studies at Syracuse University (P30AG066583); the NICHD-funded Population Research Institute at Penn State (P2CHD041025); the USDA Agricultural Experiment Station Multistate Research Project: W4001, Social, Economic and Environmental Causes and Consequences of Demographic Change in Rural America; and the Syracuse University Lerner Center for Public Health Promotion.
Notes
Supplemental Material
Supplemental material for this article is available online.
Shannon M. Monnat is an associate professor of sociology, Lerner Chair for Public Health Promotion, Lerner Center director, and codirector of the Policy, Place, and Population Health Lab at Syracuse University. Her research looks at geographic differences in heath and mortality, with a specific focus on rural health and health disparities.
References
Supplementary Material
Please find the following supplemental material available below.
For Open Access articles published under a Creative Commons License, all supplemental material carries the same license as the article it is associated with.
For non-Open Access articles published, all supplemental material carries a non-exclusive license, and permission requests for re-use of supplemental material or any part of supplemental material shall be sent directly to the copyright owner as specified in the copyright notice associated with the article.