
Abstract
Evidence from the temporary expansion of the Child Tax Credit (CTC) in 2021 suggests it helped to reduce family poverty, lessen food hardship, and increase families’ financial expenditures on children across race and ethnicity. We review recent evidence on the impacts of the CTC on differences in well-being across race and ethnicity, including differences in access to the tax credit, how families used the tax credit, and the food insecurity and mental health circumstances of those families. We supplement our review of extant research with an analysis of racial income inequality using nationally representative data from the Current Population Survey: we find that the 2021 CTC expansion is associated with lowered Black–white and Hispanic–white income inequality in the bottom half of the income distribution, particularly at the 10th and 25th percentiles.
Since the 1960s-era Great Society expansion of redistributive cash, in-kind, and social insurance programs, a variety of interventions and approaches have been aimed at addressing economic inequality and poverty in the U.S. Beginning with a series of tax reforms that were enacted in the 1980s and 1990s, the tax system has emerged as one of the nation’s primary tools to deliver income support for families with low earnings and dependent children (Hardy, Smeeding, and Ziliak 2018). Specifically, the Earned Income Tax Credit (EITC) and the Child Tax Credit (CTC) have become central to how federal policy helps to ease family economic hardship in the U.S. These tax credits also fill gaps in family income that were created by (1) the 1996 welfare reforms that rolled back traditional cash assistance to families and (2) other policies that had the effect of reducing economic assistance to families by transferring authority over decision-making—including time limits on the receipt of assistance and cash benefit generosity—from the federal government to states (DeParle 2021; Gundersen and Ziliak 2004). Historic reductions in poverty (Creamer et al. 2022) and lowered levels of material hardship (e.g., Parolin et al. 2023) suggest that the 2021 CTC expansion has had meaningful impacts on economic well-being across several dimensions, though there is limited evidence on the broader racial inequality implications of the 2021 policy.
Over this period, the approaches taken by state and local governments have varied in important ways, ebbing and flowing between the provision of more versus less economic assistance, conditions governing the receipt of benefits, and gradations in the levels of discretion afforded to state and local policymakers in determining benefit levels. Amid evidence that state redistributive policy choices may be influenced by factors including race and geography, federal redistributive policies—including tax policies—may provide important antipoverty reduction amid varying state policies and priorities. For example, several studies have documented that Blacks tend to be sanctioned more harshly when receiving traditional welfare benefits (e.g., Fording, Soss, and Schram 2007; Schram et al. 2009), and states with higher proportions of Blacks on the welfare caseload are less likely to provide assistance in the form of cash payments (Hardy, Samudra, and Davis 2019; Parolin 2021). Black families are more likely to reside in states with both the highest rates of poverty and the lowest provision of welfare assistance; in several instances, such states provide economic assistance via welfare to fewer than one in 10 people who live at or below the federal poverty level. 1
The existence of racial inequality in the U.S. is well documented and includes historical and structural inequalities and discrimination in education, policymaking, labor, capital, and product markets (e.g., Darity and Mullen 2020; Huang and Taylor 2019; Gale 2021; Williams, Logan, and Hardy 2021). Recent evidence demonstrates that the EITC reduces Black–white income inequality (Hardy, Hokayem, and Ziliak 2022), but it remains an open question whether other refundable tax credits like the CTC, on their own, can meaningfully reshape racial income inequality. For this reason, the expansive shift in CTC policy between 1999–2020 and 2021 allows for a novel comparison of alternative approaches. The 2021 policy expansion could disproportionately provide for a more robust income-based safety net for many families across race and ethnicity, including Black and Hispanic families residing in states with relatively weaker income support programs. On the other hand, while the 2021 CTC provides a relatively larger net subsidy to earnings and incomes than the pre-2021 version of the policy, it does so by implementing a policy design that could yield “income effects” that raise the opportunity cost of work, though several studies suggest little to no discernable disemployment effects from the 2021 CTC (Bastian 2024; Pac and Berger 2024). 2 An additional dimension that can drive group-level inequality differences from a CTC expansion hinges on differential take-up across groups—though there is little evidence on take-up differences by race across refundable tax credit programs. 3 And, related to take-up, income support through the tax system may lead to altered barriers and administrative burdens for some families, especially if they already filed taxes; on balance, the tax system may represent a more predictable barrier that some families can better navigate (Herd et al. 2023). For other families, particularly those without valid Social Security numbers or with an aversion to filing, the tax system may operate as a barrier to accessing cash supports.
With this policy landscape as a backdrop, the 2021 expanded CTC can be understood as an intervention with the potential to reduce racial inequality in a variety of ways while minimizing exposure to at least some of the barriers families may face when attempting to access benefits. Given the evidence that the policy expanded access to groups previously excluded from the CTC—including Black families, those living in rural areas, and those headed by unmarried adults (e.g., Hardy, Collyer, and Wimer 2023)—the policy could also reduce racial income inequality. To assess the impact of the CTC on racial inequalities, we review recent evidence along a range of outcomes, including access to the credit, food insecurity, use of the credit, and mental health. In addition, we present a brief examination of the CTC on racial income inequality in 2021. For this, we draw data from the Current Population Survey between 2020 and 2023 to examine the relationship between the CTC and Black–white and Hispanic–white income inequality. Examining the years immediately surrounding the expansion allows us to focus on any inequality reduction occurring in 2021.
Following the approach taken in Hardy, Hokayem, and Ziliak (2022), we construct a broad measure of after-tax household income without and with the CTC to estimate the impact of the CTC on inequality using standard measures from the literature. We find evidence of inequality reduction associated with the expansion, with most of the reduction occurring in the bottom half of the income distribution. Looking at specific percentiles across the distribution, the expanded 2021 CTC closes Black–white and Hispanic–white income gaps primarily at the 10th and 25th percentiles. Prior to the 2021 expansion, the CTC actually worsened inequality at the 10th percentile.
Brief Background on the Child Tax Credit
Greenstein (this volume) provides a comprehensive discussion of the enactment and evolution of the CTC, from the Taxpayer Relief Act of 1997 until today. The credit shifted from initially providing middle-income families with children a modest tax-liability-offsetting, nonrefundable tax credit of $400 per child in 1998, to a more expansive credit under the American Rescue Plan Act of 2021. The temporary expansion, often referred to as the expanded CTC, applied only in 2021, increased the credit amount ($3,600 per child under age six and $3,000 per child between ages six and 17), made the credit fully refundable (eliminating the refundability threshold), and directed half the anticipated credit to be paid in advance monthly payments from July to December 2021 (Bee, Hokayem, and Lin 2023). 4 Currently, the CTC operates until 2025, under the parameters of the Tax Cuts and Jobs Act of 2017.
To illustrate the value of the credit, Figure 1 compares the total CTC (dotted line) to the popular EITC (solid line) over time for households with children dating back to the enactment of the CTC. 5 In our analysis, we add the nonrefundable and refundable portions to show the entire CTC value. As Figure 1 shows, the average CTC amount is typically more than the average EITC amount in recent years. The recent temporary expansion in 2021 pushed the average CTC amount to almost $5,000 before returning to preexpansion levels.
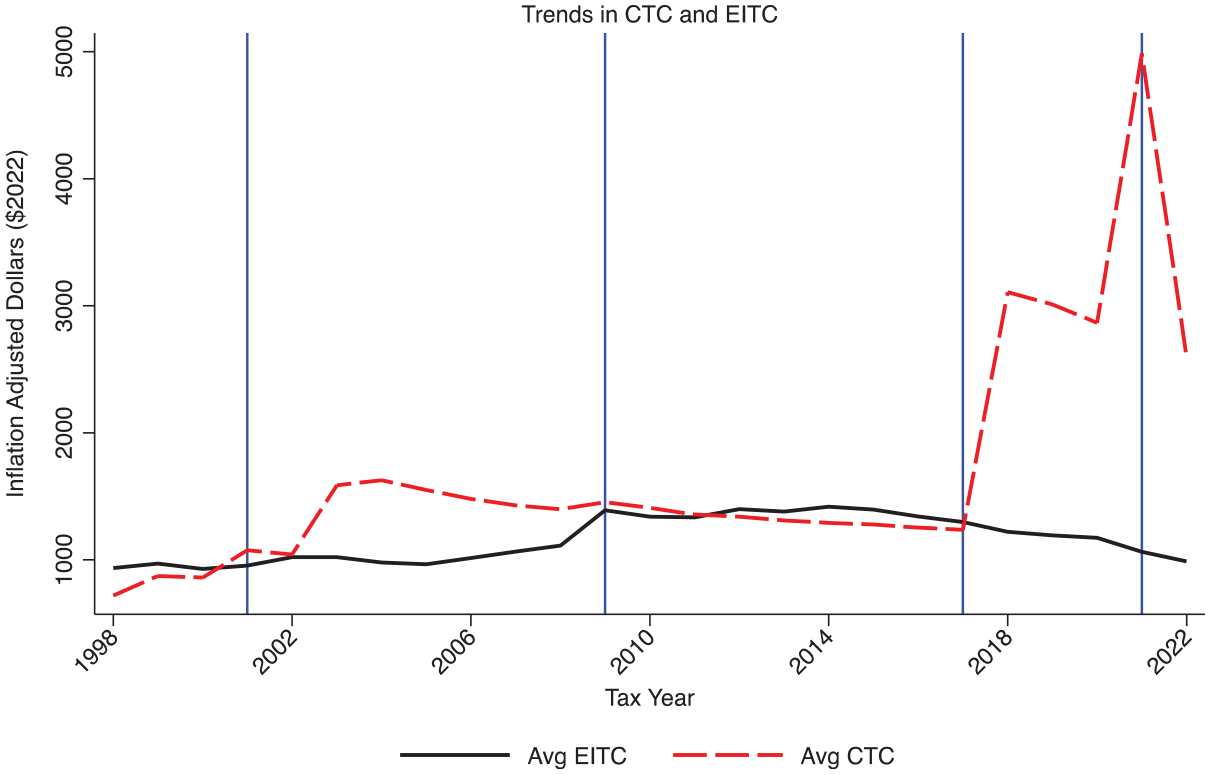
Trends in Child Tax Credit and the Earned Income Tax Credit
Inequality Impacts of Changes to the Child Tax Credit: Assessing Recent Evidence
In order to better characterize the impacts of the 2021 CTC, we describe how the older incarnation of the CTC included features that disproportionately exclude some families across race and geography. As summarized in Goldin and Michelmore (2022) and Greenstein (this volume), the refundable CTC—leaving aside the temporary 2021 expansion—is limited to families with earnings over $2,500. Refundability is also restricted in two additional ways. First, compared to the 2021 CTC, families are limited to a lower refundable credit ($1,400 in 2020). Second, the refundable portion of the credit is set equal to 15 percent of taxable income over $2,500 (again, not to exceed an annually established maximum threshold)—$1,400 in 2020.
These design elements are consequential for many economically disadvantaged groups. Prior to enactment of the 2021 CTC, the credit’s earnings requirement excluded roughly a third of impoverished children because they reside in families lacking sufficient earnings levels to qualify for the credit (Collyer, Harris, and Wimer 2019). Looking across race, Collyer, Harris, and Wimer (2019) demonstrate that more than 50 percent of Black and Hispanic children and 23 percent of white children are excluded from CTC receipt due to the same earnings requirement; again, these are largely families with low incomes and limited economic resources whose earnings are insufficient to qualify for the full credit. The same analysis finds that 40 percent of children in homes headed by unmarried women are excluded by the earnings requirement. Related studies on the distributional impacts of the CTC (e.g., Burman and Wheaton 2005; Cox et al. 2023; Goldin and Michelmore 2022) find similar gaps across race and family structure.
Some of the features of the pre-2021 CTC that have disproportionate impacts across race and ethnicity also reveal themselves in the form of gaps across geography. Given that the distribution of poverty and economic hardship is uneven throughout the U.S., both between and within regions and metropolitan areas, it might be expected that CTC reforms could have uneven impacts (Casey and Hardy 2018; Chetty, Hendren, and Katz 2016; Islam, Minier, and Ziliak 2015; Logan, Hardy, and Parman 2021). Due largely to the insufficiency of family earnings, the 2022 CTC, which reverts to the basic pre-2021 version of the credit, leaves out 35 percent of children in rural areas (Collyer et al. 2023).
A closely related series of state and regional analyses demonstrates that a collection of Southern and Southwestern states—with some of the nation’s highest poverty rates—are most likely to leave children out of eligibility for the full CTC (Collyer, Harris, and Wimer 2019) and that, accordingly, the 2021 CTC reforms yielded the largest poverty reductions in many of these same states (i.e., those with a higher proportion of unmarried mothers, states with larger rural populations, states with relatively larger families, and those with a higher share of Black families [Hardy, Collyer, and Wimer 2023]). Interestingly, Hardy, Collyer, and Wimer (2023) also find that cost of living operates as a consistent pressure working against poverty reduction; lower-cost states experience larger poverty reduction from the CTC in 2021.
There are some documented effects of the 2021 CTC on a range of well-being outcomes by race. Reviewing the effects of the expansion on food insecurity and financial hardship, Moellman, Vaughn, and Ziliak (this volume) find the expansion was successful in alleviating food hardship, with differences by race. Black and Hispanic-headed CTC-eligible households experienced a larger impact of the expansion on reporting balanced meals and affording food in the near future (Hamilton et al. 2022). Fisher, Schild, and Johnson (this volume) review consumption responses to the expansion, also noting differences by race in CTC use. Black and Hispanic households tend to use the CTC to pay down debt more often than white households do (Hamilton et al. 2022; Karpman et al. 2021; L’Esperance, Grooms, and Smeeding 2022; Roll et al. 2021; Schild et al. 2023). The evidence on how households spent CTC is mixed. Some studies suggest higher spending rates among Black (Karpman et al. 2021; L’Esperance, Grooms, and Smeeding 2022; Schild et al. 2023) and Hispanic (Roll et al. 2021; Schild et al. 2023) households, while other studies suggest white households are more likely to spend their CTC (Hamilton et al. 2022). Differences exist on what households spent their CTC on. Black and Hispanic households report buying clothing, food, and essential items and paying bills more often than do white households (Blount and Minoff 2022; Brugger et al. 2023; Hamilton et al. 2022; L’Esperance, Grooms, and Smeeding 2022; Schild et al. 2023). Black and Hispanic households are also more likely to spend their CTC on child-related expenses, such as school-related expenses, tutors, and children’s clothing (Brugger et al. 2023; Perez-Lopez and Mayol-García 2021; Schild et al. 2023). Black and Hispanic households report placing a portion of the credit toward a college fund more often than white households do (Brugger et al. 2023; Hamilton et al. 2022). From a mental health perspective, Black and Hispanic households reported that the monthly CTC payments lowered stress levels to a greater degree than did white households (Gennetian and Gassman-Pines, this volume).
The CTC and Racial Income Inequality around the 2021 Expansion
While the preceding sections have synthesized some of the existing evidence on racial inequality across several dimensions (e.g., poverty, food insecurity, CTC access, CTC use), we transition here toward a brief examination of the CTC and racial income inequality. 6 Table 1 presents a descriptive analysis of the impacts of the CTC on income inequality in the years surrounding the recent expansion, 2019–2022. It relies on data from the Current Population Survey Annual Social and Economic Supplement (CPS ASEC), the workhorse data set for research on wage and income inequality, and the National Bureau of Economic Research (NBER) TAXSIM model for simulating CTC values. 7 To gauge the impact of the CTC on inequality the table presents Black–white and Hispanic–white percentile ratios using household income with and without the value of the CTC. 8 It shows these measures across the distribution at the 10th, 25th, 50th, 75th, and 90th percentiles. 9 For example, at the 10th percentile (P10) we calculate the Black–white percentile ratio without the value of the credit as

(column labeled “Percentile Ratio without CTC”);
and the Black–white percentile ratio with the value of the credit as

(column labeled “Percentile Ratio with CTC”).
Child Tax Credit and Racial Income Inequality around the 2021 Expansion

SOURCE: Data from U.S. Census Bureau, Current Population Survey, 2020–2023 Annual Social and Economic Supplement.
NOTE: Black–white and Hispanic–white percentile ratios of after-tax household income, with and without Child Tax Credit, around the expansion year of 2021 for households with children. The Child Tax Credit is simulated using demographic and income information in the CPS ASEC with the NBER TAXSIM tax model. The credit amount includes the refundable and nonrefundable portions. A higher value of the percentile ratio represents a reduction in inequality. More details about data construction and measures can be found in the online appendix.
We calculate similar Hispanic–white ratios. The comparison of these two ratios allows us to gauge the effect of the CTC at the 10th percentile (column labeled “Percentage Difference”). We calculate similar ratios at the other income percentiles. A ratio with CTC that is larger than the ratio without CTC suggests an inequality reduction associated with the CTC at that percentile. A ratio with CTC that is less than the ratio without CTC suggests a worsening of inequality associated with the CTC at that percentile. We estimate the value of the CTC for our analysis that combines both refundable and nonrefundable components of the CTC.
The table illustrates differences in where and how the CTC affects racial income inequality. Beginning at the very bottom of the distribution (10th percentile), the CTC is mainly associated with a worsening of inequality in the years prior to the expansion for both Black–white (about 6 percent, left panel) and Hispanic–white (0.5 and 2.2 percent, right panel) inequality. At the other points of the distribution (25th–90th percentiles), there is very little discernible inequality reduction prior to the expansion. However, there is a noticeable descriptive effect associated with the expansion in 2021 across the distribution. The largest inequality reduction for Black–white and Hispanic–white inequality in 2021 occurs at the 10th percentile (10.7 percent and 5.3 percent, respectively), followed by the 25th percentile (5.8 percent and 4.7 percent, respectively) and the median (3.9 percent and 2.7 percent, respectively). More modest reductions occur at the higher percentiles. These gains in inequality reduction disappear as the expansion expired in 2022.
There are a few caveats to keep in mind when interpreting these results. First, there is an assumption of full take-up of the credit, meaning all households eligible for the credit receive it. 10 Recent evidence suggests full CTC take-up may not have taken place. Michelmore and Pilkauskas (2023) find that only about two-thirds of eligible families with low incomes received monthly CTC payments. While we are unaware of evidence on differential CTC take-up by race, we can point to evidence for other credits. Jones (2014) finds evidence of relatively modest racial gaps in take-up of the EITC, with slightly higher take-up among Blacks relative to whites. If a similar pattern holds true for the CTC, the results represent a “best-case” scenario. Second, there is no adjustment for Individual Taxpayer Identification Number (ITIN) holders, which impacts our results, particularly for Hispanic–white inequality. 11 Children qualifying for the CTC must have a Social Security number (Burnside 2022), so the analysis assumes all children meet this requirement. As a result, we likely overstate Hispanic–white inequality reduction.
Conclusion
In addition to contributing to substantial poverty reduction across racial and ethnic groups, the 2021 expanded CTC also contributed to substantial reductions in racial income inequality. The policy’s aim was to provide periodic economic assistance to families through a child allowance delivered in the form of a tax credit. This design has a range of benefits and costs as it relates to ameliorating racial economic inequality.
First, the policy can operate as a floor relative to some state safety-net systems that may—on their own—be inadequate to the task of providing assistance for children and families. Evidence shows that states, throughout the post-1996 welfare reform era coinciding with the enactment of the credit, tend to provide less cash assistance as the number of Black families on the state welfare caseload rises (Hardy, Samudra, and Davis 2019; Parolin 2021). This tends to occur in states with already higher levels of poverty, and such states are disproportionately located in the Southeast (Bitler and Hoynes 2016). These state-level patterns are revealed across a broad range of programs, including unemployment benefits (Cawthorne Gaines, Hardy, and Schweitzer 2021). Consistent with our results, Hardy, Collyer, and Wimer (2023) find that the expanded 2021 CTC tended to benefit states with a higher proportion of families more likely to be ineligible under the pre-2021 guidelines; states with higher proportions of Black families, rural families, and those headed by an unmarried adult all experienced higher reductions in poverty. With this context, the families excluded from the CTC due to insufficiently low incomes are left to draw upon a limited set of state-level policy options for cash and employment assistance, given the reduction in traditional state-administered welfare benefits that has occurred since the 1990s, as demonstrated by lowered levels of spending on cash assistance or work training throughout the 2000s (Hardy 2022).
As a point of policy design for refundable tax credits like the CTC, the delivery of economic assistance via the tax system provides some predictability, in that the benefits are delivered based upon prior year’s taxable income. Tax filing imposes time costs and introduces complexity for families, and linking eligibility to the previous year’s taxable income introduces a degree of uncertainty for families with already lower and more volatile incomes; yet these barriers—in the context of the tax system—are ostensibly uniform nationwide, and this standardization could minimize exposure to caseworker discretion and state-county specific forms of administrative burdens that can operate as barriers to welfare benefits, particularly for Black and Hispanic clients (e.g. Barnes and Gennetian 2021; Herd and Moynihan, this volume; Moynihan, Herd, and Harvey 2015). Fording, Soss, and Schram (2007, 2011), among others, have documented that welfare caseworkers have tended to sanction Black and other minority families more harshly for violations of rules.
While the barriers to filing may impose costs on some households that reduce the likelihood of taking up the benefit, it may also hold that innovations in software applications, as well as access to nonprofit tax assistance providers, can bridge the gap for families seeking to benefit from these programs. And, given the knowledge among workers regarding the refundable EITC (Chetty, Friedman, and Saez 2013), many families with low and moderate income may already have a keen awareness of the financial benefits associated with filing. For households without valid Social Security numbers, innovations aimed at expanding the delivery of tax credits could include the use of ITINs (Kapahi 2020); this may prove especially beneficial for delivering tax credits to undocumented residents, including many Hispanic families with dependent children. As noted above, our analysis assumes 100 percent take-up of the CTC.
There is a long record of federal policies interceding to assist groups facing social and economic hardship at the state and local level. Relatedly, many of the root causes of regional inequality can be traced to social and political processes designed to exclude minority groups from political and economic institutions (Williams, Logan, and Hardy 2021). Ultimately, the 2021 CTC provides broad-based income support across racial and ethnic groups. While the expansion yielded poverty-reduction benefits across race and ethnicity, economically disadvantaged families—including, but not limited to, many Black and Hispanic families—benefited from the policy’s implementation.
The impact of redistributive tax policies on Black–white and Hispanic–white inequality is relatively understudied. Unlike with other tax policies, such as the EITC, families with lower and higher incomes can receive the 2021 CTC, suggesting it may have a unique role in closing income gaps between these groups. Using four years of data from the CPS ASEC, we document the effect of the 2021 CTC. We find the 2021 CTC to be associated with lower Black–white and Hispanic–white income inequality in the bottom half of the income distribution. We find differences in this effect at varying percentiles of income. For families at the 10th and 25th percentiles of income, there is improvement in Black–white and Hispanic–white income gaps from the 2021 expansion; however, prior to the 2021 reforms, we observe worsened between-group inequality at the 10th percentile.
This is consistent with evidence on the EITC’s racial income inequality reduction impacts, where Hardy, Hokayem, and Ziliak (2022) document relatively robust inequality reduction at the 25th percentile; tax credits without full refundability may at once yield overall group-level inequality reduction and slightly exacerbate between-group inequality at the very bottom of the distribution. Future work should examine differences in take-up by race and whether these potential differences can help to better understand how the credit reduces inequality across race and ethnicity. Future work should also examine the role of 2021-specific policy features, namely refundability and credit generosity, in explaining the credit’s capacity to reduce inequality. The temporary CTC expansion of 2021 lowered poverty and between-group inequality, and the reversion of the policy after 2021 provides a unique opportunity to examine these aspects of the credit, as it temporarily increased the credit size while providing full refundability for tax filers without earnings, before returning to a lower level and partial refundability in 2022.
Supplemental Material
sj-docx-1-ann-10.1177_00027162241265791 – Supplemental material for The Effects of the 2021 Child Tax Credit on Racial and Ethnic Inequalities in Well-Being
Supplemental material, sj-docx-1-ann-10.1177_00027162241265791 for The Effects of the 2021 Child Tax Credit on Racial and Ethnic Inequalities in Well-Being by Bradley Hardy and Charles Hokayem in The ANNALS of the American Academy of Political and Social Science
Footnotes
NOTE:
Any opinions and conclusions expressed herein are those of the authors and do not represent the views of the U.S. Census Bureau. The Census Bureau has ensured appropriate access and use of confidential data and has reviewed these results for disclosure avoidance protection (Project No. 0000006001: CBDRB-FY19-462, CBDRB-FY20-365, CBDRB-FY21-280, CBDRB- FY22-337). We thank Megan Curran, Hilary Hoynes, and Zach Parolin for helpful comments on prior drafts.
Notes
Supplemental Material
Supplemental material for this article is available online.
Bradley Hardy is a professor in the McCourt School of Public Policy at Georgetown University. His recent publications include “Income Inequality, Race, and the EITC” (National Tax Journal) and “Money Matters: Consumption Variability across the Income Distribution” (Fiscal Studies). His research focuses on labor economics, economic insecurity, and social welfare policy.
Charles Hokayem is a principal economist in the Center for Economic Studies at the U.S. Census Bureau, where he leads projects on the use of federal tax programs. His research focuses on the low-income population and the role of survey nonresponse on measuring income, poverty, and inequality.
References
Supplementary Material
Please find the following supplemental material available below.
For Open Access articles published under a Creative Commons License, all supplemental material carries the same license as the article it is associated with.
For non-Open Access articles published, all supplemental material carries a non-exclusive license, and permission requests for re-use of supplemental material or any part of supplemental material shall be sent directly to the copyright owner as specified in the copyright notice associated with the article.