
Abstract
Over the past few years, college campuses across the United States have conducted climate surveys primarily aimed at gleaning quantitative data on the extent and distribution of sexual assault, intimate partner violence, and stalking. Conspicuously absent from these surveys are measures of two other serious problems that plague many students in this current era: hate crimes and bias incidents. Using data from the 2016 Campus Quality of Life Survey, the main objective of this article is to help fill a major research gap by presenting data on the prevalence and key demographic correlates of these two behaviors. One of the main findings is that close to 60% of the sample reported being victimized because of their real or perceived race/ethnicity, national origin, religion, sex, sexual orientation, physical or mental disability, or political orientation.
In his contribution to The Routledge International Handbook on Hate Crime, Chakraborti (2015) reminds us that “there remains much about hate crime which we do not know, and this has implications for the ‘real-life’ value of our theorizing and policy-making” (p. 13). Buttressing his point is the fact that nowhere to be found in the Handbook’s index are the words college and campus. This is due, in large part, to the fact that campus surveys of hate crimes and bias incidents experienced by postsecondary school students are in relatively short supply compared with the amount of campus climate surveys aimed at eliciting data on sexual assault, intimate partner violence, and stalking. The few that have been done over the past 30 years, however, are small scale but show that college students’ risk of experiencing some form of hate and bias crime during the past year ranges from 25% to 40% (Ehrlich, 1990, 1999; Perry, 2011).
In this current era, do hate crimes and bias incidents still constitute “the background noise” of American college students lives (Southern Poverty Law Center, 2010)? Using data derived from the 2016 Campus Quality of Life Survey (CQLS) conducted at a large college in a South Atlantic part of the United States, the main objective of this article is to answer this question and to identify the key risk factors associated with hate crimes and bias incidents at this school. Risk factors are attributes of a victim or a perpetrator that are associated with an increased probability of experiencing hate crimes or bias incidents. 1 They may be causes, co-occurrences, or consequences of these harms (M. D. Smith, 1990).
We hypothesize that, given the broader political, economic, and cultural context in which the CQLS was administered, our prevalence rates would be high. For example, the 2016 United States Presidential election featured some strong anti-Muslim and anti-immigrant rhetoric, and many people incorrectly equate Islam and asylum seekers with terrorism (Bhatia, 2015; Perry, 2015). Furthermore, there was a major backlash against transgender people using bathrooms based on their gender identities. As well, there continues to be a strong anti-feminist backlash in the United States (DeKeseredy, Fabricius, & Hall-Sanchez, 2015; Dragiewicz & Mann, 2016).
The campus in which the CQLS was administered is certainly not immune to the above problems. Consider that 30% of the students our sample described in a subsequent section of this article reported that people on their campus were unfriendly to Muslims and to transgender people, and nearly 25% stated that people were unfriendly to feminists. Indeed, as is the case at other campuses, human and programmatic diversity is not “universally welcomed” (Perry, 2011).
Definition of Hate and Bias Crimes
Defining hate and bias crimes is subject to much scholarly debate (Chakraborti & Garland, 2015). However, this study was guided by Turpin-Petrosino’s (2015) conceptualization of hate crime. Here, it refers to those offenses that are committed due to the perpetrator’s prejudiced or hostile attitudes toward a particular social group represented by the victim. Most commonly, the offender’s hostility is triggered by his or her perception of the victim’s ethnicity, race, national origin, religion, sexual orientation, disability, or gender. But to hold prejudiced attitudes alone is not enough. A hate crime is composed of at least two components, (1) the predicate or base criminal offense, such as harassment or intimidation, aggravated assault, malicious damage, arson, or even murder, and (2) evidence that the perpetrator’s actions are motivated by prejudice or animus against the group represented by the victim. (p. 2)
A bias incident, “conduct, speech, or expression that is motivated by bias or prejudice, but doesn’t involve a criminal act. Bias incidents, may, however, violate campus codes or policies” (Southern Poverty Law Center, 2010, p. 12). Though not crimes in the strict legal sense of the word, bias incidents can still have the same hurtful and divisive consequences as hate crimes.
Method
Sample and Data Collection
The CQLS is a web survey of 30,470 students attending the aforementioned college in spring 2016. This school is, as uncovered by another study conducted on the same research site (see Weiss, 2013), a major “party school.” In fact, it was yet again ranked by the Princeton Review as among the top five such colleges in the country in the fall of 2016. This is not surprising because Weiss (2013) found that the amount of alcohol students drink in their residences or local bars goes well beyond the common amount consumed by binge drinkers. She also uncovered that nearly half of the traditional students enrolled at this school during the time she collected her data experienced some type of crime during their college career. Note, too, that previous analyses of CQLS data show that 75% of the entire sample (male, female, transgender, etc.) agreed with this statement included in a survey question: “The institution tolerates a culture of sexual misconduct” (DeKeseredy, Hall-Sanchez, & Nolan, 2018).
A total of 5,718 students completed the questionnaire that also included measures of victimization experiences not reported here, such as acquaintance sexual assault, stalking, sexual harassment, and intimate partner violence. The sample size is close to 20% of the entire student population, and the response rate is similar to that of the larger Association of American Universities Campus Climate Survey on Sexual Assault and Sexual Misconduct (Cantor et al., 2015). As noted in Table 1, the CQLS sample is, for the most part, representative of the entire campus population. Even so, there are sex discrepancies in Table 1. Survey response and nonresponse studies show that trends in who answers surveys do, in fact, exist, with women typically being more likely to participate than men (DeKeseredy et al., 2018; W. G. Smith, 2008). Furthermore, the relevance of the survey also influences response rates (Groves, Singer, & Corning, 2000). Therefore, since women are among the highest risk groups to experience many of the harms addressed in this study, especially acquaintance sexual assault, it is not surprising that the CQLS elicited a higher percentage of females than that of the school’s general population, as well as a lower percentage of men than that of the broader male student community.
Demographic Characteristics of the Main Campus Population and the Campus Quality of Life Survey Sample.
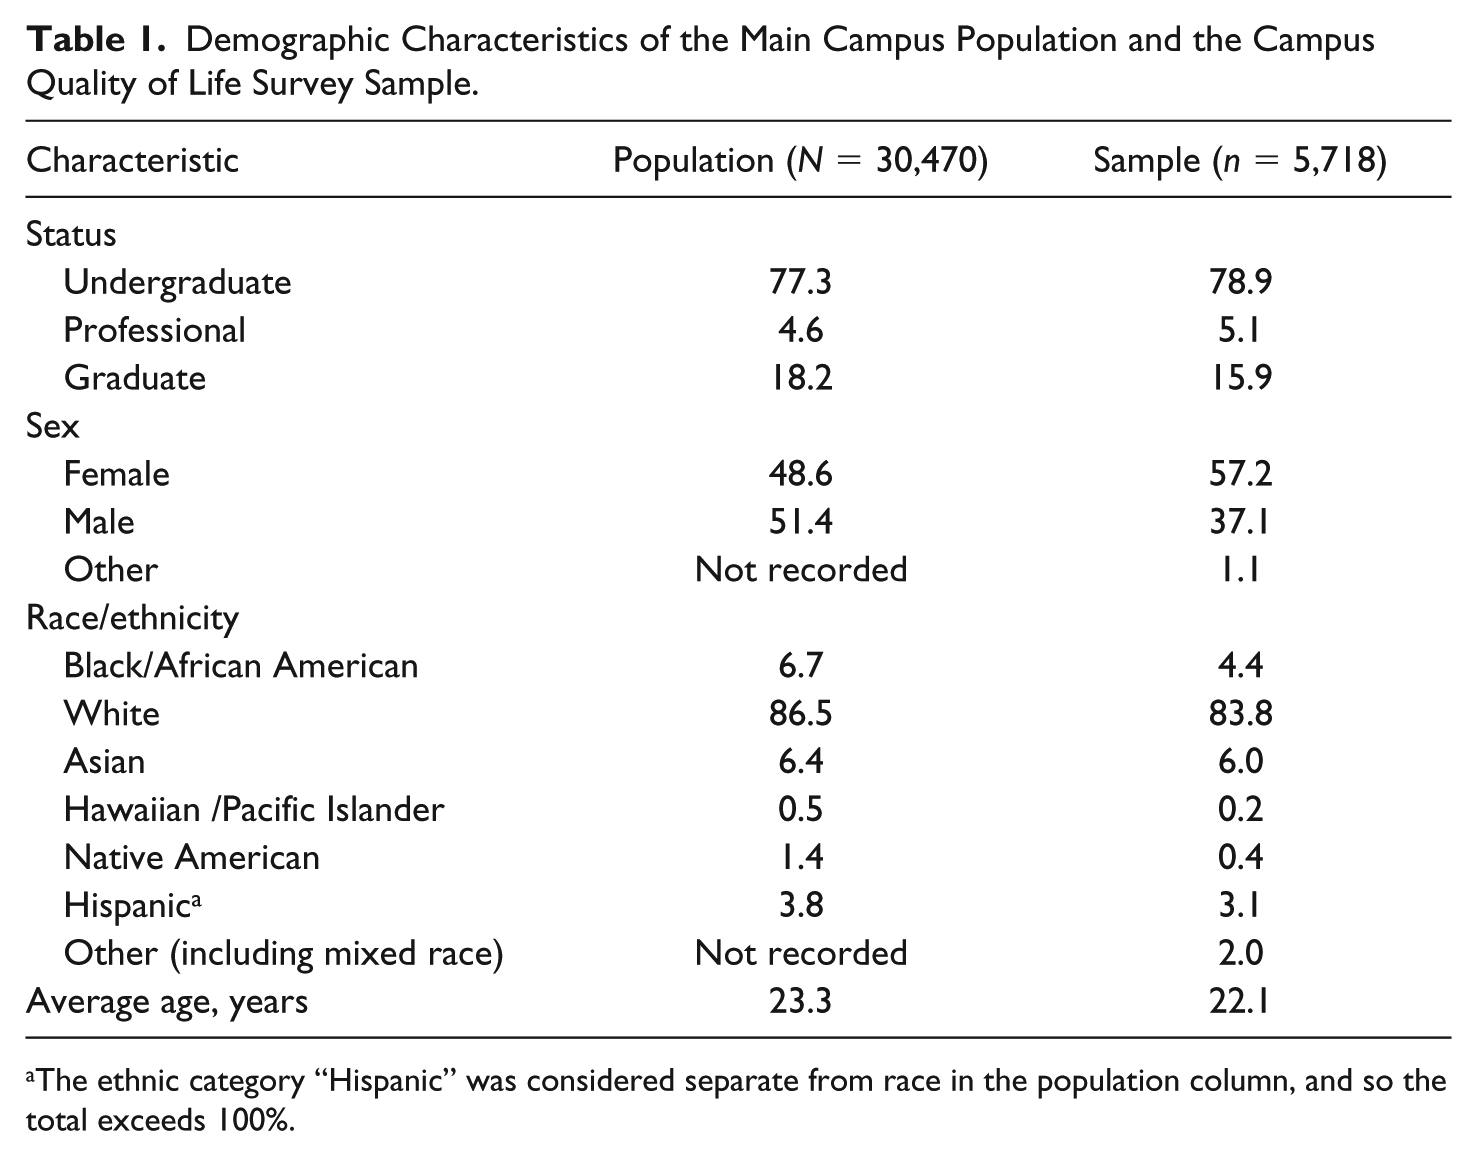
The ethnic category “Hispanic” was considered separate from race in the population column, and so the total exceeds 100%.
The sample was recruited using a campus-wide publicity strategy that involved
Electronic advertisements on the school’s various news sites
Posters about the study were placed throughout the campus
Many faculty members encouraged students to participate in the study
Affiliates of various campus resource centers (e.g., the Title IX office) publicly encouraged students to complete the survey
Interns affiliated with one of the school’s social scientific research center announced the survey in all of their classes
The school’s president sent out a campus-wide electronic message to all students requesting them to participate in the survey
Incentives, too, were used to recruit participants. Every type of publicity involved telling students about the opportunity to be randomly selected to receive one of 20 $50.00 VISA gift cards. This was also stated in the survey itself. The literature on Internet surveys shows that lotteries are widely used in web surveys and are often more effective than other types of incentives (Couper & Bosnjak, 2010).
Email invitations to complete the survey were sent to 30,470 students, with the first of four weekly invitations sent out on March 28, 2016. Each invitation included a link to the survey, which was administered using Qualtrics software. After clicking the link to the survey in the email invitation and then clicking a button to participate, respondents were taken to a screen containing a consent form. Students who indicated that they did not want to participate were removed from the email reminder list.
Participants were asked to confirm that they were at least 18 years old and a current student. They were additionally told that any information they provide will be kept completely anonymous. It was made explicit that student confidentiality is a priority and that any information they share cannot be identified. Moreover, they were informed that the research team cannot access their IP address or link the survey to their names, student IDs, or email addresses. Furthermore, under the research protocol, students were told that participation in this study is strictly voluntary and that they can skip any question and stop at any time.
All participants were provided with information on free professional support from counseling services. Actually, every page of the survey that contained sensitive questions had a link to on-campus resources, including one at the close of the instrument. Located below the list of resources at the end of the survey was the option for students to enter their email addresses in a draw for a $50.00 VISA gift card. To further preserve students’ confidentiality, spreadsheets containing participants’ responses are securely stored by Qualtrics and are only accessed by the research team.
After the first email invitation, three reminders were sent out (one a week) for a total of 4 weeks of data collection. Couper and Bosnjak (2010) assert that “much of the nonresponse occurs at the early stages before we have a chance to convince them of the importance of the study” (p. 539). The opposite occurred with the CQLS. In fact, close to 2,500 students completed the survey within 5 days of the first email invitation. Again, supplementing the reminders were those provided by colleagues affiliated with other faculty departments and offices at the school.
Measures
Hate Crimes and Bias Incidents Victimization
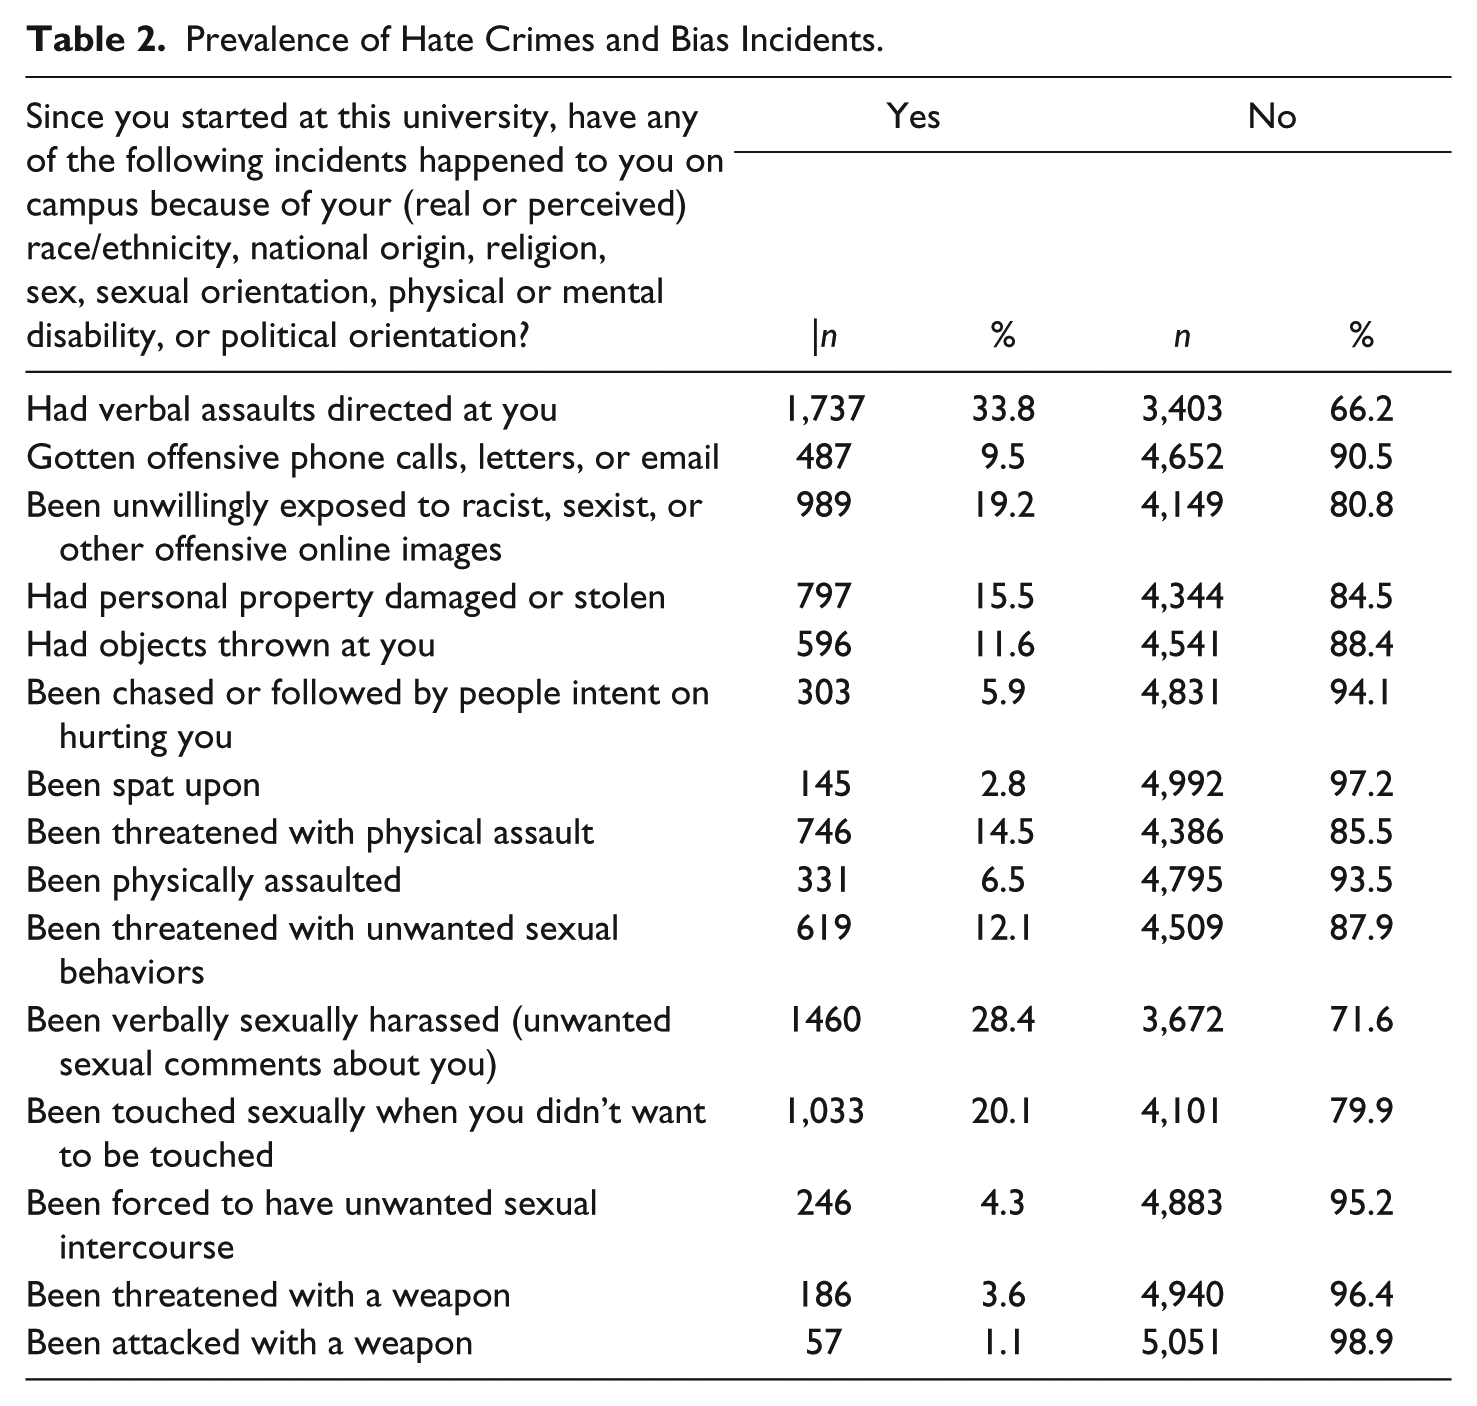
The 15 items in Table 2 are derived from a survey instrument developed by the Prejudice Institute (1995) and DeKeseredy and Perry’s (2006) Campus Life Questionnaire (Cronbach’s α = .813). They were introduced with the preamble below, and the response categories are “yes” and “no”: Since you started at XXX, have any of the following incidents happened to you on campus because of your (real or perceived) race/ethnicity, national origin, religion, sex, sexual orientation, physical or mental disability, or political orientation? Please answer each item.
Prevalence of Hate Crimes and Bias Incidents.
Witnessed or Heard About Offensive Conduct Related to Prejudice
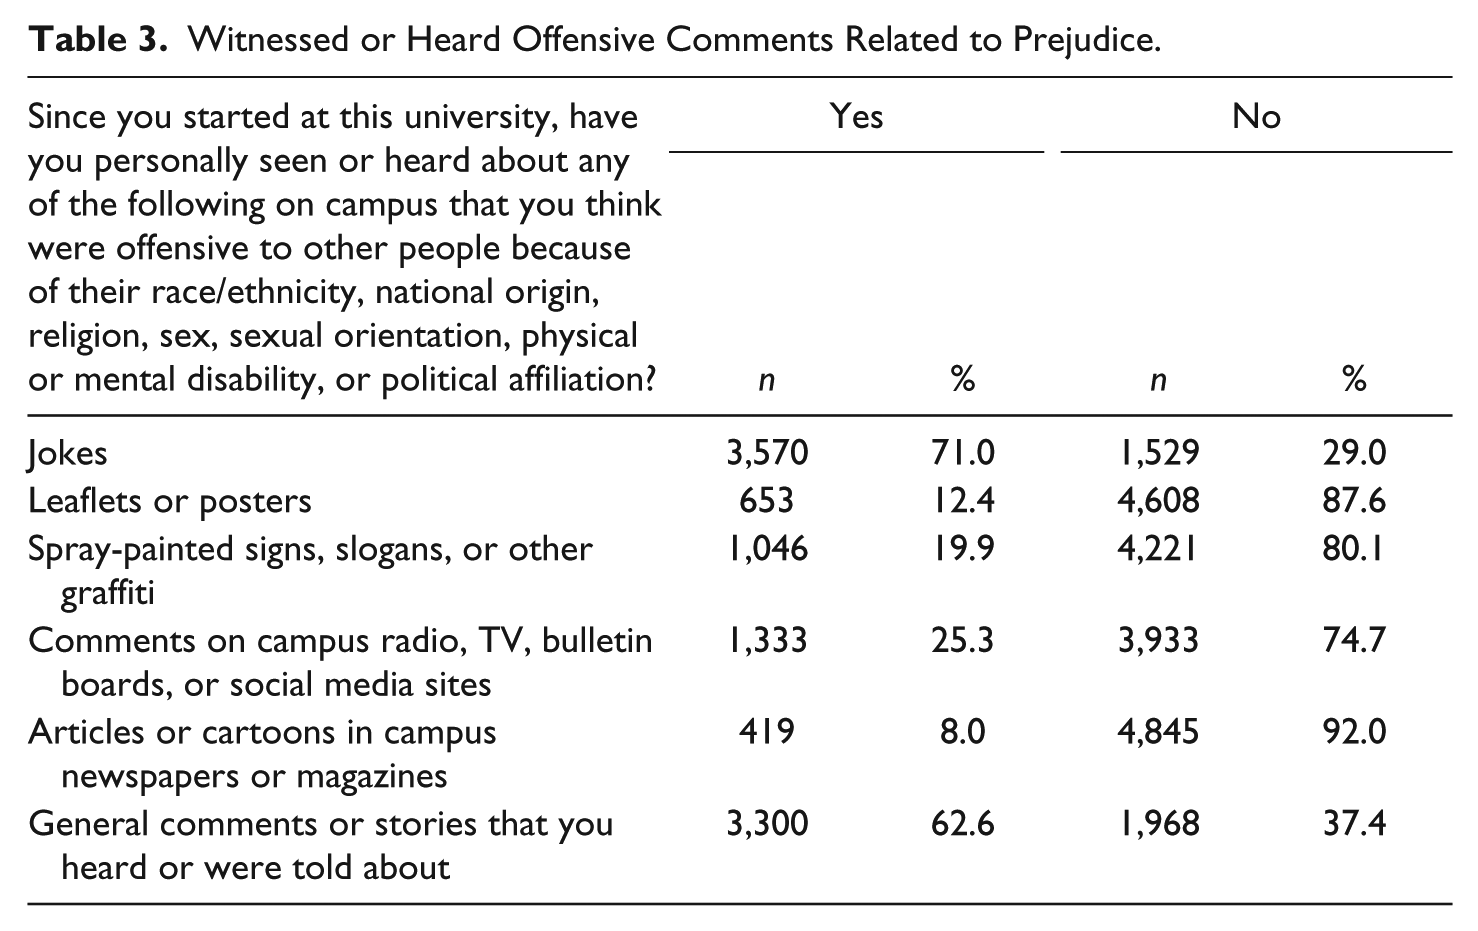
The six items included in Table 3 (Cronbach’s α = .71) are derived from DeKeseredy and Perry’s (2006) Campus Life Questionnaire and were introduced as follows, and the response categories are “yes” and “no”: During the school year, have you personally seen or heard about any of the following on campus that you think were offensive to other people because of their race/ethnicity, national origin, religion, sex, sexual orientation, physical or mental disability, or political orientation?
Witnessed or Heard Offensive Comments Related to Prejudice.
Racism and Discrimination
The following two questions were used to measure perceptions of racism and discrimination on campus, and the response categories are “yes” and “no”:
Do you believe that racism on campus is a problem?
Do you believe that women on this campus experience discrimination?
Demographic Characteristics
These demographic characteristics were collected for everyone in the sample: age, sex, LGBTQ (lesbian, gay, bisexual, transgender, queer) community member, race/ethnicity, international student status, member of or participated in political or social action group, and living on- or off campus.
Results
The first indicator of hate crimes and bias incidents being serious problems at the school examined in this study is that 76% of the respondents saw or heard at least one of the six items in Table 3 that they thought were offensive to other people because of their race ethnicity, national origin, religion, sex, sexual orientation, physical or mental disability, or political orientation. The most common experiences were hearing jokes (71%, n = 3,750), followed by general comments or stories that they heard or were told about (63%, n = 3,300) and then comments on campus radio, TV, bulletin boards, or social media sites (25.3%, n = 1,333). More visible offensive things, such as spray-painted signs, slogans, or other graffiti, were less common, but the percentage of such images is still high enough to warrant concern.
Note, too, that 38.2% of the sample stated that racism on the campus is a problem, and almost 40.3% stated that they believed that women on campus experience discrimination. Another analysis of CQLS data show that 34% (n = 995) of the women in the sample experienced one or more of five types of sexual assault since coming to the school is yet another indicator of a troubling campus climate (DeKeseredy et al., 2018). What is more, close to 60% (56.8%, n = 2,901) of the sample reported being victimized by one or more the 15 behaviors listed in Table 2. This figure is higher than that (40%) gleaned by Perry’s (2011) Canadian study of two small institutions of higher learning that used similar items. However, her research sites are more multicultural than ours and thus may be less tolerant of racism. Another factor that may account for our higher overall figure is that Perry asked students to report what happened to them in the past 12 months while our time frame was since students enrolled at the school. Thus, a longer time period results in more opportunities to be victimized.
The most common assaults listed in Table 2 are
been verbally assaulted (33.8%),
been verbally sexually harassed (28.4%),
been sexually touched when you didn’t want to be touched (20.1%), and
been unwillingly exposed to racist, sexist, or other offensive online images (19.2%).
Equally serious are these statistics presented in Table 2: 14.5% of the sample was threatened with physical assault; 12.1% were threatened with unwanted sexual behaviors; 11.6% had objects thrown at them; 6.5% were physically assaulted; and 4.3% were survivors of forced unwanted sexual intercourse. Like Perry’s (2011) findings and those of earlier campus surveys (e.g., Ehrlich, 1999), incidents of extreme assaults were reported by small numbers of respondents. Still, that more than one in three reported verbal assaults and that nearly one in three reported being verbally sexually harassed should be treated as major warning signs because, as pointed out by the U.S. Department of Justice, “A campus culture in which the use of slurs becomes commonplace and accepted soon becomes an environment in which slurs can escalate to harassment, harassment can escalated to threats, and threats can escalate to physical violence” (cited in the Southern Poverty Law Center, 2010, p. 4). Moreover, the ubiquitous nature of behaviors that that did not involve physical violence is often experienced by the victims of such acts as “violent forms of oppression” (Perry, 2011, p. 330).
Which students are most likely to be victimized by one or more of the behaviors listed in Table 2? The binomial logistic regression presented in Table 4 shows that these groups are at the highest risk: members of, or those who participated in, political and social action groups; members of the campus LGBTQ community; Hispanics; and those who live off campus. Turning to the first group, there is a literature demonstrating that members of certain political or social organizations, such as the Anti-Defamation League, are frequently targeted by hate crimes and bias incidents (Levin & Nolan, 2017). Yet, the CQLS does not indicate the names of or types of organizations respondents belonged to.
Demographic Predictors of Hate Crimes and Bias Incidents.
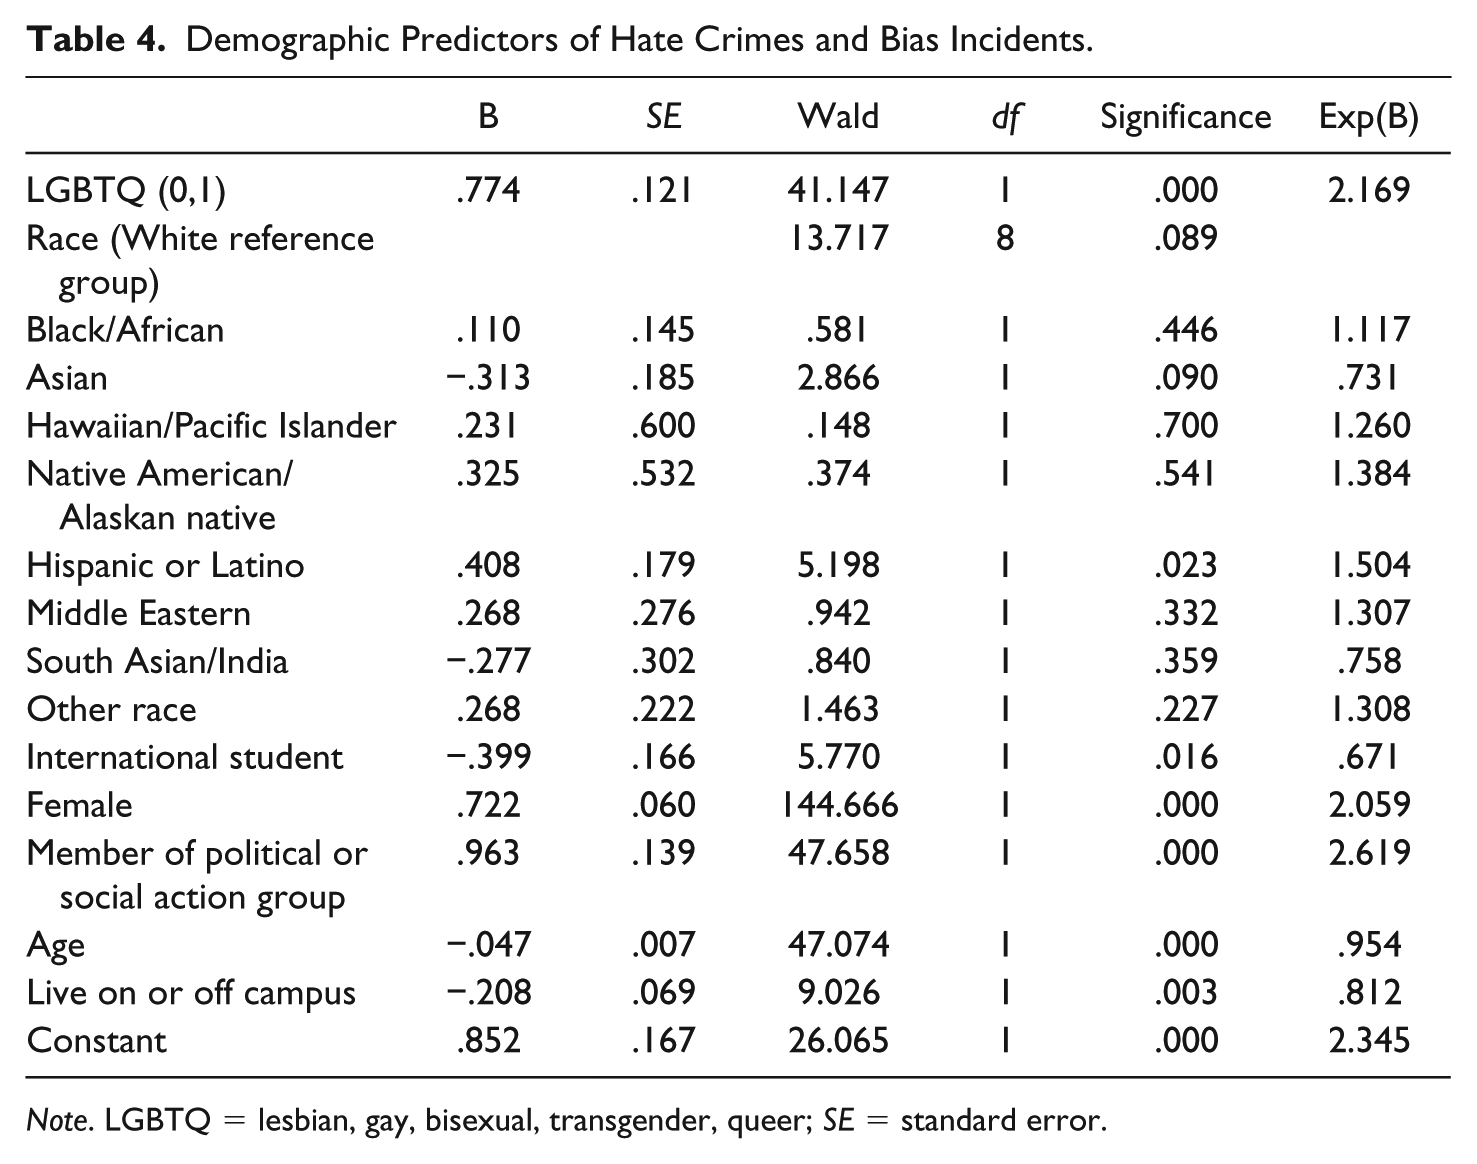
Note. LGBTQ = lesbian, gay, bisexual, transgender, queer; SE = standard error.
That LGBTQ respondents are 2.2 times more likely to be victimized is not surprising because they are also at great risk of being harmed in noncollege contexts (Levin & Nolan, 2017). Possibly, heated political debates about transgender bathrooms during the presidential election could have also partially fueled the victimization of LGBTQ students. The 2016 presidential election featured much hostility directed at Mexicans, and this might have played a role in Hispanic respondents being highly vulnerable in this study (Levin, 2016). Finally, off campus students’ risk may be explained by what routine activities theorists (e.g., Cohen & Felson, 1979) refer to as an “absence of capable guardians.” In other words, they do not have campus security staff and other agents of social control (e.g., dormitory staff) readily available.
Discussion
Our results challenge the notion of campuses being simply ivory towers immune from dangers that plague the “real world.” Additionally, as stated earlier, some of the people we found to be at high risk of being victimized on the college campus by hate crimes and bias incidents are also at high risk of being targeted elsewhere in the United States (Perry, 2011), especially members of the campus LGBTQ community (Gerstenfeld, 2011). Thus, they are likely to live in a constant state of fear and must navigate violence on a daily basis. However, our findings should be read with caution for several reasons. For example, it is impossible to identify the race/ethnicity, sex, or gender identities of the perpetrators using the CQLS. Furthermore, the precise reasons why respondents were victimized are not known. For example, while they were attacked because of their real or perceived identities, many people have multiple identities but are assaulted for one that may be more apparent than the others to perpetrators. For instance, an offender may assault an African American lesbian because of his racist attitudes and beliefs without knowing her sexual orientation (DeKeseredy, Hall-Sanchez, & Nolan, 2017).
Despite this shortcoming, the data compel us to think more broadly about campus safety and not restrict our focus only to sexual assault, intimate partner violence, and stalking. This is not to say that these problems do not warrant major policy attention. Certainly, they do, but our data reveal that racism, hate, and bias also tear at the fabric of a healthy and safe campus environment. Moreover, while the figures presented in Table 2 are high, they probably underestimate the true extent of hate crimes and bias incidents on our research site because of limitations that are endemic to all types of victimization surveys, such as memory error, embarrassment, fear of reprisal, forward and backward “telescoping,” and reluctance to recall traumatic events (DeKeseredy & Schwartz, 1998; M. D. Smith, 1987, 1994). Still, our data offer a more realistic account of hate and bias on campus than do official statistics produced by the Uniform Crime Reporting System and the Clery Act.
Though, as is often said, more research is necessary, more awareness and education about hate and bias on campus is sorely needed. Additionally, existing campus bystander intervention training programs aimed at curbing sexual assault and other crimes against women should include a module about responding to all forms of bigotry. Furthermore, as recommended by Levin and Nolan (2017), where separatism predominates on campus, it might be wise to create opportunities for leaders of segregated groups to come together, transcend their differences, and work in temporary alliances around common goals. Student groups on campus—the gay and lesbian alliance, Latino center, international student association, Black student union, Asian student alliance, and so on—are usually essential for providing minority students with what they require to stay in school but cannot seem to get support from the wider campus community. At the same time, however, there should also be curricular and extracurricular opportunities for diverse students to put aside their differences temporarily and come together to cooperate in harmony and peace. At many colleges and universities, students from diverse backgrounds have organized rallies against violence, food and music festivals, and speaker series that defend or celebrate all of their group memberships.
We could easily suggest some more progressive policy proposals, but it is beyond the scope of this article to do so. Yet it is essential to remember that one single initiative alone will not suffice. As is the case with curbing campus sexual assault, a multipronged strategy is required, one that includes all members of the campus community. Hate crime researchers Levin and Nolan (2017) remind us that a missing ingredient in much of intergroup relations is empathy that cuts across group lines: the ability of an individual to feel the pain and suffering of groups to which she does not belong.
Footnotes
Declaration of Conflicting Interests
The authors declared no potential conflicts of interest with respect to the research, authorship, and/or publication of this article.
Funding
The authors received no financial support for the research, authorship, and/or publication of this article.