
Abstract
This article presents an historical analysis of the antitrust laws. Its central contention is that the history of antitrust can only be understood in light of U.S. economic history and the succession of dominant economic policy regimes that punctuated that history. The antitrust laws and a subset of other related policies have historically focused on the negative consequences resulting from the rise, expansion, and dominance of big business. Antitrust specifically uses competition as its tool to address these problems. The article traces the evolution of the emergence, growth, and expansion of big business over six economic eras: the Gilded Age, the Progressive Era, the New Deal, the post–World War II Era, the 1970s, and the era of neoliberalism. It considers three policy regimes: laissez-faire during the Gilded Age and the Progressive Era, the New Deal, policy regime from the Depression through the early 1970s, and the neoliberal policy regime that dominates today and includes the Chicago School of antitrust. The principal conclusion of the article is that the activist antitrust associated with the New Deal that existed from the late 1930s to the 1960s resulted in far stronger economic performance than have the policies of the Chicago School that have dominated antitrust policy since the 1980s.
Keywords
Antitrust policy has historically functioned as an integral part of a broader policy regime. These policy regimes are associated with distinct ideologies, which have evolved during different economic epochs in the United States. The assumptions of a prevailing policy regime guide individual actions and analyses of economic problems, while alternative approaches outside this framework are typically perceived as lacking in legitimacy. The struggle between different economic groups for political power shapes the dominant ideology. Policies and the ideologies that support them evolve with the political fortunes of such groups. Antitrust policy is not an exception. While advances in economic theory and policy experience over time do influence antitrust, larger policy paradigm shifts are responsible for the major disjunctions in antitrust theory and enforcement.
Antitrust policy is part of a subset of policies (e.g., corporate law, labor legislation, and regulatory law) focused on the perceived negative consequences attendant to the rise, expansion, and dominance of big business. The hunt for ever-higher profits by big business has yielded significant economic progress, but has also often spawned anticompetitive behavior, harm to the other classes in society, including labor and small business, and created macroeconomic instability. 1 These forms of harm, as Joseph Schumpeter observed, can result in suboptimal economic performance and the impairment of democratic institutions. 2 For example, when big business prevents real wages from increasing, it can erode economic incentives to innovate. 3 Antitrust has traditionally sought to protect and enhance the competitive process as its policy tool to address such issues.
The first section of this article identifies six epochs in the economic history of the United States, reflecting the milestones and transition periods in the development of antitrust law. 4 To be clear, this article does not purport to fully address the economic history of these eras. Its principal objective is to show that over these six economic epochs, there were three major policy regimes each reflecting quite distinct antitrust approaches. Up to the Great Depression, policy in the United States was broadly associated with laissez-faire consisting of an unmanaged economy and adherence to the gold standard. Although several new antitrust statutes emerged under this policy regime, there was minimal antitrust enforcement. This changed dramatically after the Great Depression. In the later part of the New Deal, a new policy consensus emerged that included strong regulation of finance, income equalization, high wages, support for unions, and strong antitrust enforcement. As detailed below, this new policy regime coincides with the greatest period of economic growth and prosperity in U.S. history. During the crisis of the 1970s, neoliberalism rose to policy prominence. This new policy regime expressed confidence that the unfettered actions of big business would result in positive economic outcomes for everyone. The Chicago School of antitrust is an integral part of the neoliberal policy program. This policy regime has resulted in significantly inferior economic performance compared with the New Deal policy that it replaced.
I. The Periodization of Antitrust History
This section introduces the long-term data series of the rate of profit in the United States from 1869 to 2015 as a device to help illustrate the periodization of antitrust history. 5 The periodization adopted here consists of six periods: the Gilded Age, the Progressive Era, the New Deal, 6 the post–World War II golden age of capitalism, 7 the crisis of the 1970s, and the age of neoliberalism which encompasses the present. 8
One can identify in Figure 1 the six major periods used in this article. From 1869 to the turn of the 20th century, there is a dramatic fall in profitability. It was the period of the emergence of big business, their struggle to contain “ruinous competition,” the rise of the trusts, and the Sherman Act response. After 1900, the profit rate stabilizes, as the corporate and managerial revolutions unfold, along with the Progressive Era effort to revise and supplement the Sherman Antitrust Act. At the end of the 1920s, the Great Crash occurred, attributable in part to the instability that accompanied the rise of large, highly managed, and interconnected firms. At the bottom of the Depression (1933), a new policy regime emerged with the New Deal, replacing the pre–Depression laissez-faire policy. The New Deal policy advocated strong antitrust enforcement, union power, and government-driven economic management. Figure 1 further depicts an enormous advance in the rate of profit associated with the New Deal. It was truly a great leap forward for the economy. The continued implementation of New Deal policies extended the high profit rates into the period immediately following World War II, a prosperous era known as the golden age of capitalism. Figure 1 also shows the dramatic fall in profitability that occurred at the end of the 1960s and continued into the 1970s. This is the period referred to in this article as the crisis of the 1970s. Subsequently, a new policy regime based on neoliberalism emerged with the Chicago School of antitrust as a central component. Far from advancing corporate efficiency and unleashing investment, neoliberalism has produced historically low profits, low growth, low productivity, and high-income inequality.
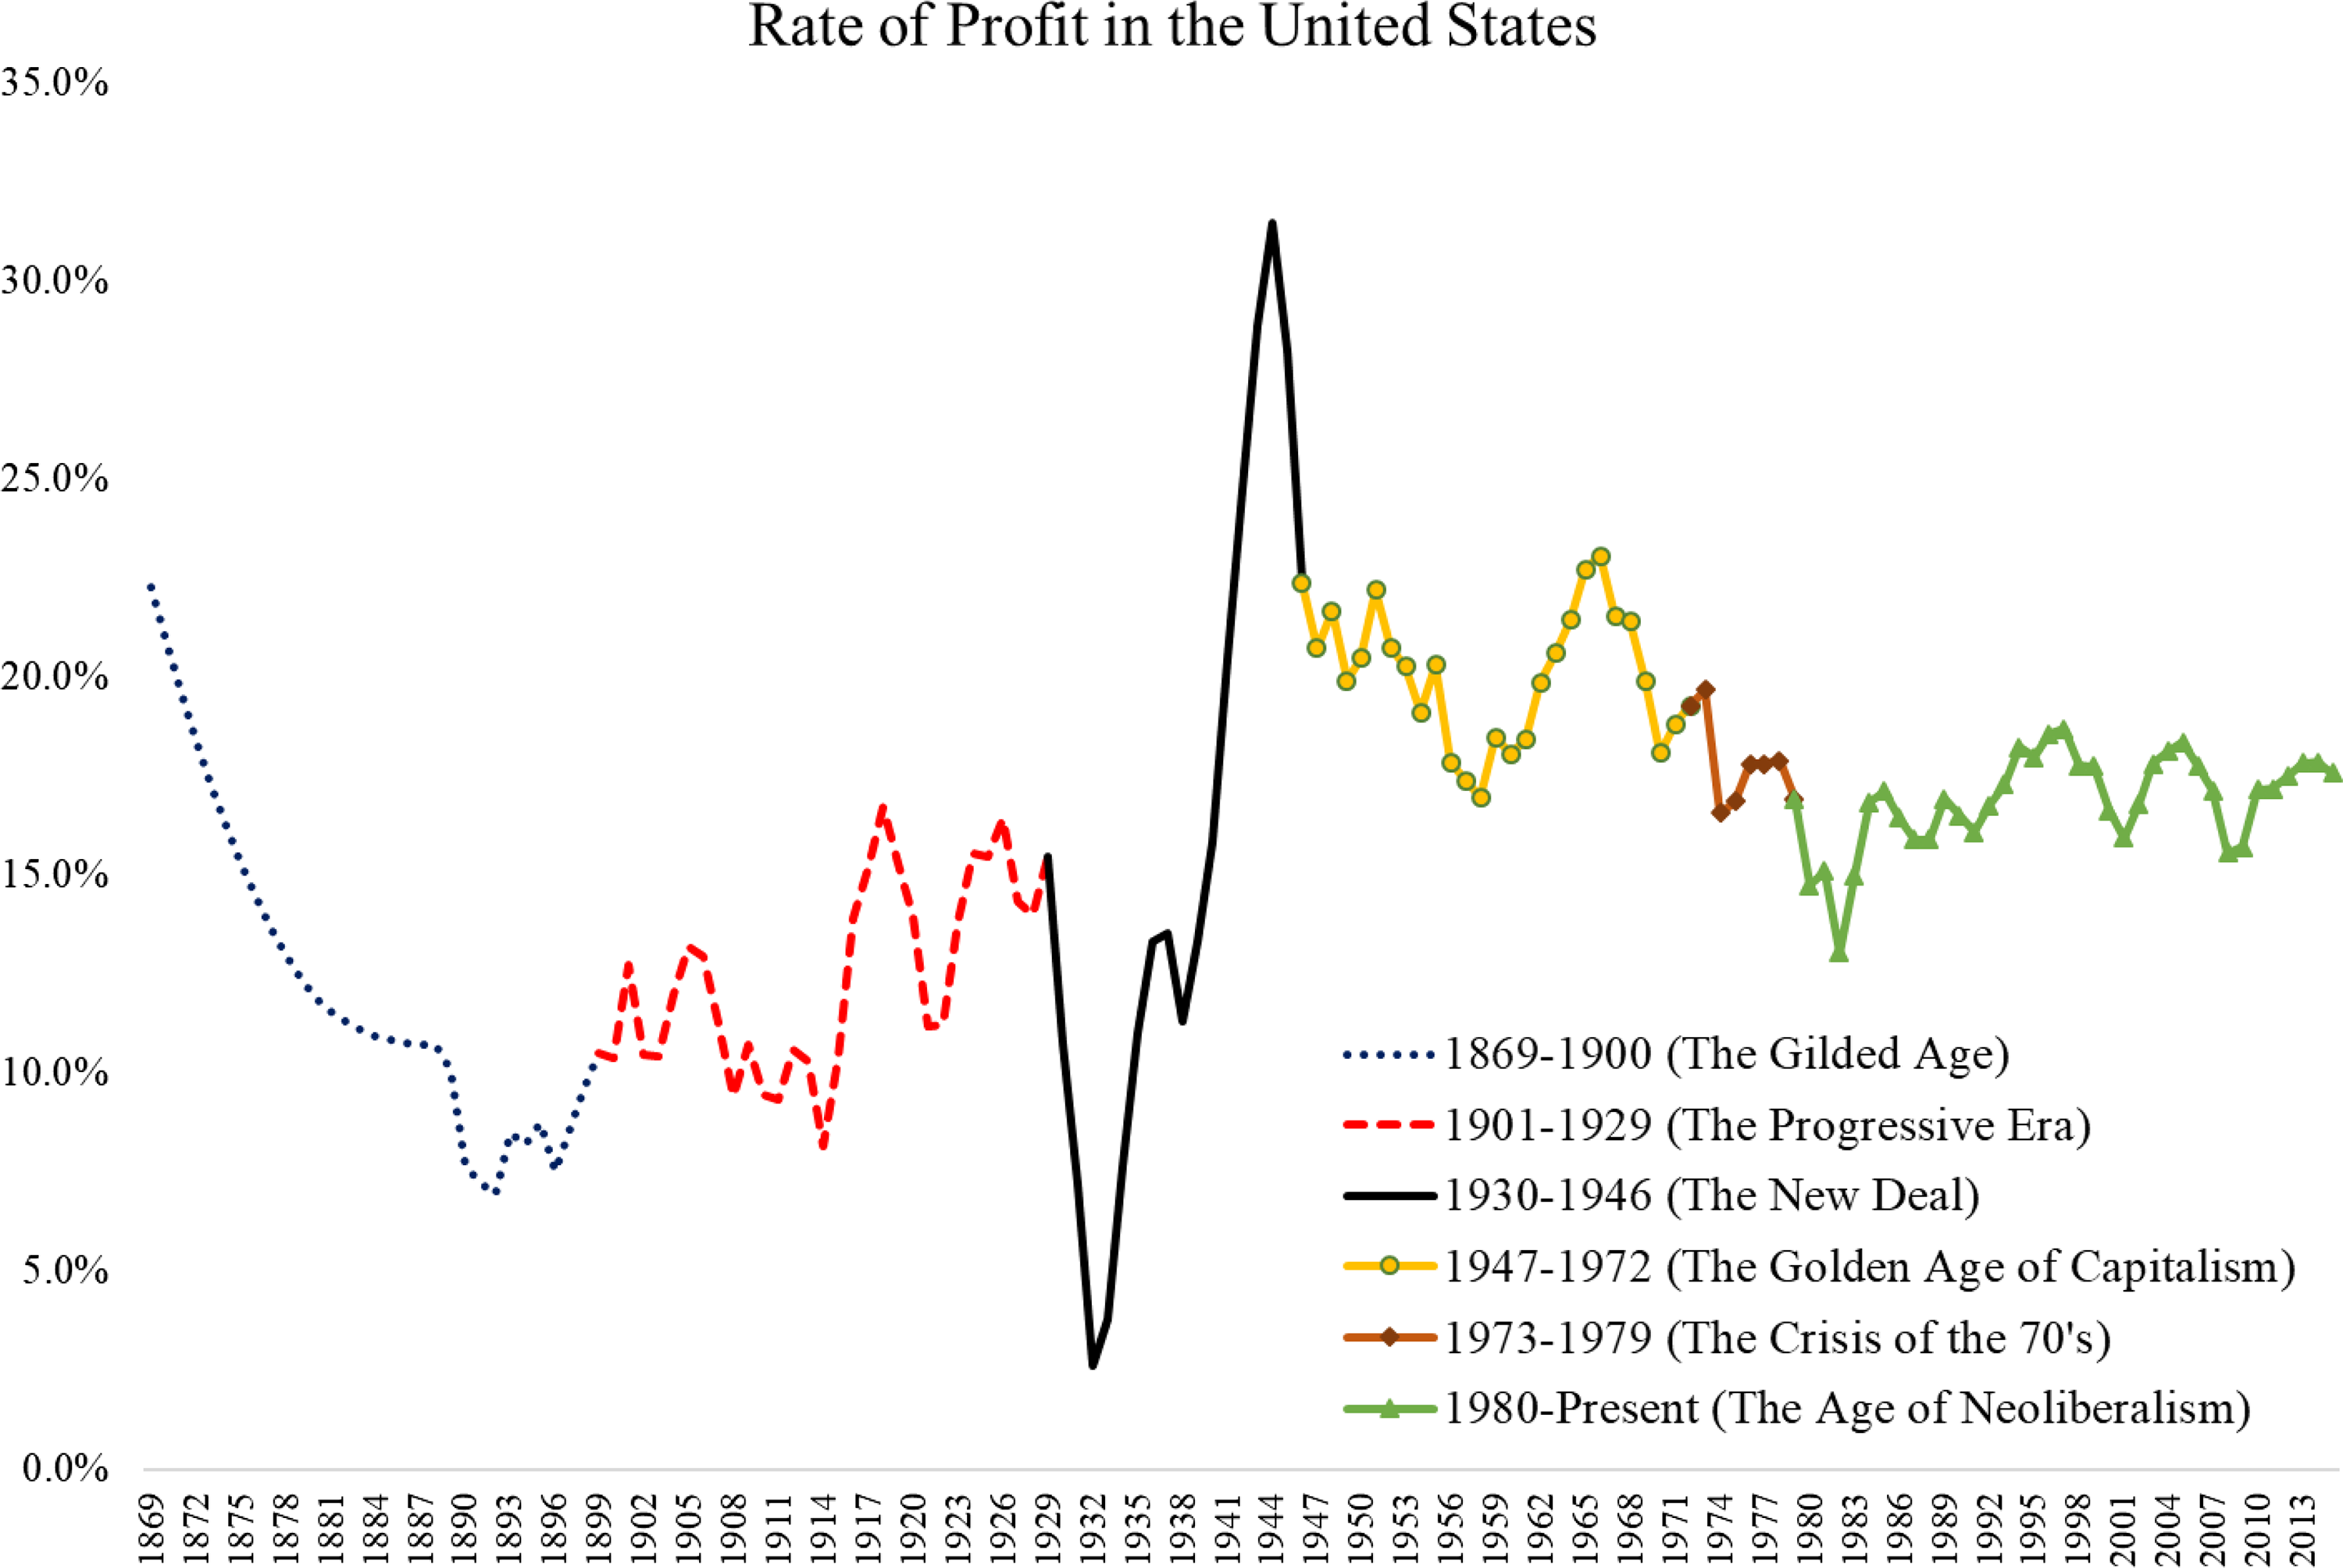
Rate of profit in the United States. Source: G. Duménil and D. Lévy, “The historical trends of technology and distribution in the U.S. Economy. Data and figures (since 1869)”. See Appendix 1. 9
II. The Gilded Age
The Gilded Age is the period when big business first emerged in the United States. In response to concerns about its impact by other sectors of the economy, Congress enacted the Sherman Act of 1890, the first, and arguably the most significant, policy attempt to regulate the behavior of big business.
A. Industrialization and the Managerial Revolution
The Industrial Revolution in the United States gained its full stride after the U.S. Civil War. During the antebellum era, agriculture and small industrial enterprises dominated the economy. The small personally managed industrial firms relied on water for power and had few employees. 10 The lack of sufficient supplies of coal and labor shortages delayed U.S. industrialization compared to Great Britain. 11
Immigration following the 1848 revolutions in Europe and the opening of the anthracite coalmines in Eastern Pennsylvania lifted the constraints on industrialization. 12 The modern business enterprise in the United States then emerged with the advent of the railroads, which were by far the largest and most dynamic industry of the early industrial revolution. The railroads represented a joint effort by local governments and private interests 13 and adopted the corporate form. The early railroads were formed as corporations because they followed the example of the quasi-public canal companies, which were also corporations. 14
Alfred Chandler described the technical problems involved in the operation of the railroads. The difficulties included coordination of tracking rights, standardization of equipment and procedures, and efforts to control competition. These challenges required skilled middle managers who “were responsible for devising and perfecting a number of basic organizational and technological innovations so central to the efficient operation of the railroads.” 15 The special requirements of railroad operations initiated the first managerial revolution in the United States. The demand for managers resulted in dramatic societal changes including engineering departments at leading universities, professional societies, and cultural transformations in American cities. 16 The investment needs of the railroads further formed the basis for the development of other large businesses including steel, machinery, chemicals, refining and distilling, and others. The railroads created mass markets served by new large retail and wholesale firms such as Macy’s, Lord & Taylor, Bloomingdales, Marshall Field’s, and other large retailers. 17 In turn, the mass market made large-scale production in consumer goods and other products feasible.
There is a common misconception that the Gilded Age was an era of free trade. On the contrary, industrialization in the United States in the 19th century occurred under the protection of a high tariff. The U.S. tariff on manufactured products ranged from 40% to 50% between 1875 and 1913. 18 Despite such protectionist policies, a global trade revival flourished between 1870 and 1913. While this increased commerce resulted from new technologies such as the telegraph as well as refrigeration, it consisted primarily of trade in agricultural products. 19
B. Big Business, Bertrand Competition, and Collusive Practices
The railroads and developments in communications helped break down local barriers to competition.
20
As a consequence, the new large firms faced fierce price competition from their peers. We now understand this phenomenon as Bertrand competition with homogeneous products, but it was called “ruinous competition” at the time.
21
Another consequence was nominal price deflation which also characterized this period. The wholesale price index in 1890 was 39.2% below its level in 1870.
22
Figure 1 evidences a spectacular decline in average profitability beginning in 1869 and continuing until the end of the 1890 recession at the turn of the century. The profit rate decline created serious macroeconomic instability. A deep recession resulted in 1873,
23
followed by subsequent recessions in 1876, 1889, and again in 1892.
24
Originally, this period was called the “Great Depression” before the term was appropriated and attached to the depression that began in 1929. Michael Roberts is one of a handful of economists to assemble the economic evidence from this period: Evidence for a depression in the United States is most dramatically seen in railroad construction, where the financial panic of 1873 was located…. Railroad construction began to recover after 1875, but it did so fitfully and basically remained flat and low during the 1876-78 period, fluctuating around 3,000 miles of construction. Only in 1879 did construction surge again up to 5,000 miles, followed by the biggest surge of all as the 1880s proved to be by far the leading decade of rail construction, followed by a nearly total collapse in the 1890s.
25
C. The Sherman Act
The actions of the trusts fostered significant public hostility. As Thorelli summarized, “it would seem that public concern, as conditioned by developments in the economic, social, constitutional and political fields, at the end of the 1880s had become serious enough to make federal action against the trusts a clear desideratum, if not an absolute necessity.” 29 The increased prices resulting from these trusts and pools had serious consequences for agriculture, urban workers, and small businesses. During the Gilded Age, these groups possessed significant political power that could potentially influence policy. 30 Political pressure mounted until legislative action was unavoidable, and on August 14, 1888, John Sherman introduced the first antitrust bill, which resulted in the eponymous act of 1890. The Senate debated the Sherman bill for 18 months without reaching any consensus on language or scope. Then, on March 27, 1890, the bill was referred to the judiciary committee. 31 Within a week, on April 2, 1890, the committee reported out a completely redrafted bill, largely the work of George Edmunds of Vermont. The bill passed the full Senate on April 8, 1890. The vote was nearly unanimous with only one dissenter.
What explains the extended two-year deadlock followed by the swift agreement? At the state level during that time, the political power of big business and the other economic classes including agriculture, small business and to a lesser degree labor were roughly comparable. 32 Big business was politically powerful, but so was agriculture and small business. The rhetoric of the Congressional debates reflects these contending class interests. Supporters of big business stressed the concept of freedom of contract, the right of business to enter into contracts of their choosing. Such freedom, they contended, included the right to enter into contracts with competitors or to buy and sell business property without restriction. Supporters of agriculture, labor, and small business adopted a narrative of free competition and the important role of government in protecting the competitive process. 33 The compromise bill by Senator Edmunds was sufficiently ambiguous that both sides could read it as supportive of their own position. This ambiguity is evident from the opening line of Section 1 of the Sherman Act that states, “Every contract, combination in the form of trust or otherwise, or conspiracy, in restraint of trade or commerce among the several States…is declared to be illegal.” The use of the word “all” coupled with the term “restraint of trade” which in the common law referred to only unreasonable restraints of trade sapped the Sherman Act of any plain meaning. The resulting semantic ambiguity implied “all” restraints, and “not all” restraints were within the purview of the Act at the same time. Therefore, decades of judicial interpretation would be required before the Supreme Court would settle on a clear and consistent meaning in the Standard Oil 34 case in 1911.
D. Early Sherman Act Enforcement
Once President Harrison signed the Sherman Act into law, the onus of enforcement passed to the executive branch, and in particular, to the attorney generals. Unlike the states, big business interests dominated the executive administrations during the Gilded Age, and consequently, attorney generals initiated few antitrust cases. 35 During the thirty-two months of the Harrison administration, for example, it brought only seven cases. 36 The Cleveland administration brought eight cases, four of which were against labor. 37 The McKinley administration filed only three antitrust suits. Indeed, the only individual to go to jail in the first few decades of Sherman Act enforcement was Eugene Debs, a labor leader and member of the socialist party.
Once cases began to reach the Supreme Court in the Gilded Age, the Court had to struggle with several difficult issues. For example, the Court had to reconcile the prevailing narrow definition of interstate commerce with antitrust enforcement against national firms. For example, it dismissed the challenge to an acquisition by American Sugar Refining that would have resulted in a 98% market share because the acquired assets were located in a different state than the acquirer. 38 Curiously, the Court had fewer problems upholding the applicability of the Sherman Act to labor activity in In re Debs, even though the legislative history of the Sherman Act indicated Congressional intent to exclude labor from Sherman Act scrutiny. 39 Of great significance was the Court’s decision in United States v. Trans-Missouri Freight Ass’n 40 that interpreted Section I of the Sherman Act to apply to all restraints of trade whether reasonable or not. 41 This decision would mobilize big business to organize to revise the Sherman Act and seek further supplementary antitrust legislation during the Progressive Era.
III. The Progressive Era
Antitrust policy was center stage during the Progressive Era. The passage of the Sherman Act did not quell the political opposition by the other classes to unfettered action by big business. The Progressive Era was also the period in which the corporate revolution replaced the robber barons with professional managers at the top levels of the large industrial firms. The rising strength of big business inspired commensurate public disapproval. The new large corporations sought revisions to antitrust and corporate law in an effort to alleviate the very real threat of more radical regulation being advanced by the popular classes and their representatives. Political stability thus required new legislation. This process resulted in the Clayton Act and the Federal Trade Commission (FTC) Act, both passed in 1914. Little change in antitrust enforcement activities followed in their aftermath. Big business continued to grow and advance apace, under a continued regime of laissez-faire unregulated capitalism.
A. The Corporate Revolution and the Rise of Finance
The giant industrial corporations were in many ways a product of the first great merger wave from 1887 to 1904. With the exception of the railroads, the early large American industrial enterprises were partnerships. The Gilded Age managerial revolution was limited to the middle levels of these partnerships, while owners maintained control at the top. The merger movement altered this structure through the formation of corporations. The corporate form required the replacement of the owners at the top levels of management with boards of directors. These boards were normally comprised of professional managers and banking interests. The merger movement also created the modern financial markets that arose to finance these acquisitions through the sale of securities to the public.
1. The Early Merger Process
The process of combining smaller competing industrial enterprises into the giant corporations could not have occurred without important revisions to the corporate law. As Lawrence Mitchell detailed, the merger movement transformed the role of bankers such as J.P. Morgan, John Gates, and Charles Flint. 42 The process that developed was for the leading acquiring enterprise to use its own stock to purchase an array of smaller competing firms. However, these types of transactions necessitated the reversal of existing prohibitions on corporate purchases using shares and the corporate rules against holding companies. Through intense lobbying efforts, state legislatures began to revise these traditional corporate principles. New Jersey was the first state to reverse prior precedent and allow purchases of other companies with stock. 43 This raised the further legal issue of how the purchased corporate property should be valued. Again, New Jersey led the way by allowing the good faith judgment of the directors to be determinative, cutting off liability to corporate stakeholders for mistaken valuations. The revised law allowed directors to affix high values on purchased assets, which also justified large amounts of issued stock. 44 Other states quickly followed New Jersey’s lead.
Wall Street promoters typically compensated the original industrial owners with bonds or sometimes preferred shares. The owners of the acquired entity would usually receive a combination of preferred and common shares in return for the sale of their firms. These sellers were usually savvy enough to require that the value of the preferred shares equals their own internal valuation of their company, plus they demanded additional common shares. The purchasing company was sometimes further required to limit their issuance of preferred shares to amounts equal to the value of their hard assets. The size of the issuance of common shares had to be justified by some measure of “good will,” but this generally involved significant speculation. The promotors received common shares as payment which created an incentive to sell the common share subscriptions to the public. William Lazonick offered a compact summary of this process: Here is how it worked. Wall Street investment banks—J.P. Morgan foremost among them—underwrote the merger of a group of firms in an industry to create a business entity with a large market share that could be floated on the NYSE. The underwriting syndicate issued corporate bonds to pay the owner-entrepreneurs and their private equity partners for their ownership stakes, and then sold the listed shares to the public over time as the syndicate saw fit. The result was the transfer of ownership of corporate assets from the original owner-entrepreneurs to an increasingly widely distributed population of shareholders.
45
In eight years from 1897 to 1904, corporations with assets totally $6,000,000,000 were organized, compared to a total of about $1,000,000,000 in the years between 1879 and 1897. By 1904 the top four percent of American concerns (the great majority of which were corporate in form) produced 57 percent of the total industrial output by value. By any standard of measurement, large corporations had come to dominate the American economy by 1904.
46
2. The Merger Movement and Top Management
The corporate revolution accelerated the managerial revolution by placing professional managers in charge of the most important decision-making functions of the firm. As Alfred Chandler wrote, “[t]he practices and procedures of modern top management had their beginnings in the industrial enterprises formed by merger.” 47 These new, top-level managers introduced for the first time, cost accounting, scientific management (“Taylorism”), public relations, market intelligence, interdivision coordination, and other measures. 48 This extension of the managerial revolution was fundamental to the ability of the large corporation to exploit the major scientific breakthroughs in electrification, advances in the internal combustion engine, steel alloys, furnace technologies, and other technologies created earlier or during the Progressive Era. 49 The impact of these events is evident from Figure 1 that depicts a slow increase in the rate of profit at the turn of the century (after the Gilded Age decline), and then another advance in the period following the recession of 1921. However, the managerial revolution also had negative consequences. Under tight management control, big business gained more leverage over their employees and could more effectively monitor and limit their freedom of action. In addition, the corporate ability to react quickly and decisively to economic changes in its environment further yielded recessionary dangers. 50
3. The Merger Movement and Financial Control
The processes that led to the giant corporations also initiated a process of financialization in the U.S. economy. 51 The bankers that had facilitated the merger process took board seats and sought to “obtain substantial, if not total, managerial control.” 52 The Morgan partners alone held 167 directorships in eighty-nine corporations with assets over $20 billion. 53 Bankers focused on protecting the value of corporate securities on the stock market both because banks owned large blocks of these securities and because they needed to protect their reputations with their clients who purchased bonds or stocks. Because of this self-interest, the financial sector board members advocated for high and regular dividend payments and the prompt payment of interest on corporate bonds. The financial sector’s increasing power made securities markets central for obtaining investment financings, and this structure eventually contributed to the advent of the Great Depression.
4. Antitrust Policy in the Progressive Era
Antitrust debates took center stage in the Progressive Era. This was not solely because of narrow concerns about the ability of the new corporations to raise prices but also because of the numerous ways that the managerial and the corporate revolutions disadvantaged the other classes in society. The proposed antitrust legislation in the Progressive Era included issues of financial disclosure, watered stock, destruction of small businesses, and labor’s rights within the new large enterprises. During the Progressive Era, the other traditional classes and groups, farmers, workers, and small businesses continued to possess significant political power, particularly at the state level. The majority of the population remained small agricultural proprietors, and “populism, representing powerful strands of the small-producer outlook, was the principal political antagonist of the corporate capitalist movement.”
54
The American Federation of Labor (“AFL”) grew in number and achieved some political successes at the state level.
55
The Socialist Party of America grew continuously until 1912 and “exerted a wide impact upon the political life of the nation.”
56
By 1912, the Socialists had 1200 elected public officials and published over 300 periodicals.
57
The transformations that occurred in the American economy touched all of these groups, and they feared the dilution of their political power and the destruction of their economic viability.
58
As Gabriel Kolko explained: Big businessmen feared democracy, especially on the local and state levels where the masses might truly exercise their will, and they successfully turned to the federal government for protection. This fear was articulated, often quite frankly.
59
No fewer than sixty-two unsuccessful bills embraced federal incorporation or federal licensing. An additional eight attacked overcapitalization and seven more tried to create some form of securities regulation…. Antitrust concerns remained central. But the growing congressional understanding that the “corporations” problem was bigger than monopoly alone led federal incorporation or licensing proposals to become the most frequently introduced type of antitrust legislation.
60
5. The Theodore Roosevelt Administration
Roosevelt viewed the large corporation as the natural result of modern economic progress. 61 His strategy was to bring large corporations under limited administrative regulation, thereby saving capitalism, in his words, from “revolutionary chaos.” 62 Roosevelt’s primary initiative was the 1903 Bureau of Corporations. He empowered the Bureau to investigate corporations, present their findings to the president (i.e., Roosevelt), and to publish its findings as he directed. The Bureau operated from 1903 until it became part of the FTC in 1914. Interestingly, the first report to the president in 1904 was highly critical of many corporate practices beyond monopoly pricing. The Bureau identified its primary antitrust concerns as “secrecy and dishonesty in promotion, overcapitalization, unfair discrimination by means of transportation and other rebates, unfair and predatory competition, secrecy of corporate administration, and misleading or dishonest financial statements.” 63 It further expressed concern about how industry had come under the excessive control of finance. 64
In March 1908, while Roosevelt was still President, Congress introduced the Hepburn bill, drafted by The National Civic Federation. The National Civic Federation was the primary organization that represented the political interests of big business at the time. 65 The Hepburn bill proposed a licensing scheme in which businesses could register and disclose essential business and financial information to the government. In return for registration, the government would prescreen prospective contracts. If an agreement was not found to constitute an “unreasonable restraint of trade” within thirty days, the government would then forfeit its right to bring an antitrust suit. Further, the bill prohibited private suits against registered corporations, and it granted labor an exemption from the Sherman Act (a provision added to gain the support of the AFL). 66 Opposition from the National Association of Manufacturers (NAM) was the primary reason for its defeat. 67 Both NAM and Roosevelt fiercely opposed the labor exemption in the Hepburn bill. 68 As a result, no significant changes to legal or administration control of big business occurred under Roosevelt. 69
6. The Taft Administration
William Taft succeeded Roosevelt as President in 1909. Taft also supported the interests of the large corporations, and he also recognized the necessity of some regulatory constraints to prevent social unrest. Unlike Roosevelt, Taft had more confidence in the ability of the judiciary to provide these necessary regulatory controls. Taft advanced no new administrative remedies, but instead brought twice as many Sherman Act suits as had the Roosevelt administration. 70
7. Woodrow Wilson and Louis Brandeis
Martin Sklar placed Woodrow Wilson’s antitrust approach somewhere between the approaches of Roosevelt and Taft. 71 Wilson, like Roosevelt and Taft, viewed the development of the large corporation as inevitable and progressive. 72 However, he also believed that government intervention was required “in the national interest to assure social welfare.” 73 In 1908, Wilson stated, “no one now advocates the old laissez-faire, no one questions the necessity of a firm and comprehensive regulation of business operations.” 74 According to Wilson, “big business is no doubt to a large extent necessary and natural. The development of business upon a great scale, upon a great scale of cooperation, is inevitable, and, let me add, is probably desirable.” 75 Whatever Wilson meant by the “old” laissez-faire, his administration embraced a policy ideology of minimal business regulation, little economic management of the economy, and strong deference to the gold standard.
Louis Brandeis was the chief economic advisor to Woodrow Wilson from 1912 to 1916, before Wilson appointed Brandeis to the Supreme Court in 1916. Brandeis served on the Court until his retirement in 1939. 76 Brandeis was far more critical of big business than was Wilson. He argued that the big corporations could not be justified by scale economies. Brandeis believed smaller businesses were often more efficient than their larger competitors and concluded that firms of excessive size were typically the result of unfair practices and not natural growth. 77 He opposed the influence of the financial sector 78 but supported fair trade laws that sanctioned resale price maintenance. 79 Also, like Wilson, Brandeis did not support the interests of labor. 80
In 1914, the Wilson administration passed the last two major pieces of antitrust legislation, the Clayton Act and the FTC Act. The National Civic Federation legislative agenda and the failed Hepburn bill strongly informed both laws. As Weinstein related, “the principles underlying the FTC were enunciated by corporation leaders and their lawyers consistently throughout the Progressive Era in response to a series of legislative and judicial actions stretching over some seventeen years.” 81 The FTC Act established a commission to carry out investigations, issue cease, and desist orders, all subject to judicial review. Big business did not get the provision it sought, namely a commission that could immunize business strategies. 82
In contrast to the FTC Act, the Clayton Act provided greater certainty by defining specific prohibited practices. The experience of the AFL whose support the National Civic Federation had garnered by promises of an antitrust exemption is instructive. Wilson, like Roosevelt, opposed a labor exemption. 83 However, labor did have some Congressional support and the AFL was able to obtain language in the Clayton Act stating that human labor is not a commodity (Section 6) as well as a qualified limitation of the labor injunction (Section 20). 84 Unfortunately, the Supreme Court interpreted the Clayton Act language narrowly against labor immunity. The Court held that the Clayton Act did not exempt secondary boycotts, 85 picketing, 86 primary boycotts, 87 and most strike activity. 88 The Court’s opinions dashed the hopes of the labor unions, and the injunctions continued. Federal judges issued roughly 2100 anti-labor Sherman Act injunctions in the decade of the 1920s. 89
World War I interrupted the potential implementation of Wilson’s antitrust legislation in April 1917. 90 In short order, the United States mobilized for the war effort. Wilson established the War Industries Board from 1917 to 1918 as a liaison between the military and American industry. It formed industrial trade committees to gather information, coordinate supply, and stabilize prices. 91 The trade committee structure appeared to successfully meet the needs of the American war machine. 92 The methods employed during the war then continued into the postwar period. Even after the hostilities subsided, managers at big businesses embraced industry cooperation through the new trade association movement. 93 Consulting firms such as Stevenson, Jordan & Harrison emerged to facilitate the formation and management of private trade associations. As during the war, these private trade associations would gather, organize, and disseminate information about prices, costs, and other market information, coming close to or actually implementing cartel formation in plain sight. 94 In 1921, President Harding appointed Herbert Hoover as Secretary of Commerce. From his position as Secretary of Commerce, Hoover also encouraged the trade association movement. “He fully expected that a modern commitment to managerial science and industrial engineering would provide the rational ground for a new commercial ethic of cooperative competition.” 95 This approach would also obtain Franklin Roosevelt’s blessing in the first New Deal, but then be abandoned.
B. The Rise of Instability and the Great Depression
There is no simple explanation for the great crash and the ensuring depression that occurred at the end of the 1920s. Any attempted explanation must distinguish between the initial downturn and the propagating mechanisms that exacerbated and prolonged the decline. This article argues that the instability associated with the rise of big business and the dominance of finance in the Progressive Era was an impetus for the initial decline, and the laissez-faire policy regime of the era limited the possible policy responses that might have precipitated an earlier recovery. Under the laissez-faire policy regime, expansionary fiscal policy was deemed illegitimate, and monetary policy was limited by a religious adhesion to the gold standard.
1. Big Business, Finance, and Instability
The 1920s was a period of relatively high wages. Real wages had risen sharply during the deflation that occurred in 1921 and continued to rise throughout the decade. 96 The real wage increased by 7% in 1921. 97 It continued to increase by just short of 3% per year in the 1920s. 98 Big business responded by intensifying the generalization of new management practices and the use of new technologies. 99 Referring again to Figure 1, we see that the rate of profit in the 1920s was relatively low despite these induced technological changes. The technological advances of the 1920s demonstrate the progressive side of big business. In addition to advances in management, Alexander Field describes how much of the progress in 1920s manufacturing involved the electrification of factories. Electrification allowed factories to be contained within one-story buildings, and electricity could efficiently power a moving assembly line. 100 However, these benefits came with a cost. Large interconnected firms with strong management gave rise to macroeconomic instability, because the well-managed firms reacted more strongly to economic shocks, and the reactions quickly permeated widely through an interconnected network of firms. Peter Temin has demonstrated that the initial downturn in 1929 was strongest in the industries dominated by the large efficient firms. 101 When an economic shock affects a large well-managed firm, the firm reacts immediately to avoid a rise in costs. For example, to avoid an inventory buildup following a demand shock, managers may swiftly cut production and curtail purchases of inputs. These reactions then cascade through the interconnected structure of production and distribution causing a recession. 102
The size and power of the financial sector also grew in the 1920s. 103 Carmen Reinhart and Kenneth Rogoff demonstrated how the financial sector has an unbroken record of creating instability through financial and banking crises. 104 As mentioned earlier, in the 1920s, the primary source of financing for big business derived from the issuance of stocks and bonds. Wholly owned affiliates of the big banks sold these securities to the public, who in turn financed these investments by call loans through brokers. 105 This structure required large firms to dedicate a large portion of its profits to dividends, 106 and by necessity, the fate of the stock market influenced investment decisions. 107
2. Propagation of the Crash and the Policy Failures
In August 1929, the economy entered a recession. At the same time, the stock market, soared above the levels achieved in 1928, and the Q-ratio reached historic levels. 108 The stock market then crashed in October 1929. 109 As the economy entered the recession, a large sector of small less advanced traditional firms failed. 110 Between 1929 and 1933, one third of all manufacturing establishments closed. 111 This further deepened the depression.
Large firms stopped spending and began to hoard cash, while the surviving small firms unsuccessfully sought support from the credit system. 112 Duménil and Levy attribute the problem to the increased riskiness of lending to small firms. 113 These practices resulted in further declines in output and prices, which increased the perceived risk of lending to the traditional firms even further. A vicious cycle ensued. Moreover, the deflation that accompanied the crash increased the real rate of interest on existing debt again worsening the insolvency of many firms. 114
A banking crisis occurred in October 1930, followed by two further episodes of bank closures in 1931 and 1933. 115 In the face of both a credit crisis and a series of banking crises, 116 the federal government and the new Federal Reserve System seemed completely paralyzed. 117 While there is no consensus on a complete explanation of the Great Depression, what remains undeniable is that the laissez-faire policy regime of the 1920s culminated in a stunning economic catastrophe. 118 In response, the federal government during the New Deal era would experiment with new institutional arrangements involving changing class alliances, and new economic and political policies, including antitrust policy. The New Deal would eventually resurrect the dismal U.S. economy and create one of the most profitable periods in U.S. history.
IV. The New Deal and the Great Leap Forward
The New Deal initiated a new policy regime that would achieve stunning success and propel the U.S. economy into the most prosperous period of its history. There is significant consensus among economic historians that “the years 1929-1941 were, in the aggregate, the most technologically progressive of any comparable period in the U.S. economic history.” 119 The combination of regulated finance, recognition of unions, social support policies, and strong antitrust policy resulted in lower inequality, greater technological change, higher profits, and higher productivity. Moreover, the New Deal put in place the apparatus for stronger countercyclical macroeconomic policy. This policy regime would survive until it was eclipsed by the regime of neoliberalism, including the Chicago School of antitrust during the crisis of the 1970s.
A. The First Order of Business: Suppress the Influence of Finance
On March 4, 1933, at the nadir of the depression, Franklin Roosevelt was inaugurated. As Thomas Ferguson aptly described, “taking office at the moment of the greatest financial collapse of the nation’s history, President Franklin D. Roosevelt initiated a dazzling burst of government actions designed to square the circle that was baffling governments elsewhere: how to enact major social reforms while preserving both democracy and capitalism.” 120 In his augural speech, Roosevelt stated what many thought at the time, that the economic crisis was the creation of “the unscrupulous money changers.” 121 Two days later on March 6, Roosevelt declared a national bank holiday. 122
Then in June 1933, Roosevelt signed into law the 1933 Banking Act, also known as the Glass–Stegall Act. Its most important provisions were the separation of commercial and investment banking 123 and the establishment of the Federal Deposit Insurance Corporation. 124 The Act addressed the swelling public concern that financial interests had diverted bank credit into speculation rather than productive uses. The 1933 Act also preserved the prohibition on interstate branch banking and prohibited interest on demand deposits. 125 Regulation Q allowed the Fed to set rates on time deposits. Collectively, the 1933 and 1935 Banking Acts created a banking system that limited competition between banks, and severed bank interconnections, to preserve stability and prevent contagion. The approach was successful. Only two banks failed in the first two terms of the Roosevelt presidency, and there were few large bank failures until bank deregulation began under neoliberalism. 126
In addition, the Banking Act of 1935 considerably strengthened the Federal Reserve System by wresting control of the Open Market Committee from the regional banks and placing it under the Federal Reserve Board, thereby increasing its effectiveness. 127 The Securities Act of 1933 required disclosure of accurate information about securities and outlawed false statements. The Securities and Exchange Act of 1934 created the Securities and Exchange Commission to regulate securities markets. Critically, these measures combined to curtail the negative influence that finance had exercised over the economy.
B. The Early New Deal
New Deal policy was never entirely consistent. Roosevelt’s early actions succeeded in limiting the power of finance, but in 1933, he did not have wide-ranging plans for industrial restructuring. In June 1933, Congress passed the National Industrial Recovery Act (NIRA). The logic of NIRA harkened back to the success of the War Industries Board and was based on the Gilded Age theory that ruinous competition was inimical to capitalist stability. Hugh Johnson, one of the leaders of the War Industries Board headed the National Recovery Administration (NRA), the agency created by the NIRA. Title I of NIRA created the industry codes that established prices and policy for industry participants. The opaque Section 7(a) guaranteed the right of labor to organize and collectively bargain. Section 5 exempted the codes from the Sherman Act. 128 The NRA enacted 546 industrial codes covering 550 industries and it issued 11,000 orders interpreting various code sections.
Roosevelt asked Clarence Darrow to head an NRA review board in 1934. The Darrow Report concluded that NRA was essentially creating small monopolies and labor rights were not improving. 129 Before Congress, Darrow testified, “the whole thing was obviously made for the rich man-for big business.” 130 Moreover, Johnson’s interpretation of the collective bargaining was largely limited to company unions and NRA did not effectively contribute to union strength. 131 The Supreme Court ultimately declared NIRA unconstitutional in A.L.A. Schechter Poultry Corp. v. United States. 132
C. The Later New Deal
While the early New Deal took many twists and turns, a consistent theme emerged following the demise of NRA. The policy convergence centered on efforts to reduce the power and income of big business and increase the income and power of the other classes. Ellis Hawley refers to this policy aim as “counterorganization”: But if one insisted on a dominant theme, he could probably find it in the concept of counterorganization, in the idea of using the government to promote the organization of economically weak groups, thus restoring economic balance…The advantages of stronger economic organization had long been stressed by labor, farm, and small business groups. The relatively new element was the attempt of these groups to enlist governmental aid in developing market power. Labor leaders had now abandoned their former devotion to ‘voluntarism’ and were urging that the government foster unionization, absorb the unemployed, and regulate wages and hours.
133
The Neo-Brandeisians had been lobbying Roosevelt throughout the NRA period to revitalize United States antitrust policy. 139 After NRA was declared unconstitutional, they got their chance. In 1937, Robert Jackson (a Neo-Brandeisian and admirer of Woodrow Wilson) was appointed head of the Department of Justice’s Antitrust Division, a position he held until March 1938. During his short tenure, he brought two landmark cases that would guide antitrust law in the post–World War II period: United States v. Socony-Vacuum Oil Company 140 and United States v. Aluminum Company of America. 141 In March 1938, Thurman Arnold replaced Robert Jackson at the Antitrust Division and served until 1943. Arnold rebuilt the Antitrust Division by significantly increasing its size and budget. 142 From 1939 to 1941, the Antitrust Division filed more than 180 cases. 143 By the time Arnold left the Antitrust Division in 1943, he participated in almost half of all Sherman Act cases ever brought up to that time. 144 This new potent antitrust policy continued to expand during the golden age of capitalism that followed.
D. The Later New Deal and the Remarkable U.S. Economic Performance
The New Deal policy was remarkably effective. At the end of the 1920s, the top 1% of the population garnered approximately 24% of total income. 145 During the 1930s, this number dropped to 16.6% before continuing to drop into the post–World War II period. 146 The New Deal policies of encouraging strong labor unions, more equitable income distribution, high wages, and vigorous antitrust policy resulted in the most spectacular increase in productivity and gross domestic product (GDP) growth in the history of the United States. The average rate of return on capital in the 1920s was nearly 14%. 147 The economy recovered to this level of profits by 1937. From 1940 to 1949, the rate of profit increased to 23%. 148 It never again declined to the level of the 1920s until the 1980s. 149
Figure 1 depicts the striking growth in profits from the 1930s through World War II. These remarkable achievements occurred in an environment of diminished international trade, as global trade had collapsed during World War I and did not revive until 1945. There can be no doubt that between the 1920s and the end of World War II, the American economy experienced a major economic advance. 150 The average total factor productivity 151 for the years 1900 to 1920 was about 1%. The average for the decade of the 1920s was 2%. It grew to 3% in the 1930s and 2.5% for the 1940s. It remained high at 2% for the years 1950 to 1973, but then dropped to below 1% for the period 1973 to 1990. The reasons for this huge advance in productivity include, among other factors, the exploitation of the late 19th century inventions of electric power and the internal combustion engine, 152 high wages (a result of strong unions and New Deal legislation, particularly the National Labor Relations Act of 1935), 153 and significant government intervention in the economy. High wages led to the substitution of capital for labor. 154 Alfred Kleinknecht, for example, studied the timing of the implementation of major basic innovations. He found that the period from the 1930s to approximately the late 1940s produced more basic innovations and greater “product-related breakthrough patents” in the 1930s and 1940s than any other period. 155 According to Alexander Field, “employment of research scientists and engineers grew 72.9 percent between 1929–1933 while employment totals in other occupational categories collapsed. Between 1933 and 1940, R&D employment in U.S. manufacturing almost tripled, from 10,918 to 27,777.” 156 There is evidence of technical advances in the 1930s in a wide variety of industries including chemicals, automobiles, communications, electronics, transportation, construction, retail and wholesale trade, and other industries. 157
E. World War II and Continued Success of the New Deal Policies
As early as 1939, the American economy began to respond to the Allies’s increased demand for armaments. 158 Then an explosion of defense spending began in 1940 when the Selective Service Act instituted the military draft. 159 Federal expenditures escalated, and wartime production transformed the economy to meet the military need. 160 In the 1920s, the ratio of federal spending to GDP was about 12%, it rose to 20% during the New Deal, but at the peak of the war effort the size of federal spending was 45%. During World War II, the federal debt also grew even though government had increased the tax base to include virtually all Americans and top rates reached 94%. The ratio of debt to GDP in 1938 was 43%. It ballooned to 114% at the height of the military spending in 1945. Most economists acknowledge that this expansionary fiscal policy contributed to the recovery from the depression. 161
The government also contributed to the productive capacity of the economy by directly building production facilities for the war effort. These plants were government owned but operated by private businesses (GOPO). The government constructed aluminum plants, steel plants, machine tool facilities, plants to produce machine tools and dies, the massive Willow Run facility near Detroit, and numerous forts and bases. Most of these facilities were large-scale projects. 162 In all, the government may have invested as much as $45 billion in private industrial plants and equipment. 163 After the war, private business purchased these assets under the Surplus Property Act of 1944, often at bargain prices. 164
The War Production Board also facilitated the expansion of existing capacity. 165 Robert J. Gordon conveyed how, “the entire economy converted to a maximum production regime in which every machine and structure was used twenty-four hours per day if enough workers could be found to staff three shifts.” 166 Duménil, Glick, and Levy showed that the maximum production regime resulted in the gigantic increase in the rate of profit by economizing on use of existing structures. 167
The government also sponsored research that would become important after the war. The War effort resulted in advances in radar, materials science, microwave technology, and products such as the jet engine, heavy water, continuous catalytic cracking, silicone, teflon, nylon, the aerosol spray, accelerators, and streptomycin. Vernon Ruttan contended that the government’s research efforts during the war also created radical “general purpose technologies” that would form the foundation of further post–World War II innovations. 168 Ruttan included aircraft design, nuclear power, and computer technology as key general purpose technologies that emerged from the war effort. 169
The War Production Board received the power to grant immunity from antitrust scrutiny. 170 Thurman Arnold had initiated investigations in steel, shipbuilding, aircraft, petroleum, electric equipment, chemicals, and other industries. 171 All of these investigations were suspended during the war. 172 However, the government did attempt to use the sale of the government facilities to increase competition. For instance, it helped sponsor the entry of Reynolds Aluminum by selling it the government constructed aluminum facilities. This undermined the Alcoa monopoly. Antitrust enforcement would revive and expand after the war during the golden age of capitalism.
V. The Golden Age of Capitalism
The policy regime change initiated during the later New Deal continued after World War II for almost three more decades. 173 Finance remained highly regulated. Antitrust, regulation, labor, and corporate law checked the power of big business. The government embraced expansionary fiscal and monetary policy. The Bretton Woods agreement regulated international trade, and the volume of world trade grew at an annual rate of almost 7% between 1948 and 1990. 174
The U.S. economy emerged from World War II with modern technology, high wages, strong unions, low and declining inequality, and a political consensus favoring government management of the macroeconomy. 175 The economy quickly advanced as patterns of R&D and physical capital accumulation adjusted away from the contingencies of war production. 176 During the 1950s and 1960s, the U.S. economy grew at an average rate of 4.4% per year. Unemployment averaged 4.6% per year. Inflation was low at an average of 2% and productivity was growing. 177 At the same time, the United States was building the Great Society programs, constructing infrastructure, and the private sector was leading the world in industries such as consumer electronics, computers, and traditional industries such as automobiles and steel. 178 In these decades, corporate profits were high and inequality was low. The average rate of profit for the period 1950–1969 was 11.7%, and the share of the top 1% of income earners was about 10.1% compared to approximately 18.8% in the 1920s. 179
After World War II, there was a brief period of strike activity and an effort to roll back the power of unions which included the passage of the Taft–Hartley Act of 1947. But the effort to destroy the power of labor failed. Instead, an implicit arrangement between labor and capital emerged. 180 Unions agreed to give corporations autonomy in technological change and control over production and investment. In exchange, unions obtained expanded benefits and an expectation of wage increases tied to productivity increases. 181 Emblematic of the implicit arrangement was the “Treaty of Detroit” which was the five-year UAW-GM labor contract negotiated in 1950 and emulated in other industries. This contract linked wage increases to inflation and productivity increases and provided workers with a pension plan and health insurance.
A. Antitrust in the Golden Age of Capitalism
The Golden Age of Capitalism was a period of activist antitrust enforcement. A broad per se rule for horizontal conspiracies prevailed based on the holding in United States v. Socony-Vacuum Oil Co. One of the leading merger cases, Brown Shoe Co. v. United States, 182 articulated the Congressional goals of merger policy to include 183 preventing the “rising tide of concentration,” control of vertical and conglomerate mergers, and recognition of noneconomic concerns such as protecting political democracy. 184 In Brown Shoe, the Court found that an historical trend toward vertical integration along with a small foreclosure of less than 1% was sufficient to condemn the vertical merger, and postmerger market shares ranging from 5% to 57% in the various geographic markets were enough to render a horizontal merger illegal. Significantly, the Supreme Court stated that a merger that increases concentration cannot be “saved, because, on some ultimate reckoning of social or economic debits and credits, it may be deemed beneficial.” In other words, efficiencies were not part of the Court’s merger analysis. The Supreme Court also reaffirmed that small levels of foreclosure can condemn vertical mergers where the target is also a potential entrant, as in Ford Motor Co., v. United States. 185
The 1968 Merger Guidelines promulgated by the Department of Justice (DOJ) Antitrust Division embodied these principles. The guidelines stated that the DOJ would challenge mergers in markets where the four-firm concentration ratio is above 75% even when the acquiring and acquired firms have market shares smaller than 5%. The criteria became more stringent when there was a trend toward concentration. The Guidelines prohibited vertical mergers involving supplying firms with 10% or more of sales in the market, or purchasing firms with more than 6% of total purchases in the market, unless barriers to entry were low. The 1968 Merger Guidelines also challenged conglomerate mergers involving a potential competitor when the merging firms had significant market shares. 186
B. The Origins of the Chicago School
The Chicago School of economics emerged from the crucible of a broader intellectual movement called neoliberalism. 187 Allegedly, the term neoliberalism originated at the Walter Lippmann Colloquium in Paris in 1938. 188 The Mont Pelerin Society, which held its first meeting in 1947, became the organizing hub of the neoliberal movement. Its leaders included Austrian economists Friedrich Hayek, Ludwig von Mises, Wilhelm Ropke, and Milton Friedman. George Stigler, Gary Becker, and James Buchanan were frequent participants. 189 The participants in the neoliberal movement did not have a unified theory in all respects. 190 As the historian Ben Jackson describes, “Among the authors conventionally bracketed together as the founders of neoliberalism, there was, as might be expected, a spectrum of positions on these [economic] issues, rather than a uniform line.” 191 What united these men was their opposition to expanding the role of the state, including opposition to regulation that protected unions and employees, government social programs, public or regulated enterprises, and any obstacles to free trade. 192
The two central figures in the neoliberal movement were Frederick Hayek and Milton Friedman. 193 A key feature of both thinkers was the tendency to assume way the power and impact of big business. In The Road to Serfdom, published in 1944, Hayek argued that all types of state action, whether central planning or New Deal regulation, illegitimately infringed on human freedom of action. However, nowhere did he express any concern for the enormous growth in firm size which places employees under the strict command and control of managers. 194 Hayek posited that freedom is advanced only by the market, yet these big businesses are the result of market forces, not government action. Hayek further argued that any command and control regime would result in a failure of economic coordination. He argued that collective action distorts the price information necessary to achieving a position of economic equilibrium, a prerequisite for economic welfare. 195 Since the publication of Hayek’s work, economists have shown that, contrary to his assertions, market signals and information extracted from prices can yield destabilizing results. 196 Hayek only assumed that information carried by market prices could achieve equilibrium and create favorable welfare outcomes. He never modeled the process nor did he marshal empirical evidence to support his supposition. Thus, there is little reason today to credit the policies prescriptions that he derived from this theory.
Milton Friedman, in his book, Capitalism and Freedom, also assumed large firms out of existence. Friedman recognized only two ways to organize society: “One is the central direction involving the use of coercion—the technique of the army and of the modern totalitarian state. The other is voluntary co-operation of individuals—the technique of the market place.” 197 He argued that the advantage of the market place is that it involves voluntary transactions in which both parties gain. He asserted that a society of individuals that contract voluntarily will result in maximum freedom, 198 and collective action by the government and labor unions threatens this freedom.
What is ignored is that the bulk of the population are forced to work for corporations, and these corporations use command and control, “the technique of its army,” to deprive workers of all control over their labor. In contrast, Friedman’s corporations are not collective entities, they are assumed to be equivalent to individuals. He stated that “enterprises are private so that the ultimate contracting parties are individuals.” 199 Accordingly, for Friedman, any exercise of power by corporations over its employees is legitimate, while government action and the collective action of labor in response to that power is not. 200 Again, the neoliberals assumed out of existence the central historical issue of the conduct of big business. 201
Nancy Maclean makes a similar point in her discussion of James Buchanan’s work: The dream of this movement, its leaders will tell you is liberty. ‘I want a society where nobody has power over the other,’ Buchanan told an interviewer early in the new century. ‘I don’t want to control you and I don’t want to be controlled by you.’ It sounds reasonable, fair, and appealing…. This cause defines the ‘you’ its members do not want to be controlled by as the majority of the American people. And its architects have never recognized economic power as a potential tool of domination to them, unrestrained capitalism is freedom…. It would like to reinstate the kind of political economy that prevailed in America at the opening of the twentieth century, when the mass disfranchisement of voters and the legal treatment of labor unions as illegitimate enabled large corporations and wealthy individuals to dominate Congress and most state governments alike, and to feel secure that the nation’s courts would not interfere with their reign.
202
Neoliberals realized that strong state action was the only way to unwind the New Deal. They believed that “its [the state’s] political program will triumph only if it acknowledges that the conditions for its success must be constructed, and will not come about ‘naturally’ in the absence of concerted effort.” 203 This required that the state “guarantee the success of the market and its most important participants, modern corporations.” 204 As Chicago economist George Stigler commented in 1960, the “political process is strongly biased toward collectivism.” 205 Stigler suggested that one route to success would require “the restriction of the franchise to property owners, educated classes, employed persons, or some such group.” 206 At the 1954 meeting of the Mont Pelerin Society, James Buchanan argued that the “maintenance of [a] free society may well depend on the removal of certain decisions from majority-vote determination.” 207 Friedman followed this logic by opposing universal suffrage in Southern Africa 208 and established a long-standing relationship with the Pinochet dictatorship in Chile. 209
The neoliberals of the Mont Pelerin Society and the Chicago School were joined at the hip. As Mirowski and Plehwe explain, Hayek worked with Henry Simons to bring Aaron Director to Chicago and to establish the original Chicago School. 210 Hayek was instrumental, along with others at the Chicago Law School and the Chicago Department of Economics, including Milton Friedman, in securing funding for the “Free Market Study” under the direction of Aaron Director and Edward Levi. The funding came from the Volker Fund. The project strove to advance the neoliberal project into new areas of policy. The “Antitrust Project” followed The Free Market Study and ran from 1953 to 1957. The project developed the basic Chicago School analysis of antitrust law. The Antitrust Project included work by Aaron Director, Edward Levi, John McGee, Ward Bowman, and Robert Bork. 211 This effort’s later expansion included a program in law and economics, and research fellowships were granted to Ronald Coase and Richard Posner. 212 The subsequent Chicago School “research program” produced a massive number of papers, all of which questioned the premises of the New Deal antitrust policy regime. 213
In their 1956 article, Aaron Director and Edward Levi discussed the emerging views of the Chicago School of economics on the antitrust law. 214 They plainly stated their main point: “We believe the conclusions of economics do not justify the application of the antitrust laws in many situations in which the laws are now being applied.” 215 Critically, Director and Levi asserted “the act [Sherman Act] arose out of an antipathy towards monopoly, and those restraints which were thought to have consequences of monopoly. And it is in the identification and the prediction of the consequences of monopoly that economics has the most to contribute.” 216 Thus, according to the authors, only mergers to monopoly and price-fixing cartels were legitimate objects of antitrust scrutiny. Director and Levi doubted that any single firm actually could exercise true monopoly power. “It is much less common than it was [earlier in time] to have an industry in which one firm has seventy or more percent control over productive capacity or sales.” 217 Abusive conduct such as vertical integration, tying price discrimination, resale price maintenance, and exclusionary conduct should not come under antitrust scrutiny because “economic teaching gives little support to the idea that the abuses create or extend monopoly.” 218 Thus, Director and Levi redefined the goals and purview of antitrust enforcement and called for a radically scaled back antitrust regime, which presaged the more detailed reconsideration of antitrust put forward by Robert Bork and Richard Posner.
By the late 1970s, the Chicago School had a well-developed antitrust policy program, wherein the only legitimate goal of antitrust enforcement is to prevent price increases that result from excessive market power. Often referred to as the “consumer welfare” standard, Robert Bork coined this term and argued for “exclusive adherence” to its standard. 219 The Chicago School contended that horizontal conspiracies did not require significant enforcement resources because they believed cartels to be unstable with a tendency to self-destruct because of the strong incentive to cheat. 220 In their view, mergers, particularly mergers that are not to monopoly, are usually efficiency increasing and undertaken for that purpose. 221 They argued that predatory pricing is an irrational business strategy because the predator loses money during the predation stage, and “if he tries to recoup it later by raising his price, new entrants will be attracted.” 222 Only under very specific conditions does a tying arrangement raise antitrust concerns. 223 The logic is that firms face a reservation price on the bundle of tied goods and have the option of raising the price of the tying product in order to obtain any available rents. Consequently, tying is not a profitable strategy unless it results in efficiencies. 224 Resale price maintenance and nonprice vertical restraints are also efficiency producing because they were necessary for the provision of presale dealer services. 225 Nor does vertical integration present an antitrust concern. The concern raised by a vertical merger is the foreclosure or inability of a competitor to gain access to vendors or distributors. According to the Chicago School, this scenario would not happen. Vertical mergers merely realigned trading parties and do not cause foreclosure. 226 Moreover, vertical integration usually involved efficiencies such as the elimination of the double marginalization problem and the elimination of transactions costs from contracting. 227 In sum, little to no antitrust enforcement was warranted. They maintained that big business seeks efficiencies, which benefit the economy as whole, and the previous antitrust policy had been harmful and unwarranted. In the crisis of the 1970s, the Courts would implement the minimalist Chicago School program.
VI. The Crisis of the 1970s
Figure 1 demonstrates a virulent fall in the rate of profit in the United States beginning in 1966. Ferguson and Rogers argue that 1966 also marked the beginning of the decline in the New Deal political coalition. 228 In the 1970s, the American economy plunged headlong into a crisis that visited significant pain upon individuals at all income levels. 229 Critical for the narrative here is the pressure that crisis of the 1970s placed on high-income recipients and businesses. This pressure accelerated the conservative political counterattack on the New Deal policies that had begun earlier. 230 Among the goals of the counterattack were the removal of all barriers to increases in income and wealth, the cessation of regulation of the financial sector, dilution of the power of unions, and the hobbling of antitrust enforcement. The well-funded conservative organizations that emerged to implement this program were pivotal to the rise to policy dominance of the Chicago School. 231
A. Economic Performance in the Crisis of the 1970s
The 1970s were a period of significant crisis in the United States. The initial fall in the rate of profit in 1966 was a result of competition from Japan and Germany. By the late 1960s, the German and Japanese economies had recovered from World War II and successfully challenged the United States in several major industries including consumer electronics, automobiles, steel, petrochemicals, and other industries. However, there were also other factors at play. Another problem was that the economy appeared to have exhausted the limits of the technologies such as electrification that had undergirded the great leap forward and the golden age of capitalism. 232 As a consequence, the growth of productivity declined sharply in the 1970s. Robert J. Gordon calculated that total factor productivity on average between 1920 and 1970 was 1.89, but from 1970 to 1994, the rate of total factor productivity growth dropped to 0.57. At the height of the New Deal, total factor productivity had reached 3.0. Additional factors also contributed to the decline including the two Organization of the Petroleum Exporting Countries (OPEC) oil shocks. Ferguson and Rogers describe the 1973 rise in oil prices as “one of world history’s truly momentous events.” 233 Because of all these factors, the profit rate for corporations and other firms dropped significantly from a high in 1966 to an historical low point in the 1973 recession. The average profit rate for the decade of the 1970s was 7.9%, a significant reduction from the 1950s and 1960s. The unemployment rate in the 1970s grew to an average of 6.22% per year 234 and inflation exploded to an average 7.09% per year. These were truly crisis-level statistics.
B. The Impact of the Crisis on the Incomes of the Wealthy and the Political Backlash
The economic crisis of the 1970s harmed every sector of the economy, but particularly affected financial corporations and high-income individuals. Corporate profits fell significantly while the stock market flatlined. 235 Growing inflation resulted in low real interest rates, near zero in 1971 and negative in 1975, which were detrimental in the financial sector. The average real interest rate between 1971 and 1978 was only 1.2%. The profits of financial corporations suffered as evidenced by their greater profit decline relative to corporations outside the financial sector. 236 Finally, the 1970s saw the income share of the top 1% of earners reach a post–World War II low. 237
The economic situation facing corporations, finance, and the wealthy sparked a major political backlash. The backlash took many forms but included what John Saloma referred to as the conservative labyrinth of well-funded conservative think tanks, corporate groups, and other organizations that grew in size and influence in the 1970s.
238
Emblematic of this revolt was the 1971 memo sent to the U.S. Chamber of Commerce titled “Attack on American Free Enterprise System” by future Supreme Court Justice Lewis Powell. The Powell memo “is widely cited as the beginning of the corporate mobilization to transform American law and politics.”
239
Powell called for businesses to organize, plan, and understand the importance of political power to their economic interests. According to Peter Temin, Charles Koch “was galvanized by the Powell Memo and formed the Cato Institute,” an organization focused on the proliferation of free market ideas among academics.
240
As described by Jacob Hacker and Paul Pierson, the ensuing counterattack of business was “a domestic version of Shock and Awe.”
241
Hacker and Pierson describe the situation: The number of corporations with public affairs offices in Washington grew from 100 in 1968 to over 500 in 1978. In 1971, only 175 firms had registered lobbyists in Washington, but by 1982, nearly 2500 did. The number of corporate PACs increased from under 300 in 1976 to over 1200 by the middle of 1980….
242
VII. The Age of Neoliberalism
The neoliberal political movement was remarkably successful. The policy transformation began in the Carter administration with the effort to deregulate airlines via The Airlines Deregulation Act of 1978 and trucking and railroad transportation via The Staggers Rail and Motor Carrier Act of 1980. 247 Carter appointed Paul Volker to head the Federal Reserve in 1979. The Volker-induced high interest rates propagated a flow of capital into United States, which strengthened the value of the dollar. The high dollar crippled export sales, which devastated manufacturing, a key union stronghold. As a result, union workers fell from 23% of the working population in 1979 to 16% by 1985. 248
The state became openly hostile to labor with the election of Ronald Reagan. 249 Early in his administration, the air traffic controllers went on strike. 250 Reagan responded by firing the entire workforce and replacing them with scab labor. In addition, Reagan also appointed Donald Dotson, a former management labor consultant, to chair the National Labor Relations Board. 251 Dotson oversaw “a succession of rulings that gave management greater leeway to interrogate and fire union supporters and to make misleading statements during union elections.” 252 These rulings and other measures described below significantly eroded union strength and ultimately resulted in a continued decline in union membership in the United States. By 2013, only 11.3% of the workforce belonged to a union. 253 Under the Reagan administration and subsequent presidents, Congress further allowed the real federal minimum wage to decline. In 2015 dollars, the minimum wage was $9.44 in 1980. In 1990, the minimum wage had eroded to $6.87. 254 The clear aim of the neoliberal policies was to restore profits and high incomes.
A. The Success of the Chicago School Antitrust Program
The first significant Chicago School antitrust success at the Supreme Court was Continental T.V. Inc. v. GTE Sylvania Inc. 255 There, Louis Powell (of memo fame), writing for the 6-2 majority, held that nonprice vertical restraints warrant only rule of reason analysis. As a result, vertical exclusive customer and territory restrictions became very difficult to challenge. The standard for proving vertical conspiracies was also elevated in Monsanto Co. v. Spray-Rite Service Corp., 256 and the per se rule against Resale Price Maintenance slowly eroded away until it was finally eliminated in Leegin Creative Leather Products v. PSKS, Inc. 257
In the late 1970s and the 1980s, the Court began to carve out exceptions to the per se rule against horizontal price fixing. The GTE Sylvania decision had signaled that a “demanding standard” should be applied before the per se rule should be applied. 258 In Broadcast Music, Inc. v. Columbia Broadcasting System, Inc., 259 the court carved out the exception for situations where horizontal coordination was plausibly needed in order to offer a “new product.” In National Collegiate Athletic Association v. Board of Regents of University of Oklahoma, 260 the Court found that the NCAA came within the new product exception to the per se rule. I do not mean to suggest that BMI and Board of Regents were purely the result of the influence of the Chicago School. While the Chicago School contended that cartels were unstable and less worrisome than earlier thought, there were legitimate limits to the application of the Socony Vacuum approach. For instance, integrated entities, like firms and partnerships, could not reasonably be subject to the per se rule. However, the Chicago School swayed the Courts to make exceptions even for more loosely integrated structures like the NCAA. 261 The Chicago School’s skepticism about cartel stability also contributed to the higher burden that emerged for proof of conspiracy in Matsushita Electric Industrial Co. v. Zenith Radio Corp. 262 and Bell Atlantic Corp. v. Twombly. 263
The Chicago School influence also led to a more permissive approach to mergers. In United States v. General Dynamics Corp., 264 the Court rejected the DOJ’s reliance on market shares challenging the assumption that they reflected future competitive significance. Extending the departure from earlier precedent, lower courts also engineered several defenses to a merger challenge. In United States v. Syufy Enterprises, 265 the 9th Circuit allowed a merger with high market shares because of evidence of easy entry, as did the D.C. Circuit in United States v. Baker Hughes Inc. 266 Then, in Federal Trade Commission v. University Health, Inc., 267 the 11th Circuit held that evidence of substantial efficiencies can be used to rebut evidence of higher concentration.
Since 1982, the various versions of the Horizontal Merger Guidelines published by the DOJ and FTC weakened earlier agency merger enforcement. 268 The current 2010 Horizontal Merger Guidelines requires much more than the original structural presumptions mandated by the Court in the Brown Shoe and Philadelphia Bank cases. Instead, the Guidelines require that the agencies develop and prove an anticompetitive scenario that would likely result from the proposed merger. Even if that exacting hurdle is met, a showing of easy entry or possibly significant efficiencies can still defeat the case for the merger challenge.
Finally, the Chicago School completely eviscerated any FTC or DOJ interest in enforcing the Robinson–Patman Act, despite the fact that both Congress and the Courts have resisted the wholesale abandonment of that law. While the Robinson–Patman is still viable, the Courts have whittled away at the Morton Salt 269 approach, making the burden for meeting the cost justification defense lighter, while rendering the element of competitive injury (and antitrust injury for private plaintiffs) much more difficult.
1. Higher Concentration and Higher Profits
Recently, there has been an enormous outpouring of analysis and data questioning the effectiveness of antitrust enforcement under the sway of Chicago School principles. This literature is broad in nature, including the popular press, 270 economics journals, 271 policy institute papers, 272 and law reviews. 273 The literature indicates a consensus that market concentration in the United States has grown significantly since the 1990s. However, rising concentration does not conclusively demonstrate an increase in market power because national concentration data assume national geographic markets and product categories that may not be coextensive with product markets. However, concentration does show that big business has grown in size. 274 In addition, anecdotal evidence suggests that market power has increased. As a representative sample of this literature, Jonathan Tepper and Denise Hearn observed that today just three companies control the nation’s cable market. Microsoft still has a 90% share in computer operating systems. Facebook has 75% of the global social media market, and Google has 90% of search advertising. Moreover, a small number of big firms control many industries: milk, modified seed, microprocessors, airlines, health insurance, medical care, group purchasing organizations, drugs, meat and poultry, agriculture, media, title insurance, and other industries. 275
A second major result of lax antitrust enforcement is that the markups, and therefore profit margins, of these large firms that have increased. In their widely cited NBER paper, De Loecker and Eeckhout found, for example, that firm-level markups have increased from 18% to 67% since 1980. 276 Numerous studies have come to similar conclusions. 277 Many factors influence profits, and market power can be a key influence. Market power can cause differential profits between firms. Market power in consumer goods industries can lower real wages and can increase profits system wide. 278
2. The Post-Chicago School of Antitrust
The Chicago School has not gone unchallenged in the neoliberal era. Beginning in the 1990s, a group of less conservative economists engaged in theoretical and empirical industrial organization analysis took issue with many of the key premises of the Chicago School. As Tim Wu described in his recent book: The Chicago movement, unsurprisingly, began to encounter major resistance during the 1980s through the 2000s. A group of economists and other academics, styled the “post-Chicago” school, emerged to challenge many of its basic premises. What the post-Chicago academics demonstrated was this. Even if you took a strictly economic view of the antitrust laws, you didn’t actually reach Bork’s conclusions.
279
Generally, the post-Chicago economists have favored stronger antitrust enforcement, 291 though their influence has been limited. While these economists have helped to mold agency policy, Courts have been stubbornly resistant to abandoning Chicago School principles. For example, in Verizon Communications v. Law Offices of Curtis V. Trinko, 292 the Supreme Court stated, “the opportunity to charge monopoly prices—at least for a short period—is what attracts business acumen” and leads to “innovation and economic growth.” There is little empirical evidence to support this supposition. The Court’s opinion is merely Chicago School conjecture. 293
In Brooke Group Ltd v. Brown & Williamson Tobacco Corp., 294 the Supreme Court heightened the burden for demonstrating predatory pricing, while ignoring the post-Chicago School theories of recoupment. 295 In Leegin Creative Leather Products, Inc. v. PSKS, Inc., 296 the Supreme Court overturned one hundred years of precedent to hold that resale price maintenance was no longer per se illegal and that the rule of reason would apply. 297 The majority accepted the Chicago School presumptions without factual confirmation. The only case in which the post-Chicago School analysis arguably prevailed over the Chicago School at the Supreme Court appears to be Eastman Kodak Co. v. Image Technical Services, Inc. 298
B. Higher Profits and Income from Globalization
Quinn Slobodian describes how a central tenet of the neoliberal agenda was free trade and globalization. 299 Indeed, neoliberal economists had earlier pushed for an elimination of capital controls. The United States and most European countries lifted capital controls in the 1970s, and many developing countries eliminated capital controls in the 1980s and 1990s. 300 The result of liberalized trade and capital movements for the United States has been a rise of investment by U.S. companies abroad and an increase in corporate profits extracted from the rest of the world. 301
This investment abroad primarily involved a shift of manufacturing activity from industrialized countries to developing countries, with a significant number of U.S. companies moving off shore. 302 U.S. multinational firms then exported much of this production back to the United States. The incentives behind these machinations are obvious. Corporations can extract significant concessions from American labor by threatening to move production facilities abroad. Further, corporations can avoid corporate taxes by moving to lower tax locations.
The motivations for these moves were distributional, yet the neoliberal economic theory insists that free trade is always efficient, and therefore invariably beneficial in the long run to the U.S. economy. Indeed, economic theory is clear that gains from trade only occur under specific assumptions. One such assumption is that no externalities exist. 303 For example, if the United States closes manufacturing facilities because it can import Chinese manufactured goods more cheaply, there may be no gain if the relocation of U.S. manufacturing firms harms other domestic firms and industries. Gary Pisano and Willy Shih of Harvard Business School make the case that clustered manufacturing such as in California’s Silicon Valley creates a complex web of collective R&D, engineering, and manufacturing that facilitates innovation. They argue that the offshoring of manufacturing necessarily leads to migration of R&D, suppliers, employee talent, and other complementary inputs. Pisano and Shih show how government policy is critically important to protect and nurture the “industrial commons” and the United States has reduced such support compared to other countries in the neoliberal era. 304
The Stolper–Samuelson Theorem in economics holds that trade will always involve absolute harm to some groups. 305 According to Harvard trade economist Dani Rodrik, “In a wealthy country such as the United States, these are likely to be unskilled workers such as high school dropouts. This renders the whole notion of ‘gains from trade’ suspect, since it is not at all clear how we can decide whether a country as a whole is better off when some people gain and others lose.” 306 The estimated gains from moving to full free trade are small, less than 1% of GDP. 307 Yet the impact on distribution can be many orders of magnitude larger. 308 Of course, there are many contributing factors to inequality. 309 However, Tim Noah estimates that “[t]rade with low-wage nations, which was negligible until the twenty-first century is responsible for 12 to 13 percent of the Great Divergence [rising inequality], and perhaps more.” 310 It is also questionable whether developing countries themselves are better off from free trade. Successful development has historically required industrial and tariff policies and the regulation of financial interests. 311
C. Financialization of the Economy
An important consequence of neoliberalism has been a financialization of the economy, reminiscent of that of the 1920s, but on a larger scale. No longer constrained by New Deal controls, the size, power, and profitability of the financial sector have grown to unprecedented proportions in the neoliberal era. 312 The share of the finance and insurance industry in GDP in the United States grew sharply after 1974, rising from approximately 4.5% to just below 9% by 2010. 313 Under the New Deal policy regime, nonfinancial corporate profits exceeded financial profits, whereas under neoliberalism this relationship was reversed. By 1985, the financial sector had greater profitability. 314 The two main contributing factors to this reversal were the growth of debt and the rise in interest rates. The real rate of interest under the Reagan Administration was 6.8% (compared to less than 2% in the 1970s) with a high of 8.7% in 1981. 315 The net debt (borrowing minus lending) of nonfinancial firms grew from 79% of GDP in 1952 to 192% of GDP in 2008. 316 As in the 1920s, financial interest engineered a booming stock market. As Duménil and Levy describe, “taking the first quarter of 1980 as 1, the New York Stock Exchange (NYSE) index peaked at 5.45 in the third quarter of 2000, prior to the crash in 2000–2001.” 317
1. Prerequisites for Financialization
Financialization could not have occurred without at least four important legal transformations: banking deregulation, lax merger enforcement, relaxation of labor protections, and the rise of the shareholder value doctrine in corporate law. Following sixty years of successful banking regulation, a series of regulatory changes lifted the traditional banking restrictions. Jill Hendrickson described the successive banking acts that unraveled the New Deal regulatory apparatus. 318 In 1980, Congress passed the Depository Institutions Deregulation and Monetary Control Act, which phased out Regulation Q and allowed banks to pay interest on demand accounts. The Depository Institutions Act of 1982, among other things, sanctioned certain cross state mergers by banks. The Competitive Equality in Banking Act of 1987 expanded the ability of banks to acquire nonhealthy banks across state lines. The Federal Deposit Insurance Corporation Improvement Act of 1991 initiated the process of removing the separation between investment and commercial banking for certain well-capitalized banks. The culmination of these deregulation processes was the passage in 1994 of the Neegle-Neal Interstate Banking and Branding Efficiency Act, removing restrictions on interstate banking and the 1999 wholesale repeal of the Glass–Stegall Act by the Gramm-Leach-Bliley Act in 1999. 319
Lax merger control also benefited financialization. The merger movements beginning in the 1980s were supported by debt, helping to push corporate leverage to historic highs. 320 The logic of the corporate takeover movement further demanded that nonfinancial firms keep their share values high. Firms turned to share buybacks, which exploded in the 1980s following the Securities and Exchange Commission (SEC) revision of 10b-18 in 1982. 321 Payment in the form of stock options to corporate directors and officers incentivized their focus on the stock market performance of the firm. 322 Moreover, banking consolidation increased the power of the banking sector. More than 6000 bank mergers 323 reviewed by both the Federal Reserve and the DOJ occurred between 1980 and 1994. 324 Carl Bogus has concluded after a review of the postmerger evidence on bank mergers that “researchers [are] divided on whether mergers between larger banks had no effect on efficiency whatsoever or whether mergers actually made banks less efficient, increasing their operating costs without improvements in service.” 325 Despite these facts, the antitrust agencies did not challenge any significant bank merger and ignored any concerns about too big to fail as irrelevant to their mission. 326
Finally, changes to the corporate law removed obstacles to hostile takeovers. Incumbent boards of directors opposed many takeovers. These directors could use a variety of mechanisms to prevent a takeover including use of the so-called poison pills. The Delaware Courts made an important policy choice by removing this obstacle under the justification of the shareholder value theory, the neoliberal theory that the sole purpose of the corporation is to increase shareholder value. Arguably, the critical decision supporting this viewpoint came in Revlon, Inc. v. MacAndrews & Forbes Holdings, Inc., 327 which held that the goal of the corporation is shareholder profit maximization and limited the ability of firms to prevent corporate raiders. 328
Finally, David Weil showed how pressure from the financial sector has led to new strategies to reduce the costs of wages, safety compliance, training, benefits, and other costs through a process he labeled “fissuring.” 329 Fissuring involves subcontracting subcategories of activities to other service providers who take responsibility for labor law compliance and wage setting. 330 For example, according to Weil, “[b]y 2000 an estimated 45% of janitors worked under contracting arrangements and more than 70% of guards were employed as contractors.” 331 As Weil demonstrated, the fissured workplace did not require new regulation so much as it required making enforcement of existing labor regulation impossible through defunding, 332 agency decisions, 333 and an inability to update legislation to address these issues. 334 Thus, several important legal transformations were necessary for the rise to economic dominance of the financial sector under neoliberalism.
2. The Impact of Financialization: Diversion of Profits to Finance
Figure 2 comes from a recent paper by Gérard Duménil and Dominique Levy in which they demonstrate that the primary effect of the process of financialization has been to divert profits away from productive uses by nonfinancial corporations. 335 As shown earlier, neoliberalism has led to an increase in profits, a result of lower wages and lax antitrust enforcement. The dark line on Figure 2 depicts the raise in corporate profits. However, these profits have been siphoned off to the high incomes of corporate executives and top-level managers, higher interest payments to support corporate debt, and dividends and share buybacks aimed at increasing the corporation’s stock value. The dotted line shows the remaining retained earnings, which are available for productive investment, innovation, and growth. In contrast to total profits, retained earnings declined in the 1970s and now hovers around zero.

Distributed profits (interests, dividends, and buybacks of stocks shares): (—) Retained profits: (-----).
Investment is highly correlated with retained earnings. 336 The low and falling retained earnings helps explain why neoliberal policies have resulted in falling rates of investment and declining growth. 337 In ironic contrast to the ostensible promises of trickledown theory of economic growth, neoliberal policies have been largely distributional in nature, reducing the income of the nonbusiness classes only to divert resources away from productive investment into the consumption of the wealthy.
D. An Assessment of Economic Performance under Neoliberalism
Neoliberalism and the free market were supposed to bring economic prosperity by removing the unnatural influences of government and labor unions. The combination was supposed to create the optimal incentives for efficiency. Ostensibly, the handsoff policy toward mergers would unleash the corporate dynamism and lead to greater growth and output. After four decades of such promises, the evidence shows that this new prosperity and dynamism is illusory. Compared with the Golden Age of Capitalism, the Age of Neoliberalism has turned in a dismal economic performance. Table 1 compares the two periods on a variety of economic measures: 338
Table 1 shows the superiority of economic performance in the golden age of capitalism under the New Deal policy regime. On average, GDP growth per year was more than a percentage point lower under neoliberalism than during the Golden Age. These levels of economic growth differences can have a massive impact on the ability of a society to increase the welfare of its citizens. Simultaneously, profits, wages, and productivity were higher in the golden age than under neoliberalism. The higher earlier growth rate created the ability to invest more and reduce unemployment. Finally, neoliberalism has significantly heightened the income and wealth inequality, which is the root cause of many of our present social ills. 340
Economic Performance in the Golden Age and Under Neoliberalism. 338
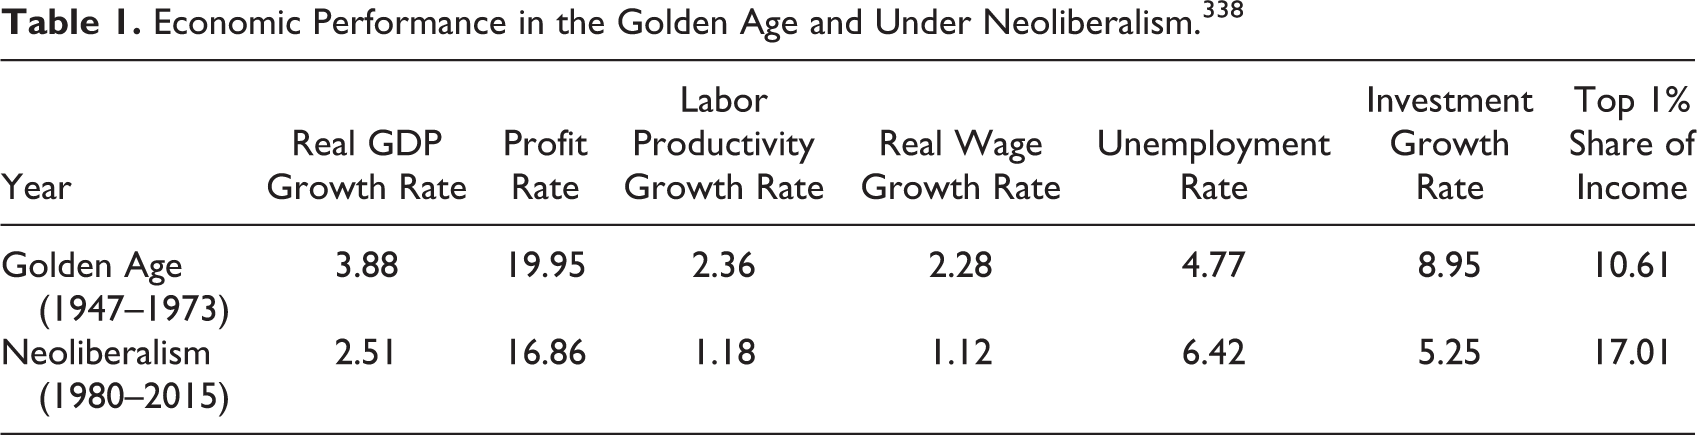
Neoliberalism also delivered the Great Recession of 2008, the worst crisis since the Great Depression. However, it is significant that the Great Recession was contained, but not without great cost. This important improvement shows that the institutions that control the macroeconomy have become more effective since 1929. I leave as an open question whether neoliberalism has contributed to this improvement or rather whether it predated its rise to ideological dominance.
Finally, one cannot simply attribute the stronger performance in the golden age of capitalism to greater U.S. world domination following World War II. At the end of the war, the Marshall Plan transferred $13 billion in U.S. grants (about 5% of GDP in 1948) to rebuild Europe. There was comparatively little international trade, and the United States opened its markets to European exports on very favorable terms in order to facilitate American political goals. 341 Thus, the root cause of the superiority of the golden age of capitalism lies elsewhere.
VIII. Conclusion
Antitrust has a long and storied history. What I have tried to demonstrate in this article is that antitrust history is intimately connected to both economic history and the policies and ideologies attendant to economic history. This is contrary to a common perception that antitrust proceeds in a linear fashion by simply incorporating the theoretical and empirical findings of the economics profession. This linear approach does not accurately reflect how antitrust really evolved. Antitrust policy has changed relatively quickly in response to important economic upheavals such as the Great Depression or the crisis of the 1970s. The rise of the Chicago School had little to do with the brilliance of its participants and much more to do with the ideological policy shift from the New Deal policy structure to the rise of neoliberalism. However, policy also has consequences. The evidence shows that the New Deal policy regime resulted in superior economic performance and that neoliberalism that followed it has so far been a failure.
Footnotes
Appendix 1. Historical Data for the United States. a
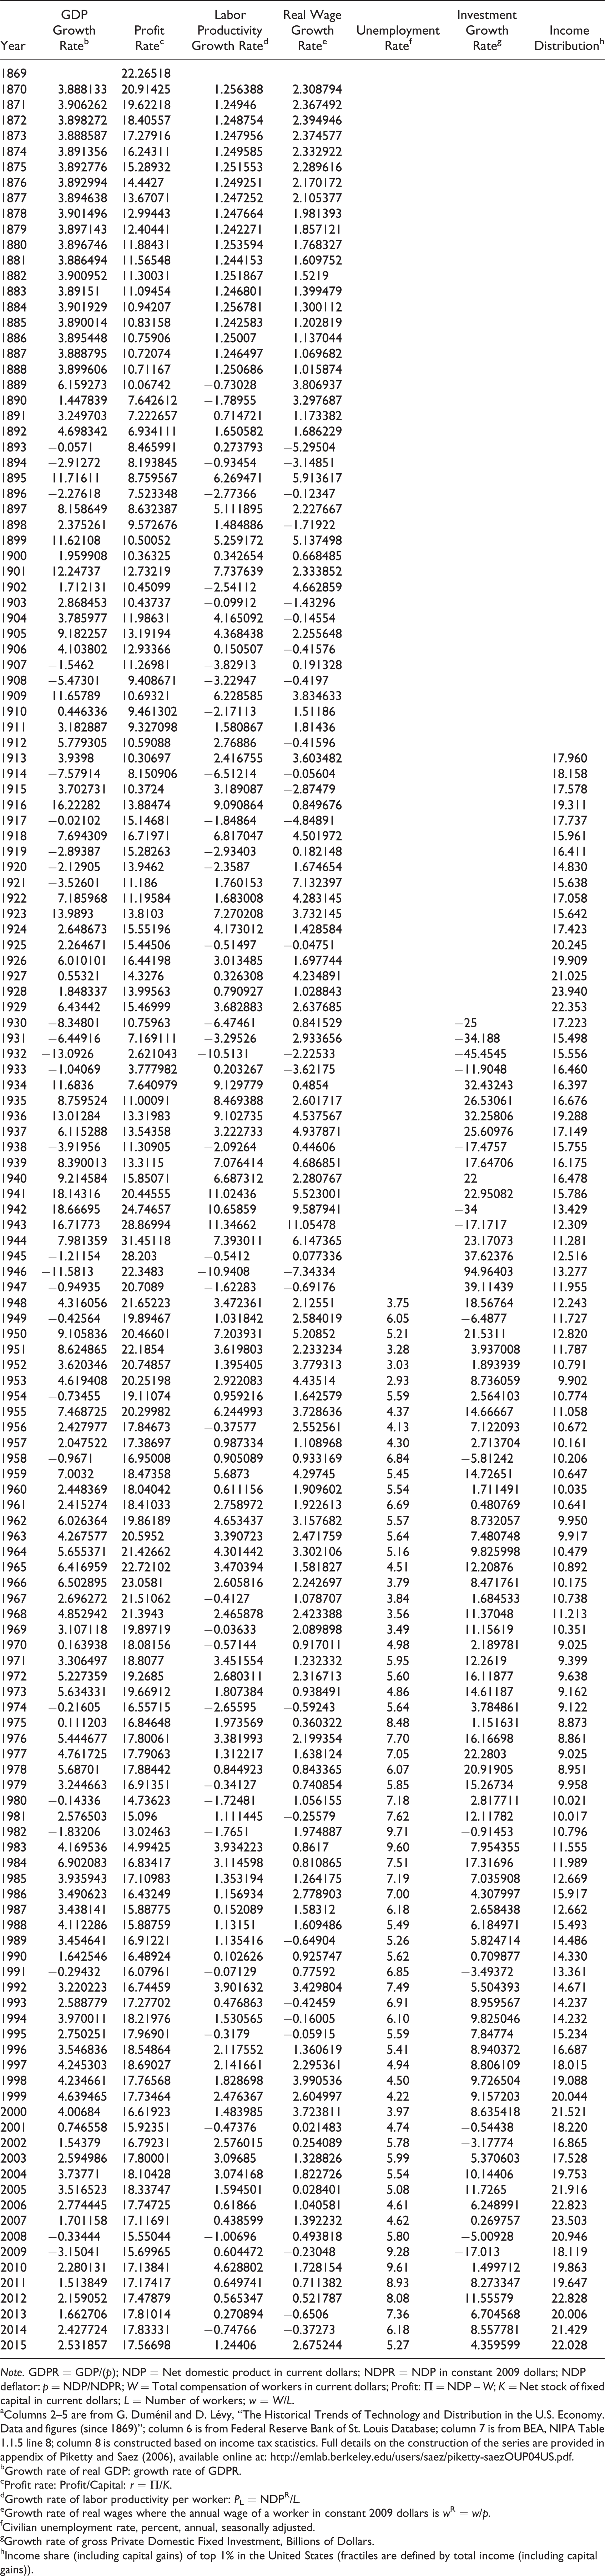
| Year | GDP Growth Rateb | Profit Ratec | Labor Productivity Growth Rated | Real Wage Growth Ratee | Unemployment Ratef | Investment Growth Rateg | Income Distributionh |
|---|---|---|---|---|---|---|---|
| 1869 | 22.26518 | ||||||
| 1870 | 3.888133 | 20.91425 | 1.256388 | 2.308794 | |||
| 1871 | 3.906262 | 19.62218 | 1.24946 | 2.367492 | |||
| 1872 | 3.898272 | 18.40557 | 1.248754 | 2.394946 | |||
| 1873 | 3.888587 | 17.27916 | 1.247956 | 2.374577 | |||
| 1874 | 3.891356 | 16.24311 | 1.249585 | 2.332922 | |||
| 1875 | 3.892776 | 15.28932 | 1.251553 | 2.289616 | |||
| 1876 | 3.892994 | 14.4427 | 1.249251 | 2.170172 | |||
| 1877 | 3.894638 | 13.67071 | 1.247252 | 2.105377 | |||
| 1878 | 3.901496 | 12.99443 | 1.247664 | 1.981393 | |||
| 1879 | 3.897143 | 12.40441 | 1.242271 | 1.857121 | |||
| 1880 | 3.896746 | 11.88431 | 1.253594 | 1.768327 | |||
| 1881 | 3.886494 | 11.56548 | 1.244153 | 1.609752 | |||
| 1882 | 3.900952 | 11.30031 | 1.251867 | 1.5219 | |||
| 1883 | 3.89151 | 11.09454 | 1.246801 | 1.399479 | |||
| 1884 | 3.901929 | 10.94207 | 1.256781 | 1.300112 | |||
| 1885 | 3.890014 | 10.83158 | 1.242583 | 1.202819 | |||
| 1886 | 3.895448 | 10.75906 | 1.25007 | 1.137044 | |||
| 1887 | 3.888795 | 10.72074 | 1.246497 | 1.069682 | |||
| 1888 | 3.899606 | 10.71167 | 1.250686 | 1.015874 | |||
| 1889 | 6.159273 | 10.06742 | −0.73028 | 3.806937 | |||
| 1890 | 1.447839 | 7.642612 | −1.78955 | 3.297687 | |||
| 1891 | 3.249703 | 7.222657 | 0.714721 | 1.173382 | |||
| 1892 | 4.698342 | 6.934111 | 1.650582 | 1.686229 | |||
| 1893 | −0.0571 | 8.465991 | 0.273793 | −5.29504 | |||
| 1894 | −2.91272 | 8.193845 | −0.93454 | −3.14851 | |||
| 1895 | 11.71611 | 8.759567 | 6.269471 | 5.913617 | |||
| 1896 | −2.27618 | 7.523348 | −2.77366 | −0.12347 | |||
| 1897 | 8.158649 | 8.632387 | 5.111895 | 2.227667 | |||
| 1898 | 2.375261 | 9.572676 | 1.484886 | −1.71922 | |||
| 1899 | 11.62108 | 10.50052 | 5.259172 | 5.137498 | |||
| 1900 | 1.959908 | 10.36325 | 0.342654 | 0.668485 | |||
| 1901 | 12.24737 | 12.73219 | 7.737639 | 2.333852 | |||
| 1902 | 1.712131 | 10.45099 | −2.54112 | 4.662859 | |||
| 1903 | 2.868453 | 10.43737 | −0.09912 | −1.43296 | |||
| 1904 | 3.785977 | 11.98631 | 4.165092 | −0.14554 | |||
| 1905 | 9.182257 | 13.19194 | 4.368438 | 2.255648 | |||
| 1906 | 4.103802 | 12.93366 | 0.150507 | −0.41576 | |||
| 1907 | −1.5462 | 11.26981 | −3.82913 | 0.191328 | |||
| 1908 | −5.47301 | 9.408671 | −3.22947 | −0.4197 | |||
| 1909 | 11.65789 | 10.69321 | 6.228585 | 3.834633 | |||
| 1910 | 0.446336 | 9.461302 | −2.17113 | 1.51186 | |||
| 1911 | 3.182887 | 9.327098 | 1.580867 | 1.81436 | |||
| 1912 | 5.779305 | 10.59088 | 2.76886 | −0.41596 | |||
| 1913 | 3.9398 | 10.30697 | 2.416755 | 3.603482 | 17.960 | ||
| 1914 | −7.57914 | 8.150906 | −6.51214 | −0.05604 | 18.158 | ||
| 1915 | 3.702731 | 10.3724 | 3.189087 | −2.87479 | 17.578 | ||
| 1916 | 16.22282 | 13.88474 | 9.090864 | 0.849676 | 19.311 | ||
| 1917 | −0.02102 | 15.14681 | −1.84864 | −4.84891 | 17.737 | ||
| 1918 | 7.694309 | 16.71971 | 6.817047 | 4.501972 | 15.961 | ||
| 1919 | −2.89387 | 15.28263 | −2.93403 | 0.182148 | 16.411 | ||
| 1920 | −2.12905 | 13.9462 | −2.3587 | 1.674654 | 14.830 | ||
| 1921 | −3.52601 | 11.186 | 1.760153 | 7.132397 | 15.638 | ||
| 1922 | 7.185968 | 11.19584 | 1.683008 | 4.283145 | 17.058 | ||
| 1923 | 13.9893 | 13.8103 | 7.270208 | 3.732145 | 15.642 | ||
| 1924 | 2.648673 | 15.55196 | 4.173012 | 1.428584 | 17.423 | ||
| 1925 | 2.264671 | 15.44506 | −0.51497 | −0.04751 | 20.245 | ||
| 1926 | 6.010101 | 16.44198 | 3.013485 | 1.697744 | 19.909 | ||
| 1927 | 0.55321 | 14.3276 | 0.326308 | 4.234891 | 21.025 | ||
| 1928 | 1.848337 | 13.99563 | 0.790927 | 1.028843 | 23.940 | ||
| 1929 | 6.43442 | 15.46999 | 3.682883 | 2.637685 | 22.353 | ||
| 1930 | −8.34801 | 10.75963 | −6.47461 | 0.841529 | −25 | 17.223 | |
| 1931 | −6.44916 | 7.169111 | −3.29526 | 2.933656 | −34.188 | 15.498 | |
| 1932 | −13.0926 | 2.621043 | −10.5131 | −2.22533 | −45.4545 | 15.556 | |
| 1933 | −1.04069 | 3.777982 | 0.203267 | −3.62175 | −11.9048 | 16.460 | |
| 1934 | 11.6836 | 7.640979 | 9.129779 | 0.4854 | 32.43243 | 16.397 | |
| 1935 | 8.759524 | 11.00091 | 8.469388 | 2.601717 | 26.53061 | 16.676 | |
| 1936 | 13.01284 | 13.31983 | 9.102735 | 4.537567 | 32.25806 | 19.288 | |
| 1937 | 6.115288 | 13.54358 | 3.222733 | 4.937871 | 25.60976 | 17.149 | |
| 1938 | −3.91956 | 11.30905 | −2.09264 | 0.44606 | −17.4757 | 15.755 | |
| 1939 | 8.390013 | 13.3115 | 7.076414 | 4.686851 | 17.64706 | 16.175 | |
| 1940 | 9.214584 | 15.85071 | 6.687312 | 2.280767 | 22 | 16.478 | |
| 1941 | 18.14316 | 20.44555 | 11.02436 | 5.523001 | 22.95082 | 15.786 | |
| 1942 | 18.66695 | 24.74657 | 10.65859 | 9.587941 | −34 | 13.429 | |
| 1943 | 16.71773 | 28.86994 | 11.34662 | 11.05478 | −17.1717 | 12.309 | |
| 1944 | 7.981359 | 31.45118 | 7.393011 | 6.147365 | 23.17073 | 11.281 | |
| 1945 | −1.21154 | 28.203 | −0.5412 | 0.077336 | 37.62376 | 12.516 | |
| 1946 | −11.5813 | 22.3483 | −10.9408 | −7.34334 | 94.96403 | 13.277 | |
| 1947 | −0.94935 | 20.7089 | −1.62283 | −0.69176 | 39.11439 | 11.955 | |
| 1948 | 4.316056 | 21.65223 | 3.472361 | 2.12551 | 3.75 | 18.56764 | 12.243 |
| 1949 | −0.42564 | 19.89467 | 1.031842 | 2.584019 | 6.05 | −6.4877 | 11.727 |
| 1950 | 9.105836 | 20.46601 | 7.203931 | 5.20852 | 5.21 | 21.5311 | 12.820 |
| 1951 | 8.624865 | 22.1854 | 3.619803 | 2.233234 | 3.28 | 3.937008 | 11.787 |
| 1952 | 3.620346 | 20.74857 | 1.395405 | 3.779313 | 3.03 | 1.893939 | 10.791 |
| 1953 | 4.619408 | 20.25198 | 2.922083 | 4.43514 | 2.93 | 8.736059 | 9.902 |
| 1954 | −0.73455 | 19.11074 | 0.959216 | 1.642579 | 5.59 | 2.564103 | 10.774 |
| 1955 | 7.468725 | 20.29982 | 6.244993 | 3.728636 | 4.37 | 14.66667 | 11.058 |
| 1956 | 2.427977 | 17.84673 | −0.37577 | 2.552561 | 4.13 | 7.122093 | 10.672 |
| 1957 | 2.047522 | 17.38697 | 0.987334 | 1.108968 | 4.30 | 2.713704 | 10.161 |
| 1958 | −0.9671 | 16.95008 | 0.905089 | 0.933169 | 6.84 | −5.81242 | 10.206 |
| 1959 | 7.0032 | 18.47358 | 5.6873 | 4.29745 | 5.45 | 14.72651 | 10.647 |
| 1960 | 2.448369 | 18.04042 | 0.611156 | 1.909602 | 5.54 | 1.711491 | 10.035 |
| 1961 | 2.415274 | 18.41033 | 2.758972 | 1.922613 | 6.69 | 0.480769 | 10.641 |
| 1962 | 6.026364 | 19.86189 | 4.653437 | 3.157682 | 5.57 | 8.732057 | 9.950 |
| 1963 | 4.267577 | 20.5952 | 3.390723 | 2.471759 | 5.64 | 7.480748 | 9.917 |
| 1964 | 5.655371 | 21.42662 | 4.301442 | 3.302106 | 5.16 | 9.825998 | 10.479 |
| 1965 | 6.416959 | 22.72102 | 3.470394 | 1.581827 | 4.51 | 12.20876 | 10.892 |
| 1966 | 6.502895 | 23.0581 | 2.605816 | 2.242697 | 3.79 | 8.471761 | 10.175 |
| 1967 | 2.696272 | 21.51062 | −0.4127 | 1.078707 | 3.84 | 1.684533 | 10.738 |
| 1968 | 4.852942 | 21.3943 | 2.465878 | 2.423388 | 3.56 | 11.37048 | 11.213 |
| 1969 | 3.107118 | 19.89719 | −0.03633 | 2.089898 | 3.49 | 11.15619 | 10.351 |
| 1970 | 0.163938 | 18.08156 | −0.57144 | 0.917011 | 4.98 | 2.189781 | 9.025 |
| 1971 | 3.306497 | 18.8077 | 3.451554 | 1.232332 | 5.95 | 12.2619 | 9.399 |
| 1972 | 5.227359 | 19.2685 | 2.680311 | 2.316713 | 5.60 | 16.11877 | 9.638 |
| 1973 | 5.634331 | 19.66912 | 1.807384 | 0.938491 | 4.86 | 14.61187 | 9.162 |
| 1974 | −0.21605 | 16.55715 | −2.65595 | −0.59243 | 5.64 | 3.784861 | 9.122 |
| 1975 | 0.111203 | 16.84648 | 1.973569 | 0.360322 | 8.48 | 1.151631 | 8.873 |
| 1976 | 5.444677 | 17.80061 | 3.381993 | 2.199354 | 7.70 | 16.16698 | 8.861 |
| 1977 | 4.761725 | 17.79063 | 1.312217 | 1.638124 | 7.05 | 22.2803 | 9.025 |
| 1978 | 5.68701 | 17.88442 | 0.844923 | 0.843365 | 6.07 | 20.91905 | 8.951 |
| 1979 | 3.244663 | 16.91351 | −0.34127 | 0.740854 | 5.85 | 15.26734 | 9.958 |
| 1980 | −0.14336 | 14.73623 | −1.72481 | 1.056155 | 7.18 | 2.817711 | 10.021 |
| 1981 | 2.576503 | 15.096 | 1.111445 | −0.25579 | 7.62 | 12.11782 | 10.017 |
| 1982 | −1.83206 | 13.02463 | −1.7651 | 1.974887 | 9.71 | −0.91453 | 10.796 |
| 1983 | 4.169536 | 14.99425 | 3.934223 | 0.8617 | 9.60 | 7.954355 | 11.555 |
| 1984 | 6.902083 | 16.83417 | 3.114598 | 0.810865 | 7.51 | 17.31696 | 11.989 |
| 1985 | 3.935943 | 17.10983 | 1.353194 | 1.264175 | 7.19 | 7.035908 | 12.669 |
| 1986 | 3.490623 | 16.43249 | 1.156934 | 2.778903 | 7.00 | 4.307997 | 15.917 |
| 1987 | 3.438141 | 15.88775 | 0.152089 | 1.58312 | 6.18 | 2.658438 | 12.662 |
| 1988 | 4.112286 | 15.88759 | 1.13151 | 1.609486 | 5.49 | 6.184971 | 15.493 |
| 1989 | 3.454641 | 16.91221 | 1.135416 | −0.64904 | 5.26 | 5.824714 | 14.486 |
| 1990 | 1.642546 | 16.48924 | 0.102626 | 0.925747 | 5.62 | 0.709877 | 14.330 |
| 1991 | −0.29432 | 16.07961 | −0.07129 | 0.77592 | 6.85 | −3.49372 | 13.361 |
| 1992 | 3.220223 | 16.74459 | 3.901632 | 3.429804 | 7.49 | 5.504393 | 14.671 |
| 1993 | 2.588779 | 17.27702 | 0.476863 | −0.42459 | 6.91 | 8.959567 | 14.237 |
| 1994 | 3.970011 | 18.21976 | 1.530565 | −0.16005 | 6.10 | 9.825046 | 14.232 |
| 1995 | 2.750251 | 17.96901 | −0.3179 | −0.05915 | 5.59 | 7.84774 | 15.234 |
| 1996 | 3.546836 | 18.54864 | 2.117552 | 1.360619 | 5.41 | 8.940372 | 16.687 |
| 1997 | 4.245303 | 18.69027 | 2.141661 | 2.295361 | 4.94 | 8.806109 | 18.015 |
| 1998 | 4.234661 | 17.76568 | 1.828698 | 3.990536 | 4.50 | 9.726504 | 19.088 |
| 1999 | 4.639465 | 17.73464 | 2.476367 | 2.604997 | 4.22 | 9.157203 | 20.044 |
| 2000 | 4.00684 | 16.61923 | 1.483985 | 3.723811 | 3.97 | 8.635418 | 21.521 |
| 2001 | 0.746558 | 15.92351 | −0.47376 | 0.021483 | 4.74 | −0.54438 | 18.220 |
| 2002 | 1.54379 | 16.79231 | 2.576015 | 0.254089 | 5.78 | −3.17774 | 16.865 |
| 2003 | 2.594986 | 17.80001 | 3.09685 | 1.328826 | 5.99 | 5.370603 | 17.528 |
| 2004 | 3.73771 | 18.10428 | 3.074168 | 1.822726 | 5.54 | 10.14406 | 19.753 |
| 2005 | 3.516523 | 18.33747 | 1.594501 | 0.028401 | 5.08 | 11.7265 | 21.916 |
| 2006 | 2.774445 | 17.74725 | 0.61866 | 1.040581 | 4.61 | 6.248991 | 22.823 |
| 2007 | 1.701158 | 17.11691 | 0.438599 | 1.392232 | 4.62 | 0.269757 | 23.503 |
| 2008 | −0.33444 | 15.55044 | −1.00696 | 0.493818 | 5.80 | −5.00928 | 20.946 |
| 2009 | −3.15041 | 15.69965 | 0.604472 | −0.23048 | 9.28 | −17.013 | 18.119 |
| 2010 | 2.280131 | 17.13841 | 4.628802 | 1.728154 | 9.61 | 1.499712 | 19.863 |
| 2011 | 1.513849 | 17.17417 | 0.649741 | 0.711382 | 8.93 | 8.273347 | 19.647 |
| 2012 | 2.159052 | 17.47879 | 0.565347 | 0.521787 | 8.08 | 11.55579 | 22.828 |
| 2013 | 1.662706 | 17.81014 | 0.270894 | −0.6506 | 7.36 | 6.704568 | 20.006 |
| 2014 | 2.427724 | 17.83331 | −0.74766 | −0.37273 | 6.18 | 8.557781 | 21.429 |
| 2015 | 2.531857 | 17.56698 | 1.24406 | 2.675244 | 5.27 | 4.359599 | 22.028 |
Note. GDPR = GDP/(p); NDP = Net domestic product in current dollars; NDPR = NDP in constant 2009 dollars; NDP deflator: p = NDP/NDPR; W = Total compensation of workers in current dollars; Profit: Π = NDP – W; K = Net stock of fixed capital in current dollars; L = Number of workers; w = W/L.
aColumns 2–5 are from G. Duménil and D. Lévy, “The Historical Trends of Technology and Distribution in the U.S. Economy. Data and figures (since 1869)”; column 6 is from Federal Reserve Bank of St. Louis Database; column 7 is from BEA, NIPA Table 1.1.5 line 8; column 8 is constructed based on income tax statistics. Full details on the construction of the series are provided in appendix of Piketty and Saez (2006), available online at: http://emlab.berkeley.edu/users/saez/piketty-saezOUP04US.pdf.
bGrowth rate of real GDP: growth rate of GDPR.
cProfit rate: Profit/Capital: r = Π/K.
dGrowth rate of labor productivity per worker: PL = NDPR/L.
eGrowth rate of real wages where the annual wage of a worker in constant 2009 dollars is wR = w/p.
fCivilian unemployment rate, percent, annual, seasonally adjusted.
gGrowth rate of gross Private Domestic Fixed Investment, Billions of Dollars.
hIncome share (including capital gains) of top 1% in the United States (fractiles are defined by total income (including capital gains)).
Acknowledgments
The author would like to thank members of the University of Utah Competition Group, Catherine Ruetschlin, Marshall Steinbaum, and Ted Tatos for their help and input. The author also benefited from suggestions and guidance from Gérard Duménil’s 2019 seminar on economic history at the University of Utah. Doguhan Sundal provided valuable assistance on historical data sources. The author also benefited from comments by Tom Ferguson. Brandi Chase also provided assistance in preparing the final paper.
Declaration of Conflicting Interests
The author(s) declared no potential conflicts of interest with respect to the research, authorship, and/or publication of this article.
Funding
The author(s) received no financial support for the research, authorship, and/or publication of this article.