



Abstract
This article examines how well the Kinder, Lydenberg, Domini Research & Analytics (KLD) ratings measure past corporate social performance and predict future corporate social performance in Diversity and Governance categories. The results show that the KLD ratings effectively measure (past) and predict (future) social performance in both categories. The results also suggest that the KLD ratings may identify differences in the quality of management and firm which can affect future social performance and is not entirely explained by past social performance. The findings of this study lend some support for empirical studies relying on the KLD ratings to operationalize corporate social performance. The findings suggest that users of the ratings need to have a clear understanding of what information they are seeking from the KLD ratings in order to maximize the utility of these ratings.
Corporate social performance (CSP) has received increasing attention as both an antecedent and a consequence of corporate actions (Deckop, Merriman, & Gupta, 2006; Griffin & Mahon, 1997; Mahoney & Thron, 2006; Margolis & Walsh, 2003; Waddock & Graves, 1997). However, as in all burgeoning fields of research, CSP-related research suffers from several limitations (Rowley & Berman, 2000). One limitation is whether currently used measures of CSP effectively measure the intended construct. Currently, the most popular measure of CSP is the Kinder, Lydenberg, Domini Research & Analytics (KLD) social ratings for practitioners and academics alike. Influential socially responsible investment (SRI) funds rely on the KLD social ratings to construct portfolios (e.g., TIAA-CREF). 1 Prestigious academic journals have accepted papers using the KLD ratings. For example, by the author’s direct count, the Strategic Management Journal has accepted 13 articles since 1999, and the Academy of Management Journal has accepted 5 articles since 1994. (The author searched for articles in those journals, and the counts here are his report.)
Despite the popularity of the KLD ratings, few attempts have been made to evaluate their effectiveness as a measure of CSP. Two highly cited studies on this subject are Sharfman (1996) and Mattingly and Berman (2006). Sharfman examined correlations between aggregated measures of KLD ratings and Fortune’s Reputation scores to examine convergent validity. Mattingly and Berman found that the six KLD categories can be classified into four distinct concepts of corporate social action. While these studies provide critical information about the KLD ratings, they did not examine the accuracy of individual rating items making up the KLD categories. (Accuracy concerns how well or effectively the KLD individual ratings measure the construct they claim to measure.) If researchers do not know accuracy of these items that make up the KLD categories, aggregating and categorizing them may provide only partially useful information. Recently, in an attempt to evaluate the accuracy of individual KLD rating items, Chatterji, Levine, and Toffel (2009) evaluated rating items in the KLD Environment category by examining the backward- and forward-looking ability of individual KLD Environment rating items. They found that those rating items effectively measure (past) and predict (future) environmental performance information provided by another independent database on corporate environmental performance. Despite the Chatterji et al. effort, KLD ratings in the categories other than Environment remain unexamined. As an attempt to evaluate the accuracy of individual rating items in other KLD categories, the author examines the backward- and forward-looking ability of individual rating items in KLD’s Diversity and Governance categories.
The author chose Diversity and Governance categories because of their theoretical and practical significance, as well as availability of the alternative publicly available and well-recognized data sources, against which to compare the KLD ratings. The alternative data sources must be publicly available in order to enable replication of the results and well-recognized to be credible, both of which the author considers very critical conditions for a measurement evaluation study. Restated, the main objective of this study is to evaluate the backward- and forward-looking ability of the KLD ratings in Diversity and Governance categories. The remainder of this article is organized as follows. The next section explains why an ideal measure of social performance needs backward- and forward-looking ability and explains the theoretical and practical significance of the Diversity and Governance categories. The subsequent section describes the research questions and empirical models. The next section explains the data. The subsequent section presents the evaluation results. The final section discusses the findings and offers some conclusions.
Backward- and Forward-Looking Ability of the KLD Diversity and Governance Categories
The central research question of this article is to evaluate the backward- and forward-looking ability of individual rating items in the KLD’s Diversity and Governance categories. This section offers some explanations as to why those abilities are relevant and important criteria in assessing the effectiveness of the KLD ratings.
Importance of Backward- and Forward-Looking Ability of a CSP Rating
First, backward-looking ability provides important information to investors and other stakeholders who rely on the KLD ratings because they are interested in knowing how well a CSP rating can measure past social performance. Rosen, Sandler, and Shani (1991) explain that some investors and other stakeholders care about the past social performance of a firm because they want to ensure that the firm’s good present financial performance is not attributable to unethical behavior from the past. Such “deontological” investors do not want to invest in firms that act irresponsibly toward the environment and society because they consider it unethical to earn profit from socially irresponsible firms (Chatterji et al., 2009). Another group of investors and other stakeholders would be similarly interested in the ability of a CSP rating to measure past social performance because such “consequentialist” investors use their investments as an instrument to promote socially responsible behavior of firms (TIAA-CREF, 2009). By investing selectively in socially responsible firms, consequentialists intend to lower the cost of capital for socially responsible firms, and thus promote social responsibility among firms.
Even purely financial profit-oriented stakeholders would be interested in the backward-looking ability, given that a strong past CSP means better financial performance. A recent view on CSP emphasizes the importance of CSP as an insurance mechanism (Godfrey, 2005; Godfrey, Merrill, & Hansen, 2009). This view suggests that strong past CSP creates a form of moral capital for the firm that works as insurance-like protection against possible negative events, and thereby lowers the overall amount of risk in firm performance. Therefore, if the CSP rating can effectively measure past social performance, and thus the level of moral capital accumulated by the firm, stakeholders with a purely financial profit orientation would also be interested in the backward-looking ability of the CSP rating.
Scholars conducting empirical research using CSP ratings would be interested in the backward-looking ability of CSP ratings, as well. Most, if not all empirical research on CSP uses CSP ratings (e.g., KLD ratings) as measures that capture the past social performance of firms (e.g., Berman, Wicks, Kotha, & Jones, 1999; Graves & Waddock, 1994; Hillman & Keim, 2001; McGuire, Dow, & Argheyd, 2003; Waddock & Graves, 1997). Therefore, unless the CSP ratings effectively measure the past social performance of firms, many empirical studies that relied on CSP ratings may lose their validity.
Second, stakeholders and scholars would also be interested in how well CSP ratings can predict future firm social performance (forward-looking ability). If a high CSP rating means better social performance in the future, both deontological and consequentialist stakeholders would find the information from the CSP rating instrumental in guiding their decisions: High CSP ratings imply that a firm will continue to do business in a responsible manner in the future. Also, purely financial profit-oriented stakeholders would be interested in the predictability of CSP ratings if better future social performance means superior future financial performance (Waddock & Graves, 1997). Lastly, scholars conducting empirical research have used CSP ratings as measures reflecting both the level of past and future social performance (e.g., Godfrey et al., 2009; Kacperczyk, 2009). Therefore, empirical scholars would be interested in the future-predicting ability of CSP ratings as well, particularly if they are considering CSP ratings as variables that capture the level of firms’ commitment to social issues in the future.
Significance of Workforce Diversity and Governance for Firms and Stakeholders
Diversity in the workforce can affect firm performance in a number of ways. First, workforce diversity lowers employee turnover rates and absenteeism, and thereby lowers labor costs (Cox & Blake, 1991; Robinson & Dechant, 1997; Thomas & Ely, 1996). High turnover rates among women and minorities have been a costly problem for many U.S. companies. For example, in the past when the corporate workforce was dominated by white male employees, the turnover rate for blacks was 40% higher than the rate for whites, and turnover among women was twice as high as for men (Schwartz, 1989). However, an increase in workforce diversity has effectively lowered such high turnover rates among female and minority employees by improving workplace interaction and social relationships for female and minority employees (Cox & Blake, 1991; Robinson & Dechant, 1997; Thomas & Ely, 1996). Also, diversity at the board and upper management can lower turnover rates and can increase employee commitment to the firm by signaling to women and minority groups that they are not excluded from the high positions within the firm (Wong & Clift, 2009)
Second, workforce diversity enhances the ability of a firm to attract the most talented applicants from a larger labor pool (Avery, 2003; Robinson & Dechant, 1997; Slaughter, Sinar, & Bachiochi, 2002; Thomas & Ely, 1996; Young, Place, Rinehart, Jury, & Baits, 1997). Therefore, firms with a diverse workforce (including the upper management and board) incur lower employee searching costs and are able to attract a larger group of talented job applicants. In addition to promoting job applications by women and minorities, diversity in the upper management team and board has been shown to promote internal competition among managers and employees because it signals meritocracy (Wong & Clift, 2009).
Third, diversity in the workplace leads to an increase in the variety of perspectives brought to a problem, to opportunities for synergistic knowledge and information sharing, and to greater creativity and problem-solving ability (Cox, Lobel, & McLeod, 1991; Johnson & Packer, 1987; Mannix & Neale, 2005; Watson, Kumar, & Michaelsen, 1993). Certain knowledge, information, beliefs, and cognitive differences tend to vary systematically with demographic variables such as age, ethnicity, and gender (Robinson & Dechant, 1997). Such a benefit of diversity has been observed in the upper management and board level, as well. For example, Selby (2000) maintains that a diverse board promotes a “questioning culture” of the board, thereby contributing to monitoring and problem-solving ability of the board. Also, it has been reported that female senior managers are more open to new ideas and business approaches than their male counterparts, thus improving the problem-solving ability of the group to which they belong (Bilimoria & Wheeler, 2000). In sum, a diverse workforce can create competitive advantage for a firm by creating cost savings from a low turnover rate and absenteeism, attracting a larger group of talented future employees, and enhancing its workforce creativity, commitment, and productivity.
Strong corporate governance and transparency also contribute to the competitive advantage of a firm, and thus stakeholders and shareholders have great interest in evaluating them accurately. As the cases of Enron, Worldcom, Adelphia, and others demonstrate, strong corporate governance is vital for a company's survival, and for the well-being of its stakeholders. A number of finance and accounting studies have found that strong corporate governance has positive impacts on stock price, numerous profit figures, risk-adjusted returns, and other measures of both short-term and long-term firm performance (Brown & Caylor, 2006; Core, Holthausen, & Larcker, 1999; Gompers, Ishii, & Metrick, 2003). In contrast, firms weak in corporate governance and having a low level of transparency represent increased investment risk, resulting in a higher cost of capital, greater agency problems, and weaker financial performance (Brown & Caylor, 2006; Core et al., 1999; Gompers et al., 2003).
The growing importance of corporate governance and transparency is well reflected in a series of recent regulatory changes in the United States. For example, the Sarbanes-Oxley Act of 2002 was motivated by increased public concern for corporate governance (Brynes, Dwyer, Henry, & Thornton, 2003). More recently, in 2009, the Obama Administration announced a sweeping regulatory overhaul aimed at improving government monitoring of corporate governance. In addition, the U.S. Securities and Exchange Commission has issued proposals that would require greater transparency and enhance proxy disclosure and solicitation (Directorship, 2009).
Considering that workforce diversity and corporate governance are important parts of CSP, stakeholders would like to understand how well firms are doing in those areas. Given that both social performance categories consist of multiple dimensions, stakeholders who do not have enough resources to examine the multiple dimensions of social performance often rely on readily available CSP ratings, such as the KLD ratings. Therefore, stakeholders would be interested in the true ability of the CSP rating that claims to measure the level of workforce diversity and corporate governance of the firm.
Research Questions and Empirical Models
This section explains the three research questions concerning the back-looking ability, forward-looking ability, and identification ability of firm characteristics affecting future social performance. The section also explains the empirical model associated with each research question.
Question 1. Do KLD diversity and governance ratings have a backward-looking ability?
To assess whether the KLD Diversity and Governance ratings effectively measure firms’ past diversity and governance performance data, the author estimates the following equation. The statistically significant and positive coefficient (β1) in this equation suggests that KLD ratings effectively measure past social performance.

Question 2. Do KLD diversity and governance ratings have a forward-looking ability?
The second research question assesses the extent to which the KLD ratings predict future CSP data in diversity and governance. To understand this ability, the author estimates the following equation. The statistically significant and positive coefficient (β1) in this equation suggests that KLD ratings effectively predict future social performance.

In one of the earliest studies on construct validity, Cronbach and Meehl (1955) explained that predictive validity, a major component of construct validity, can be established by examining the correlation between two independent measures on the same construct, measured at different times. More recently, scholars have preferred the regression-based test of predictive validity, where a measure is regressed on another one, measured at a different time point (Bergkvist & Rossiter, 2007; Heather, Rollnick, & Bell, 1993; Herche, 1992; Sirgy et al., 1997; Van Dyne & LePine, 1998). 2 The major advantage of the regression-based test of predictive validity is that the regression-based test can account for other factors (i.e., control variables) that may cause spurious correlations. For example, Wetter et al. (1994, p. 806) explained that regression-based tests of predictive validity are “a conservative analytic strategy” and provide “a stringent test” of predictive validity because the predictive validity is assessed after controlling for other variables that may be correlated with the dependent variable. This circumstance suggests that the regression-based test of predictive validity is a superior method to assess predictive validity, compared to the correlation-based test proposed by Cronbach and Meehl (1955). The comparison here of the empirical specifications of the regression-based test of predictive validity and the forward-looking ability evaluation model shows that they are identical. Therefore, by establishing the forward-looking ability of the KLD ratings using the regression-based test of predictive validity, the author demonstrates that the KLD ratings have construct validity (predictive validity) as a measure of CSP.
The backward-looking ability model (Question 1) is a logical extension of this regression-based test of predictive validity (Question 2). If the independent variable effectively predicts the dependent variable (forward-looking ability), alternatively, it can be said that the dependent variable effectively reflects and summarizes the independent variable (backward-looking ability).
Question 3. Can KLD diversity and governance ratings identify firm characteristics affecting future social performance?
Lastly, the author assesses whether the KLD ratings have incremental predictive power beyond what is predicted by past diversity and governance performance data. To the extent that the KLD ratings are measuring management quality and firm characteristics that have not yet affected diversity and governance performance, the KLD ratings should have an incremental predictive power beyond what is predicted by past diversity and governance performance data (That is, what is explained by autocorrelation). To examine this question, the author estimated the same models as in Equation (2), but included as an additional control variable the dependent variable (diversity/governance performance measures) lagged one year (Chatterji et al., 2009; Keele & Kelly, 2006). The statistically significant and positive coefficient on the KLD rating (β1) in this equation suggests that KLD’s ratings reflect unobservable firm and management qualities that affect future social performance, qualities that are not reflected in past social performance data.

Data
This section explains the sources of data used for testing hypotheses. Data on four rating items came from two KLD categories for Diversity and Governance. Data on diversity and governance performance came from credible independent databases.
KLD Diversity and Governance Ratings
The author obtained data on four rating items of KLD’s Diversity and Governance categories (two from each category). 3 For the Diversity category, the author chose CEO Diversity and Board of Directors (BOD) Diversity for three reasons. First, diversity at the senior management level, such as a chief executive officer (CEO) and the board of directors, has a significant symbolic meaning to employees and a substantial impact on a firm’s financial performance (Richard, Barnett, Dwyer, & Chadwick, 2004). Second, although diversity at the employee level may provide at least equally useful information to stakeholders, KLD does not provide diversity information at the employee level in an explicit manner. Third, publicly available and well-recognized alternative data sources are available for CEO Diversity and BOD Diversity ratings for comparison. Alternative data sources must be publicly available in order to enable replication of the results and well-recognized to be credible. Veracity of proprietary, hand-collected data by an author cannot be easily verified, and analyses using such data hinder replication by third parties, both of which the author considered very critical issues for a measurement evaluation study, such as this article.
For the Governance category, the author picked Top Management Team (TMT) Compensation and Reporting Transparency for three reasons. First, TMT compensation is one of the most important aspects that signal the quality of corporate governance (Burba, 2005; Core et al., 1999; Larcker, Richardson, & Tuna, 2007). 4 Likewise, transparency in reporting or information disclosure provides valuable information to stakeholders, as well. A number of accounting studies have found that a high level of transparency in corporate information disclosure lowers the cost of capital and improves the financial performance of a firm (e.g., Francis, Khurana, & Pereira, 2005; Frankel, McNichols, & Wilson, 1995; Lang & Lundholm, 2000). Second, KLD does not provide information for other corporate governance issues, such as composition of the board of directors and ownership structures. Third, publicly available and well-recognized alternative data sources are available for TMT Compensation and Reporting Transparency for comparison. 5
Diversity and Governance Data from Other Independent Sources
Data on diversity and governance performance were obtained from credible independent databases that meet the two critical conditions of being publicly available and well-recognized in academia. First, CEO diversity information was obtained from Compustat’s Executive Compensation (Execucomp) database. The number of firm-year observations is 10,436. The period covers 1992 to 2008, and the number of firms included is 1,928. Second, BOD diversity information was obtained from the Investor Responsibility Research Center (IRRC) database. The IRRC database provides both gender and ethnicity information of the board members. The number of firm-year observations is 11,810. The period covers 1996 to 2007, and the number of firms included is 3,939. Third, TMT compensation information was collected from the Execucomp database, which provides total compensation information (e.g., bonus, salary, stock-based compensation, retirement plans, etc.) for each senior executive of a firm. Using these data, the author calculated the annual sum of the total TMT compensation. The number of firm-year observations is 12,780. The period covers 1992 to 2008, and the number of firms included is 1,946. Lastly, information on reporting transparency was collected from CorporateRegister.com, the world’s largest online database for CSP reporting. KLD’s Reporting Transparency rating measures if a firm is “effective in reporting on a wide range of social and environmental performance measures” (KLD, 2006, p. 5). The author assumed that the firms publishing stand-alone annual reports on corporate social responsibility/performance (CSR/CSP) could be counted as effectively reporting on social and environmental issues. Therefore, the author tracked whether a firm published annual CSR/CSP reports in a given year. The information provided by CorporateRegister.com was verified by the author using all sample companies’ websites. The number of observations is 6,053. The period covers 1996 to 2008, and the number of firms included is 524. These data are an unbalanced panel, meaning that not all firms in the sample have information for all years during the sample period.
Dependent/Independent Variables
To test research questions 1, 2, and 3, the author used the KLD ratings and CSP data from other sources for the dependent and independent variables interchangeably. As described in Equations (1), (2), and (3), a variable can be used as both a dependent and independent variable. Eight variables in total were obtained from the KLD database and other data sources.
CEO Diversity (KLD)
CEO Diversity is a dichotomous rating that denotes “if the company’s chief executive officer is a woman or a member of minority group” (KLD, 2006, p. 6). KLD provides only the “strength item” for a CEO Diversity rating item. If a company does well in CEO Diversity, it was assigned a value of 1, and 0 otherwise.
CEO Diversity (Execucomp)
CEO diversity data were obtained from the Execucomp database, which provides information only about CEO gender and not about CEO ethnicity. Therefore, CEO diversity performance is measured as a dichotomous variable indicating whether the CEO is a female. 6
BOD Diversity (KLD)
BOD Diversity is a dichotomous rating that measures if “women, minorities, and/or the disabled hold four seats or more (with no double counting) on the board of directors, or one-third or more of the board seats if the board numbers less than 12” (KLD, 2006, p. 6). KLD provides only the “strength item” for the BOD Diversity rating item. If a company does well in BOD Diversity, it was assigned a value of 1, and 0 otherwise.
BOD Diversity (IRRC)
BOD diversity information was obtained from the IRRC database, which provides detailed information about individual board members. The IRRC database provides both gender and ethnicity information for board members. Using the IRRC database, the author calculated the ratio of female and minority directors on the board. Specifically, the author calculated four measures of board diversity, using the IRRC database. First, the author calculated a binary diversity measure that reflects female and minority director composition, following KLD’s approach (assigning a value of 1 if four or more directors are either female or minority, or 1/3 of directors are either female or minority when the total board members are fewer than 12, and assigning 0 otherwise). Second, the author calculated a continuous measure of BOD diversity, which is the percentage of female and minority members (without double counting) on the board. Third, the author calculated the percentage of females on the board. Lastly, the author calculated the percentage of minorities on the board.
TMT Compensation (KLD)
TMT Compensation (i.e. strength, concern) is a dichotomous rating that indicates whether “the company has recently awarded notably low (strength)/high (concern) levels of compensation to its top management or its board members” (KLD, 2006, p. 6). KLD provides both strength and concern for the TMT Compensation and Reporting Transparency items. Therefore, the author used three separate measures for the TMT Compensation category: Net TMT Compensation (concern minus strength), TMT Compensation Concern, and TMT Compensation Strength, following the advice of Mattingly and Berman (2006) and McGuire et al. (2003).
TMT Compensation (Execucomp)
TMT compensation information was collected from the Execucomp database, which provides total compensation (e.g., bonus, salary, stock-based compensation, retirement plans, etc.) information for each senior executive of a firm. Using these data, the author calculated the annual sum of the total TMT compensation and divided it by 1,000, because of the very large value of this item. 7
Reporting Transparency (KLD)
Reporting Transparency is also a dichotomous rating that measures whether “the company is particularly effective in reporting on a wide range of social and environmental performance measures, or is exceptional in reporting on one particular measure” (KLD, 2006, p. 5). While KLD reports both strength and concern for Reporting Transparency, the author chose not to use the Reporting Transparency Concern item, which is available only for 2006 and 2007 at the time of data collection. Combining both strength and concern for the Reporting Transparency item would have resulted in a loss of information from 1996 to 2005, for which the Reporting Transparency Strength rating is available.
Reporting Transparency (CorporateRegister.com)
Information on reporting transparency was collected from CorporateRegister.com. KLD’s Reporting Transparency rating measures whether a firm is “effective in reporting on a wide range of social and environmental performance measures” (KLD, 2006, p. 5). the author assumed that the firms publishing stand-alone annual reports on CSR/CSP could be counted as “effectively reporting on social and environmental issues” (KLD, 2006, p. 5). Therefore, the author tracked whether a firm published annual CSR/CSP reports in a given year. The information provided by CorporateRegister was further verified by the author, using all 524 companies’ websites.
Control Variables
Following Chatterji et al. (2009), the author controlled for industry (2-digit Standard Industrial Classification [SIC] code), year, log total assets, and log total sales. Log total assets and log total sales were used to measure corporate size. All control variables were collected from the Compustat Fundamental Annual database. Descriptive statistics and correlations are reported in Table 1.
Summary Statistics and Correlations.
Execucomp CEO Diversity Data and KLD’s CEO Diversity Rating

Note. CEO = chief executive officer; KLD = Kinder, Lydenberg, Domini Reasarch & Analytics; IRRC = Invester Responsibility Research Center; BOD = board of directors; TMT = top management team; CSR = corporate social responsibility; CSP = corporate social performance.
Significance levels: *p < .05.
Results
The author examined the three research questions using several regression analyses. In addition to the results reported in this section, the author also performed a number of robustness checks to ensure that the findings are robust to changes in the model. The results remained the same after the following additional robustness checks. First, the author used the clustered standard error by firm identification for all models to account for within-firm autocorrelations (Baum, 2006). Second, the author used the Huber-White sandwich estimator to deal with possible heteroskedasticity (Baum, 2006). Third, the author re-estimated all empirical models using 2- to 5-year lagged explanatory variables. 8 Fourth, the author re-estimated all backward-looking models using “averaged” past social performance data up to five years. 9 Fifth, the author re-estimated all tobit models using (1) ordinary least squares (OLS) estimation after logit-transforming the ratio variables; and (2) the generalized linear model (GLM; Papke & Wooldridge, 1996). Sixth, the author re-estimated all logit models, using probit estimation. Seventh, the author used the average compensation per TMT member to evaluate KLD’s TMT Compensation rating. Lastly, the author included an additional control of return-on-assets.
Result 1. Evidence of backward-looking ability of the KLD ratings
Table 2 shows that KLD’s CEO Diversity rating at t+1 effectively measures CEO gender diversity data (Execucomp) at t (β = 4.2067, p < .001), and that KLD’s BOD Diversity rating at t+1 also effectively measures BOD diversity data (IRRC) at t (β = 3.0914, p < .001, First Model). Table 3 shows that KLD Reporting Transparency and TMT Compensation ratings at t+1 effectively measure annual CSR/CSP report publication status information (β = 2.9162, p < .001) and TMT compensation data (β = 0.0029, p < .001, First Model) at t. The significant positive coefficients of the diversity and governance performance variables (Execucomp and IRRC variables) suggest that KLD’s four Diversity and Governance ratings effectively measure past corporate diversity and governance performance data reported in other independent data sources.
Backward-Looking Ability of the KLD Diversity Ratings.

Note. CEO = chief executive officer; KLD = Kinder, Lydenberg, Domini Reasarch & Analytics; IRRC = Invester Responsibility Research Center; BOD = board of directors.
Significance levels: *p < .05. **p < .01. ***p < .001.
Backward-Looking Ability of the KLD Governance Ratings.
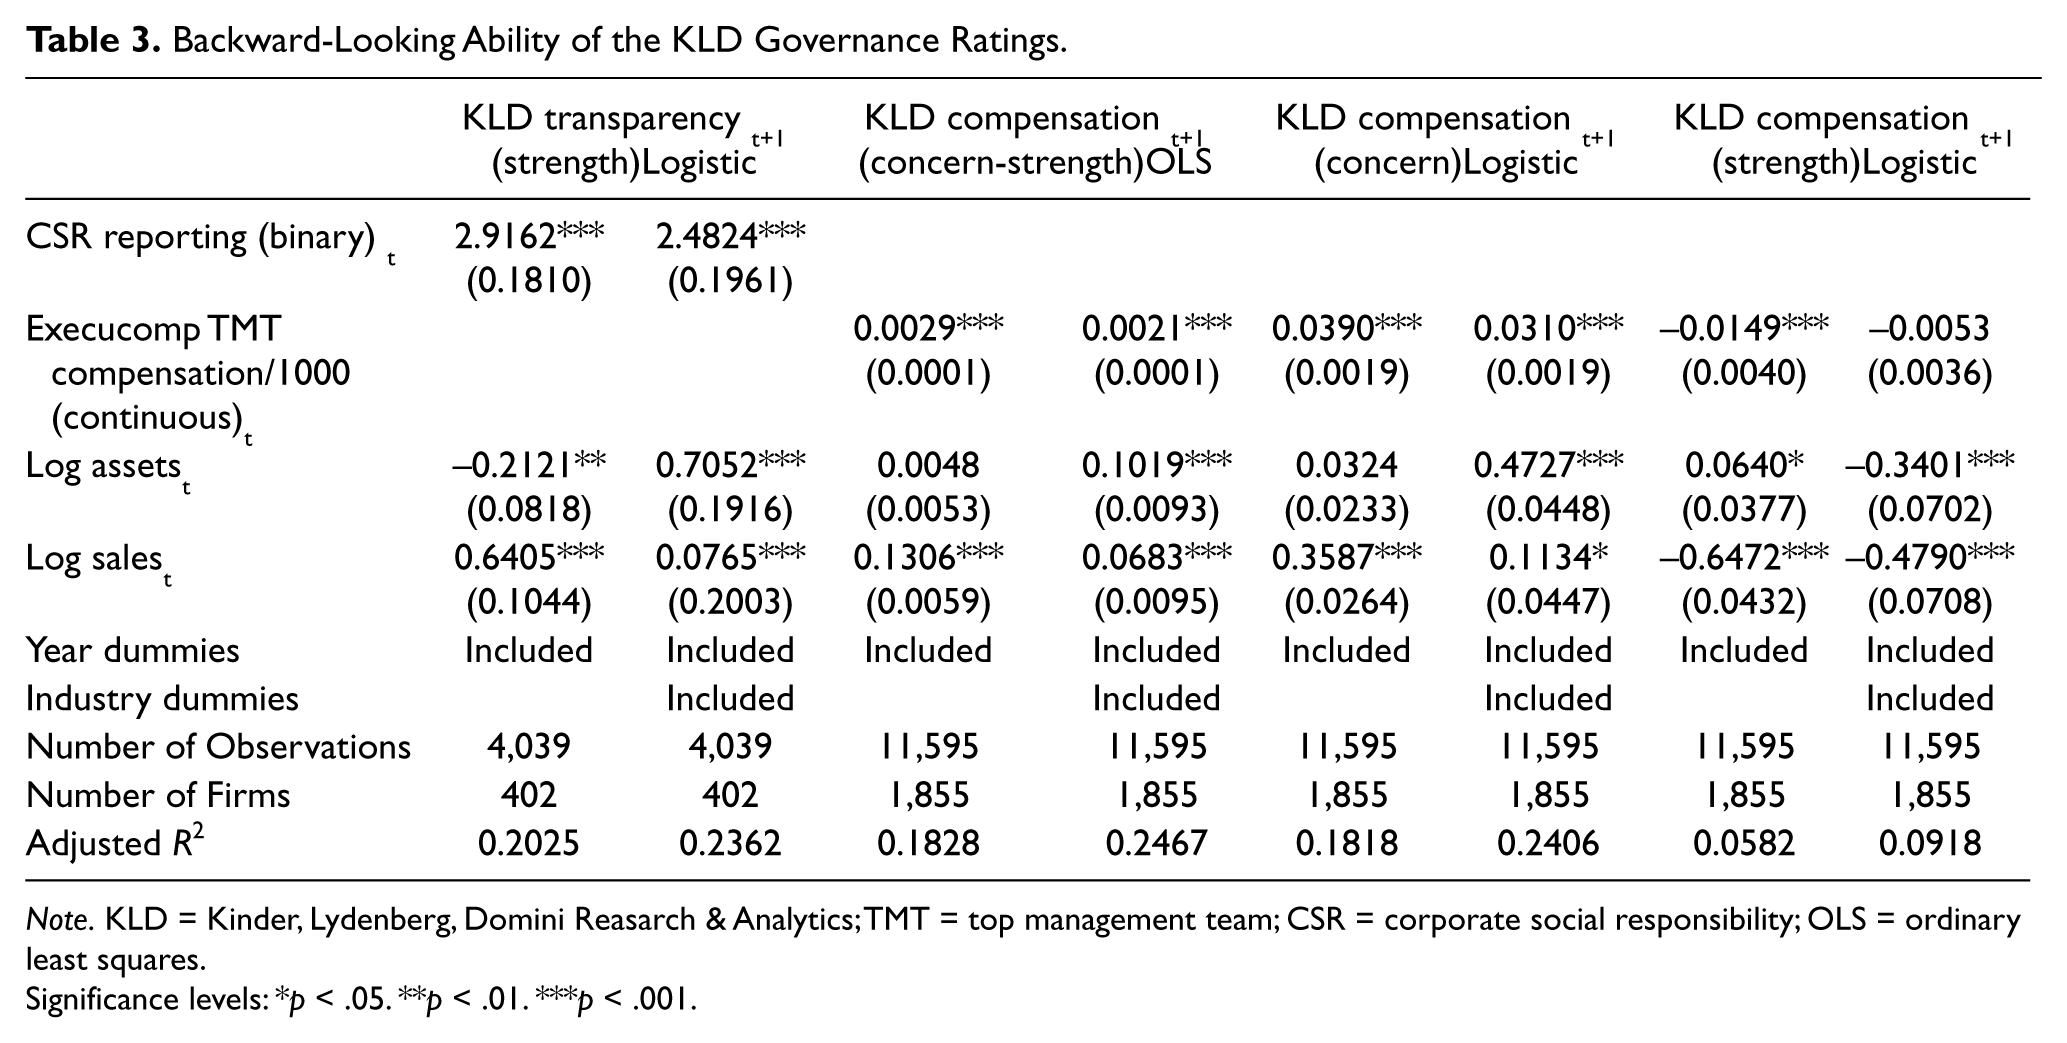
Note. KLD = Kinder, Lydenberg, Domini Reasarch & Analytics; TMT = top management team; CSR = corporate social responsibility; OLS = ordinary least squares.
Significance levels: *p < .05. **p < .01. ***p < .001.
Result 2. Evidence of forward-looking ability of the KLD ratings
Table 4 shows that KLD’s CEO Diversity rating at t effectively predicts CEO gender diversity data (Execucomp) at t+1 (β = 4.2182, p < .001) and that KLD’s BOD Diversity rating at t also effectively predicts BOD diversity data (IRRC) at t+1 (β = 2.6894, p < .001, First Model). Table 5 shows that KLD Reporting Transparency and TMT Compensation ratings at t effectively predict annual CSR/CSP report publication status information (β = 2.3327, p < .001) and TMT compensation data (β = 5.5625, p < .001, First Model) at t+1. The significant and positive coefficients of the KLD Diversity and Governance ratings suggest that KLD’s four Diversity and Governance ratings effectively predict future corporate diversity and governance performance data reported in other independent data sources.
Forward-Looking Ability of the KLD Diversity Ratings.

Note. CEO = chief executive officer; KLD = Kinder, Lydenberg, Domini Reasarch & Analytics; IRRC = Invester Responsibility Research Center; BOD = board of directors.
n/a = not available (see Note 10).
Significance levels: *p < .05. **p < .01. ***p < .001.
Forward-Looking Ability of the KLD Governance Ratings.

Note. OLS = ordinary least squares; KLD = Kinder, Lydenberg, Domini Reasarch & Analytics; TMT = top management team; CSR = corporate social responsibility;
n/a = not available (see Note 10).
Significance levels: *p < .05. **p < .01. ***p < .001.
Result 3. Additional explanatory power of the KLD ratings
The last question regarding the KLD social ratings is whether these ratings can predict future corporate social performance beyond what is predicted by past corporate social performance. To understand this, the author added lagged dependent variables of corporate social performance measures collected from other data sources (see Equation [3] earlier).
The results (Lagged Dependent Variables Models, Tables 4 and 5) indicate that the magnitude of the predictability of the KLD Diversity and Governance ratings declined in the models that included the lagged dependent variables. For example, the coefficient for KLD BOD Diversity dropped from 2.6894 to 1.3010 (First Model, Table 4). The decline in the size of the coefficients suggests that a substantial portion of the estimated effect size in the base models is due to autocorrelations in the data (that is, explainable by past social performance). However, the KLD ratings remain statistically significant at the p < .001 level. For example, BOD Diversity (β = 1.3010, p < .001, First Model, Table 4) and TMT Compensation (β = 3.6518, p < .001, First Model, Table 5) are highly significant. This result suggests that the KLD ratings do identify a statistically significant difference in the quality and characteristics of management and firms that influence future social performance. 10
Discussion
This section interprets some statistical results and provides further discussion about the results. The first two sets of tests on the backward- and forward-looking ability of the KLD Diversity and Governance ratings suggest that these ratings measure past social performance and predict future social performance quite effectively. These findings are relatively straightforward to understand. The third set of tests examined whether the KLD Diversity and Governance ratings have additional explanatory power in predicting future social performance beyond what is predictable by past social performance data. The results of this third test may need further interpretation.
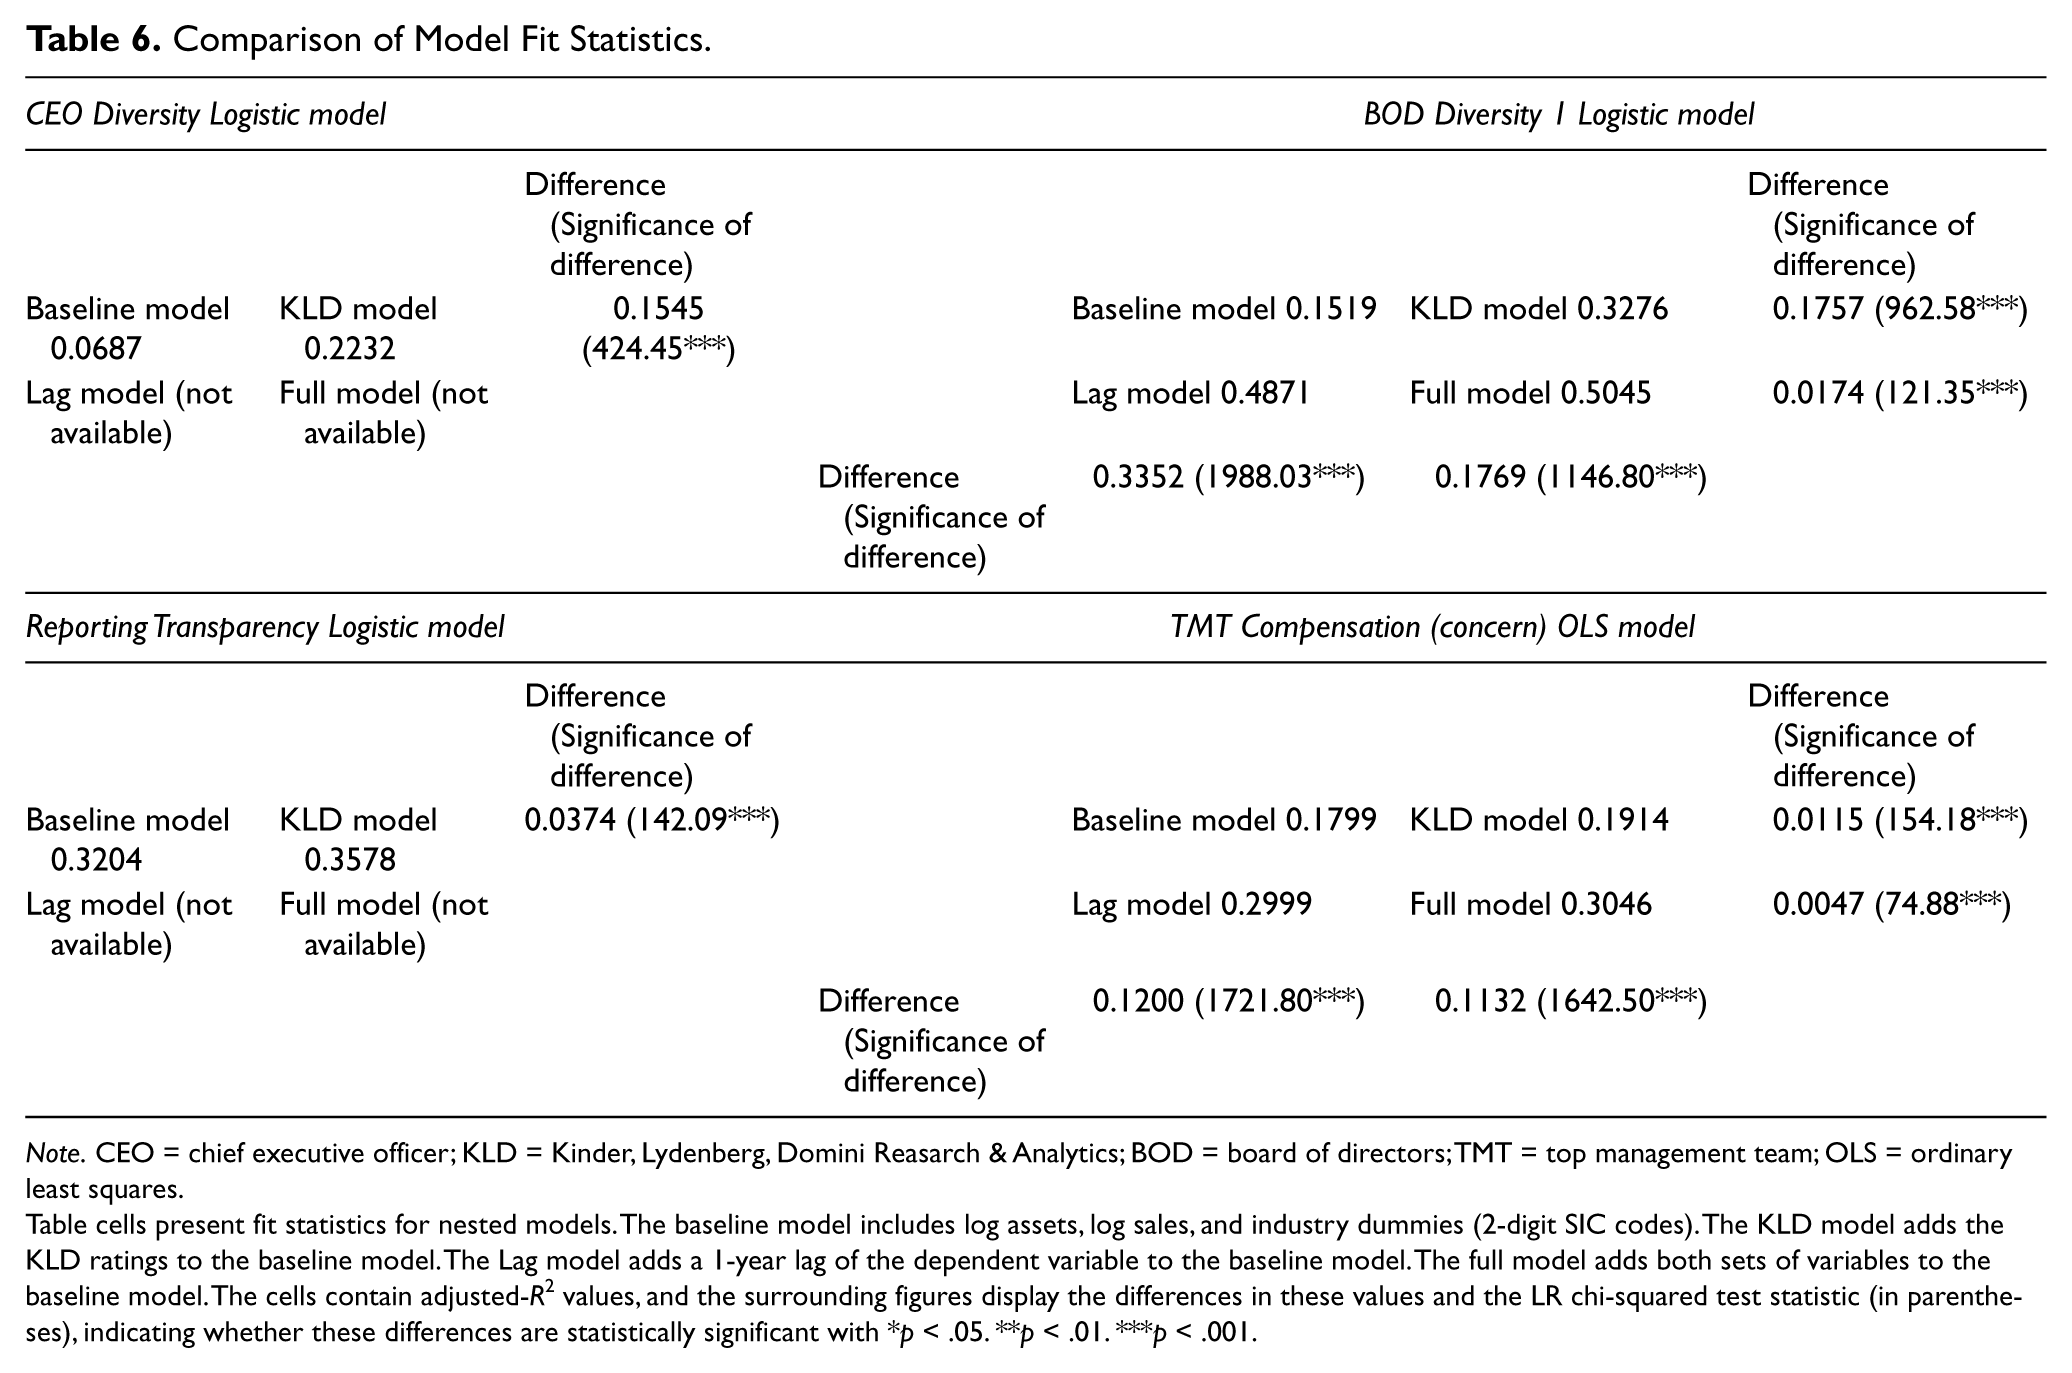
This “additional explanatory power” of the KLD ratings is based on the possibility that these ratings may reflect unobservable management and firm characteristics that can affect future social performance (Chatterji et al., 2009; KLD, 2006; Mattingly & Berman, 2006). If such unobservable management and firm characteristics are reflected in the KLD ratings, adding these ratings to the lagged dependent variable model should substantially enhance the explanatory power. To understand whether this enhancement occurs, the author examined if adding the KLD ratings would substantially increase the model fit statistics— adjusted R2 (Table 6). The baseline model predicts social performance in the Diversity and Governance categories, based on the control variables—firm size (sales, assets), year, and industry. The upper-left boxed cells in Table 6 represent the fit statistics of the baseline models, to which the author compared a “KLD model” that adds the KLD rating variable in each category (upper-right cells in Table 6), a “Lag model” that adds the 1-year lag of the dependent variable (social performance) to the baseline model (lower-left cells in Table 6), and a “Full model” that adds both the KLD rating variables and the 1-year lagged dependent variable (lower-right cells in Table 6). 11
Comparison of Model Fit Statistics.
Note. CEO = chief executive officer; KLD = Kinder, Lydenberg, Domini Reasarch & Analytics; BOD = board of directors; TMT = top management team; OLS = ordinary least squares.
Table cells present fit statistics for nested models. The baseline model includes log assets, log sales, and industry dummies (2-digit SIC codes). The KLD model adds the KLD ratings to the baseline model. The Lag model adds a 1-year lag of the dependent variable to the baseline model. The full model adds both sets of variables to the baseline model. The cells contain adjusted-R2 values, and the surrounding figures display the differences in these values and the LR chi-squared test statistic (in parentheses), indicating whether these differences are statistically significant with *p < .05. **p < .01. ***p < .001.
In predicting BOD diversity, adding the KLD ratings to the baseline model increased the adjusted R2 by 0.1757 (χ 2 = 962.58, p < .001), while adding the lagged BOD diversity variable to the baseline model increased the adjusted R2 by 0.3352 (χ2 = 1988.03, p < .001). Although both increments are statistically significant, adding the KLD ratings only increased the explanatory power by 52.41% (= 0.1757/0.3352), as much as adding the lagged social performance variable. Similarly, for the TMT compensation models, adding the KLD ratings to the baseline model increased the adjusted R2 by 0.0115 (χ2 = 154.18, p < .001), while adding the lagged BOD diversity variable increased the adjusted R2 by 0.1200 (χ2 = 1721.80, p < .001). Again, adding the KLD ratings increased the explanatory power by only 9.58% (= 0.0115/0.1200), as much as adding the lagged social performance variable. A comparison of the KLD model and the lag model with the full model reveals a similar difference in the incremental explanatory power of the KLD ratings and the lagged social performance data variables.
In sum, the third set of tests showed that (1) the KLD ratings have statistically significant incremental explanatory power (CEO Diversity: ΔR2 = 0.1545, χ2 = 424.45, BOD Diversity: ΔR2 = 0.1757, χ2 = 962.58, TMT Compensation: ΔR2 = 0.0115, χ2 = 154.18, and Reporting Transparency: ΔR2 = 0.0374, χ2 = 142.09, Table 6); and that (2) the KLD ratings have lower incremental explanatory power than the lagged social performance data. These two findings suggest that the KLD ratings successfully identify a small, but statistically significant difference in the management and firm characteristics that influence the future social performance of firms, providing a positive answer to the third research question of this study.
Conclusion
A comparison of KLD’s Diversity and Governance ratings with data from other sources shows that KLD’s Diversity and Governance ratings effectively measure past social performance in CEO diversity, BOD diversity, reporting transparency, and TMT compensation. This result is consistent with Chatterji et al. (2009), who found that KLD’s ratings in the Environment category effectively measure past environmental performance. The author also found that the four KLD ratings in the Diversity and Governance categories strongly predict future social performance. However, the explanatory power of KLD’s ratings in predicting future social performance decreased when lagged social performance variables were included. This finding is also consistent with Chatterji et al. (2009), who found a similar result for KLD’s Environment ratings.
The KLD ratings’ somewhat weak ability to predict future social performance does not seem to pose a serious threat to the empirical literature relying on these ratings because most of the empirical studies have used the KLD social ratings as a measure of past versus future CSP (e.g., Berman et al., 1999; Graves & Waddock, 1994; Hillman & Keim, 2001; McGuire et al., 2003; Waddock & Graves, 1997). The weak future predictability of the KLD ratings may pose a more serious problem to investors and financial analysts who have relied on the KLD ratings to forecast future social performance of the firm. Also past social performance data seem to have greater explanatory power than the KLD ratings in predicting future social performance data. Therefore, investors who are interested in predicting the future social performance of firms may be better off relying on more direct past social performance data than on the KLD ratings.
However, considering that many socially responsible investment funds and investors often intend to understand the overall CSP of the firm rather than the CSP of the firm in specific areas, it may still be difficult for those investors to find a good alternative to the KLD social ratings, which cover quite a broad range of social issues. Also, the KLD social ratings show limited future predictability only when social performance data in the past are controlled for. Therefore, when more direct and fine-grained CSP data are not available, the KLD social ratings may still serve as a reasonable alternative in predicting future social performance. Furthermore, even when past social performance data (i.e., autocorrelations) are considered in the model, the KLD ratings still predicted BOD diversity and TMT compensation in a statistically significant manner. In fact, considering that simple autocorrelations often have substantially high predictive power, compared to subjective judgment (e.g., ratings; Dawes, Faust, & Meehl, 1989; Grove & Meehl, 1996), the finding that KLD’s BOD Diversity and TMT Compensation ratings remained statistically significant, even after autocorrelation is accounted for, is quite remarkable.
To date, attempts to evaluate the KLD ratings’ accuracy and effectiveness have been rare, despite the popularity of the KLD ratings among practitioners and academics. Among the attempts, two important earlier studies revealed important facts about the KLD ratings. Sharfman (1996) found that aggregated measures of the KLD ratings are strongly correlated with Fortune’s Reputation score. Mattingly and Berman (2006) found that the six KLD categories can be further classified into four distinct concepts of corporate social action. Despite these important studies, researchers did not have knowledge about the accuracy of individual KLD ratings that make up the KLD categories. Only recently have Chatterji et al. (2009) examined the accuracy of individual KLD rating items in the Environment category. In line with their effort, the current study examined the accuracy of individual KLD rating items in the Diversity and Governance categories, providing further evidence for the accuracy of the KLD ratings. Still, several other categories of the KLD ratings remain unexamined. Therefore, it may still be early to conclude anything definitive about overall effectiveness of the KLD ratings as a measure of CSP. The author invites future studies that examine other areas of the KLD ratings, such as human rights, employee relations, products, and the community.
Footnotes
Appendix. KLD Diversity and Governance Rating Items Descriptions
Declaration of Conflicting Interests
The author(s) declared no potential conflicts of interest with respect to the research, authorship, and/or publication of this article.
Funding
The author(s) received no financial support for the research, authorship, and/or publication of this article.