
Abstract
Growing research suggests social ventures (SVs) variably combine social and profit orientations in core organizational features, and this variation in hybridity leads to divergent organizational dynamics and outcomes. However, no comprehensive and precise measurement scale has emerged to capture the varying degrees of hybridity across SVs. To advance theory and empirical research, this study presents an instrument for assessing how organizational actors perceive the degree to which social and market logics are (a) compatible and (b) central to organizational functioning. An inductive-confirmatory two-study approach (Nstudy1 = 293, Nstudy2 = 315) validates a hybridity scale—composed of 6-item compatibility and 4-item centrality factors—for U.S. nonprofit organizations, benefit corporations, and social enterprises. Moreover, results reveal perceived compatibility is associated with SVs’ revenue structure, whereas centrality is related to their legal status. The development of this scale will facilitate large-scale quantitative research that systematically examines the varied nature, drivers, and implications of organizational hybridity.
Keywords
Social ventures (SVs) tackle social issues by integrating aspects of charity and business into their core operations (Battilana & Lee, 2014). Prior research has provided intriguing findings on how SVs (e.g., traditional donative nonprofits, businesses, and social enterprises) cope with hybridity, the combination and “mixing of core organizational elements that would not conventionally go together” (Battilana et al., 2017, p. 212). 1 Many studies have focused on how SVs integrate multiple institutional logics—macro-level material practices, belief systems, and cultural symbols (Friedland & Alford, 1991; Thornton et al., 2012)—into their core features and practices. As a result of mixing market and social logics, SVs may embrace both business models and social mission (Smith & Besharov, 2019), utilitarian and normative identities (Stevens et al., 2015), and hierachical and democratic control governance mechanisms (Pache & Santos, 2013).
The culmination of this literature, based primarily on qualitative interviews and case studies, suggests that SVs’ blending of social and market logics in their organizational structures and activities is quite diverse. For instance, the relative importance of social and market logics in shaping organizational decisions and operations (e.g., capital sources, workforce composition, stakeholder priorities) may be equal or may be tipped in favor of one type of logic or the other (Battilana & Dorado, 2010; Pache & Santos, 2013). Moreover, the variation in hybridity across organizations leads to divergent organizational dynamics and outcomes. Such outcomes can include organizational innovation and positive performance, or conflict that results in legitimacy deficit, identity crises, mission drift, and even organizational failure (see Battilana et al., 2017 for a review).
Accordingly, scholars have pressed for more quantitative research to gain a systematic understanding of the inherent variation in organizational hybridity. Indeed, recent works have moved beyond binary categorization of organizations as qualitatively homogeneous hybrids or non-hybrids, recognizing instead hybridity as a matter of degree that functions differently across organizations (Battilana et al., 2017; Shepherd et al., 2019). In this vein, some scholars have sought to capture the diverse manifestation of hybridity in SVs using objective quantitative measures (Litrico & Besharov, 2019; Mair et al., 2015; Wry & Zhao, 2018). However, no comprehensive and precise measurement scale to capture the varying degrees of hybridity yet exists. This is an important omission because much paradox research has shown what matters for organizational action and performance is how actors perceive tensions (or lack thereof) in the organization (Lewis & Smith, 2014; Miron-Spektor et al., 2018), and thus the need is for a perceptual scale of hybridity.
To help advance theoretical understanding and empirical research, this research develops and validates a measure to capture the varying degrees of social-market hybridity (SMH) in SVs. Grounded in Besharov and Smith’s (2014) logic multiplicity framework, I empirically test how organizational actors perceive the degree to which social and market logics are (a) compatible and (b) central to organizational functioning within a particular venture in five key features: organizational mission, capital source, workforce composition, beneficiaries, and suppliers (Dees, 1998; Dees et al., 2001). Two studies of U.S. SVs (Nstudy1 = 293, Nstudy2 = 315) facilitate the creation of a 6-item compatibility and 4-item centrality scale. Furthermore, findings reveal perceived compatibility is related to SVs’ revenue structure and perceived centrality is related to their legal status, providing significant insight into how hybridity is related to key organizational dynamics.
Theoretically, the development of the SMH scale creates many opportunities for large-scale, systematic quantitative research of SVs that will provide greater understanding of the nature, causes, and implications of organizational hybridity. This will help answer many questions (e.g., when, how, and why) and improve specificity in the SV research. Although the scale was developed for U.S. SVs, it can be adapted to a broad set of hybrid organizations that embody social and market logics across diverse contexts, such as companies that implement corporate social responsibility (CSR) programs (Hunoldt et al., 2020). Future research may also apply the scale to ascertain individual- and group-level perceived hybridity within organizations. Practically, the SMH scale provides organizational leaders with a new diagnostic tool that can help improve conflict management at work and leverage productive tensions to enhance organizational performance.
The rest of the article is organized as follows. First, I review SV research, highlighting the logic multiplicity typology (Besharov & Smith, 2014) to guide a deeper understanding of the variation in hybridity across organizations. Next, I present the results of the two studies employing exploratory and confirmatory factor analyses (EFAs, CFAs) to derive an SMH scale. At the same time, I offer specific guidelines for using the scale in two different ways. I also establish the scale’s criterion-related validity by linking perceived compatibility and centrality with SVs’ revenue structure (predictive validity) and legal status (concurrent validity). I conclude the article by suggesting future research areas.
Measuring Variation in Hybridity: Background and Rationale
As boundaries between business and social sectors have blurred, research has paid much attention to how SVs integrate and mix social and market logics as hybrid organizations (Battilana & Lee, 2014). While social logic demands SVs prioritize social value creation and community building, market logic demands they maximize profitability and efficiency. This line of research reveals SVs do not respond to social and market logics in a uniform fashion. Instead, organizations experience hybridity “differently” and “to varying degrees” (Greenwood et al., 2011, p. 319). For instance, some SVs may rely more, or solely, on earned income, whereas others turn to both earned income and philanthropic sources of revenue (Suykens et al., 2020). In terms of organizational structure, some SVs may bring together both logics to create a unified blend within the organization (Ebrahim et al., 2014), whereas others may enact social and market logics in separate subunits of the organization (Binder, 2007).
Although prior studies have revealed how SVs variably grapple with hybridity, an SMH scale is still necessary to advance theory and empirical research in three important ways. First, a measurement scale will allow researchers to characterize the heterogeneity in organizational hybridity of varying degrees, make meaningful comparisons across organizations, and gain a fuller understanding of the implications for organizational structures, processes, and outcomes. Research suggests the diverse manifestation of hybridity has divergent implications for organizations, such as collective identity development (Battilana & Dorado, 2010), perceived legitimacy among stakeholders (Pache & Santos, 2013), and mission (dis)continuity (Ebrahim et al., 2014). Although some organizations blend plural logics well for innovation and positive performance, others experience enormous conflict that results in crises, failures, and even demise (see Battilana et al., 2017). Using an SMH scale to facilitate systematic quantitative research thus “provides an opportunity for research on hybridity to offer insight into challenges, opportunities and management strategies that are relevant for a broader set of organizations” (Battilana et al., 2017, p. 241).
Second, a perceptual scale is necessary to accurately capture the extent to which SVs hybridize and integrate social and market logics in organizational features and activities. Some quantitative SV research has used more objective, archival data to assess the variation in hybridity (Greenwood et al., 2010; Mair et al., 2015; Wry & Zhao, 2018). For instance, Litrico and Besharov (2019) assessed the intensity of social and market logics based on the frequency of certain words associated with each logic in SVs’ project descriptions. Yet, although significant, past quantitative analyses typically have not extended to studying how organizational members perceive hybridity. Indeed, other research has revealed organizations may employ decoupling (Luo et al., 2017) or selective coupling (Pache & Santos, 2013) strategies to selectively fulfill the disparate demands of multiple logics or symbolically arrange them in key organizational features. This indicates some SVs assume hybridity for substantive reasons, but others do so only ceremonially (Mair et al., 2015). Using secondary, quantitative data may thus fail to distinguish between genuine hybrids and symbolic ones, resulting in a misrepresentation of the extent to which social logics effectively compete with market logics in guiding key organizational decisions and practices.
Furthermore, the significance of developing a perceptual scale becomes even greater in light of theoretical advances in paradox research that suggest actors’ perceptions of tensions in multiple organizational elements determine organizational performance and action (Lewis & Smith, 2014; Miron-Spektor et al., 2018). Thus, a measurement scale is necessary to capture the extent to which organizational actors perceive trade-offs in social and market logics to derive meaningful insights. Taken together, a perceptual scale is necessary to capture how social and market logics variably manifest in SVs and how actors perceive hybridity of varying degrees.
Variation in Hybridity: Varying Degrees of Logic Compatibility and Centrality
Besharov and Smith’s (2014) logic multiplicity framework (see Figure 1) provides a compelling typology for characterizing how multiple logics variably relate to one another based on two dimensions. These two dimensions correspond well to Battilana and colleagues’ (2017) definition of hybridity, which suggests a measure of hybridity must evaluate both the degree of mixing and the degree of contradiction of multiple logics. Besharov and Smith’s framework is also in line with a multidimensional conception of hybridity (Litrico & Besharov, 2019) and thus a measure based on it will improve “precision in theorizing and measurement” and illuminate important distinctions across organizations (Shepherd et al., 2019, p. 493). It thus provided solid guidance for the creation of a measurement scale that can accurately capture the varying degrees of hybridity in SVs.
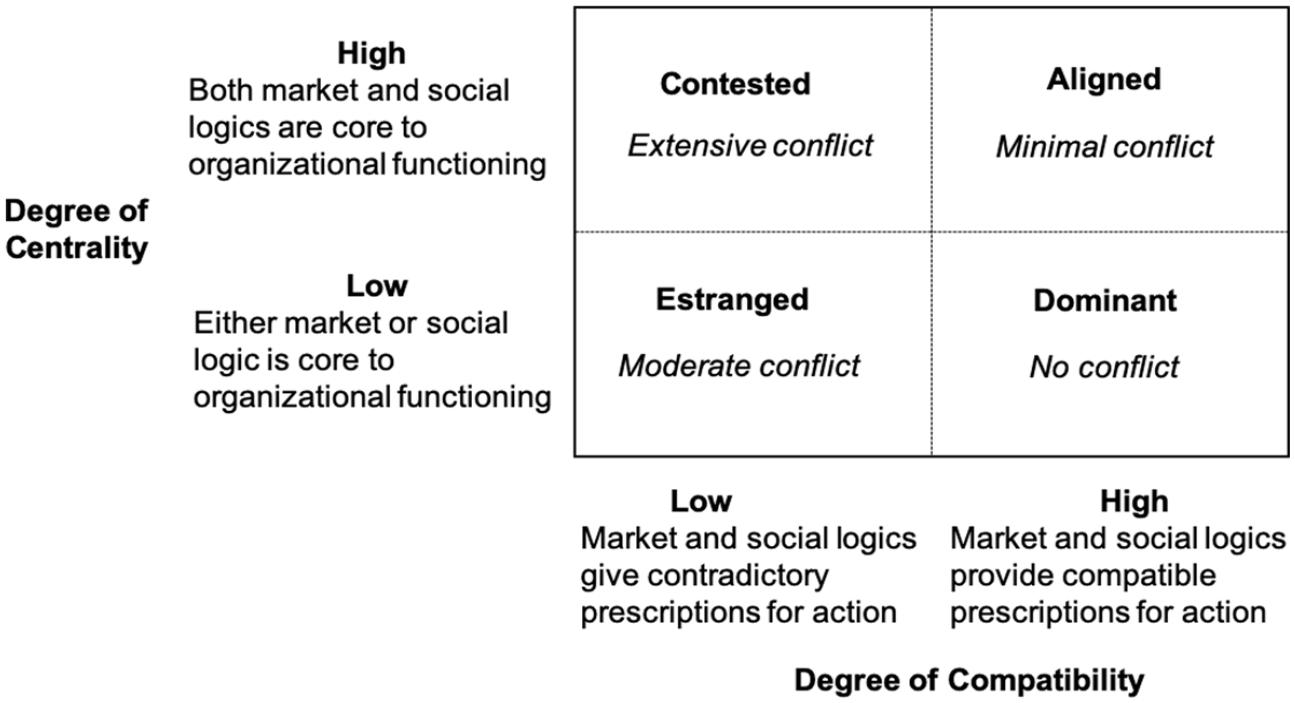
Adapted Logic Multiplicity Framework (Besharov & Smith, 2014).
Compatibility refers to the degree of “consistent and reinforcing implications for organizational action” implied by the instantiations of multiple logics (Besharov & Smith, 2014, p. 375). Compatibility is quite low in some SVs: Members perceive social and market logics as inherently contradictory, prescribing divergent goals, management principles, and means for action. As a result, organizations confront ambiguity and tensions as to which logics to follow, leading to challenges such as mission drift (Ebrahim et al., 2014) and identity crisis (Battilana & Dorado, 2010) that demand significant internal efforts to coordinate multiple logics. In contrast to most past research that implicitly or explicitly assumes that multiple logics imply conflicting courses of action, growing research has suggested actors may consider social and market logics synergistic and complementary (Beaton, 2021; Dacin et al., 2011). For instance, Fitzgerald and Shepherd’s (2018) case studies of four New Zealand SVs showed varying degrees of compatibility, which is determined by how organizational structures incorporate social and market logics. Beyond SVs, Hunoldt and colleagues’ (2020) study of German firms showed CSR managers may perceive high compatibility in social and market logics, since the ultimate goal of CSR activities is profit.
Centrality describes the degree to which a single institutional logic (low centrality) or multiple logics (high centrality) are core to organizational functioning (Besharov & Smith, 2014). In other words, centrality refers to the way in which core organizational features reflect the influence of more than one logic. Much research has documented the variance in centrality among social and market logics. For instance, Mair and colleagues’ (2015) surveys of 70 global SVs identified two types based on SVs’ governance mechanism and board composition: conforming SVs have low centrality and dissenting SVs have high centrality. Based on a content analysis of organizational mission from 14 years of grant application data, Litrico and Besharov (2019) identified a spectrum of emphasis between social and market logics, with some SVs heavily emphasizing social change and community building and some heavily emphasizing profit making (thus having low centrality in opposing ways). They also found that most SVs fall somewhere in between.
Compatibility and centrality lead to four nuanced types of hybrid organizations with varying levels of internal conflict (see Figure 1). Contested organizations may see two logics as in conflict (and thus having low compatibility), yet integrate the conflicting logics into their core operations (having high centrality). This will create more conflict than in other types of hybrids. Estranged organizations may see two distinct logics as in conflict (having low compatibility), but prioritize only one logic in the organizational core (low centrality), leading to moderate conflict. Aligned organizations often see distinct logics as compatible (high compatibility) and put emphasis on both logics in guiding organizational operations (high centrality), leading to minimal conflict. Dominant organizations have high compatibility, but nonetheless prioritize a single logic in their mission and decisions (i.e., low centrality). Hence, they have zero conflict.
In summary, the continuing growth of SV research calls for a valid measurement scale that can capture the diverse manifestation of hybridity across SVs of varying degrees. Grounded in the logic multiplicity typology and existing SV studies, this research aims to create a scale to evaluate how organizational actors perceive the compatibility and centrality of social and market logics. Following the structured scale development procedure (DeVellis, 2016; Hinkin, 1998), I develop an SMH scale for SVs via two studies. Figure 2 presents an overview of each study.

Flowchart for Two Studies.
Study 1: Scale Development
The purpose of Study 1 is twofold: (1) to identify items that load uniquely onto the compatibility and centrality factors through EFA and (2) to demonstrate convergent and discriminant validity for the resulting SMH scale through CFA.
Item Pool Generation
Grounding my efforts in the social enterprise spectrum (Dees, 1998; Dees et al., 2001; see Figure 3) and extant SV studies (see Table 1 for a selective review of the SV literature), I focused on five key dimensions—organizational goals and mission, beneficiaries, capital sources, workforce composition, and suppliers—where social and market logics may be distinct. These five domains reflect core organizational features and activities, rooted in mission and strategy, hiring and socialization, and resource dependency (Besharov & Smith, 2014), determining “what is sold,” “who is served,” and “who is employed” (Litrico & Besharov, 2019, p. 350). As a result of combining market and social logics, for instance, SVs may draw on earned income as well as donations and grants as their capital source, they may rely on both paid employees and volunteers as their workforce, and they may aim to achieve simultaneously profitability and social mission.

Social Enterprise Spectrum (Dees, 1998; Dees et al., 2001).
Key Carriers of Social and Market Logics.
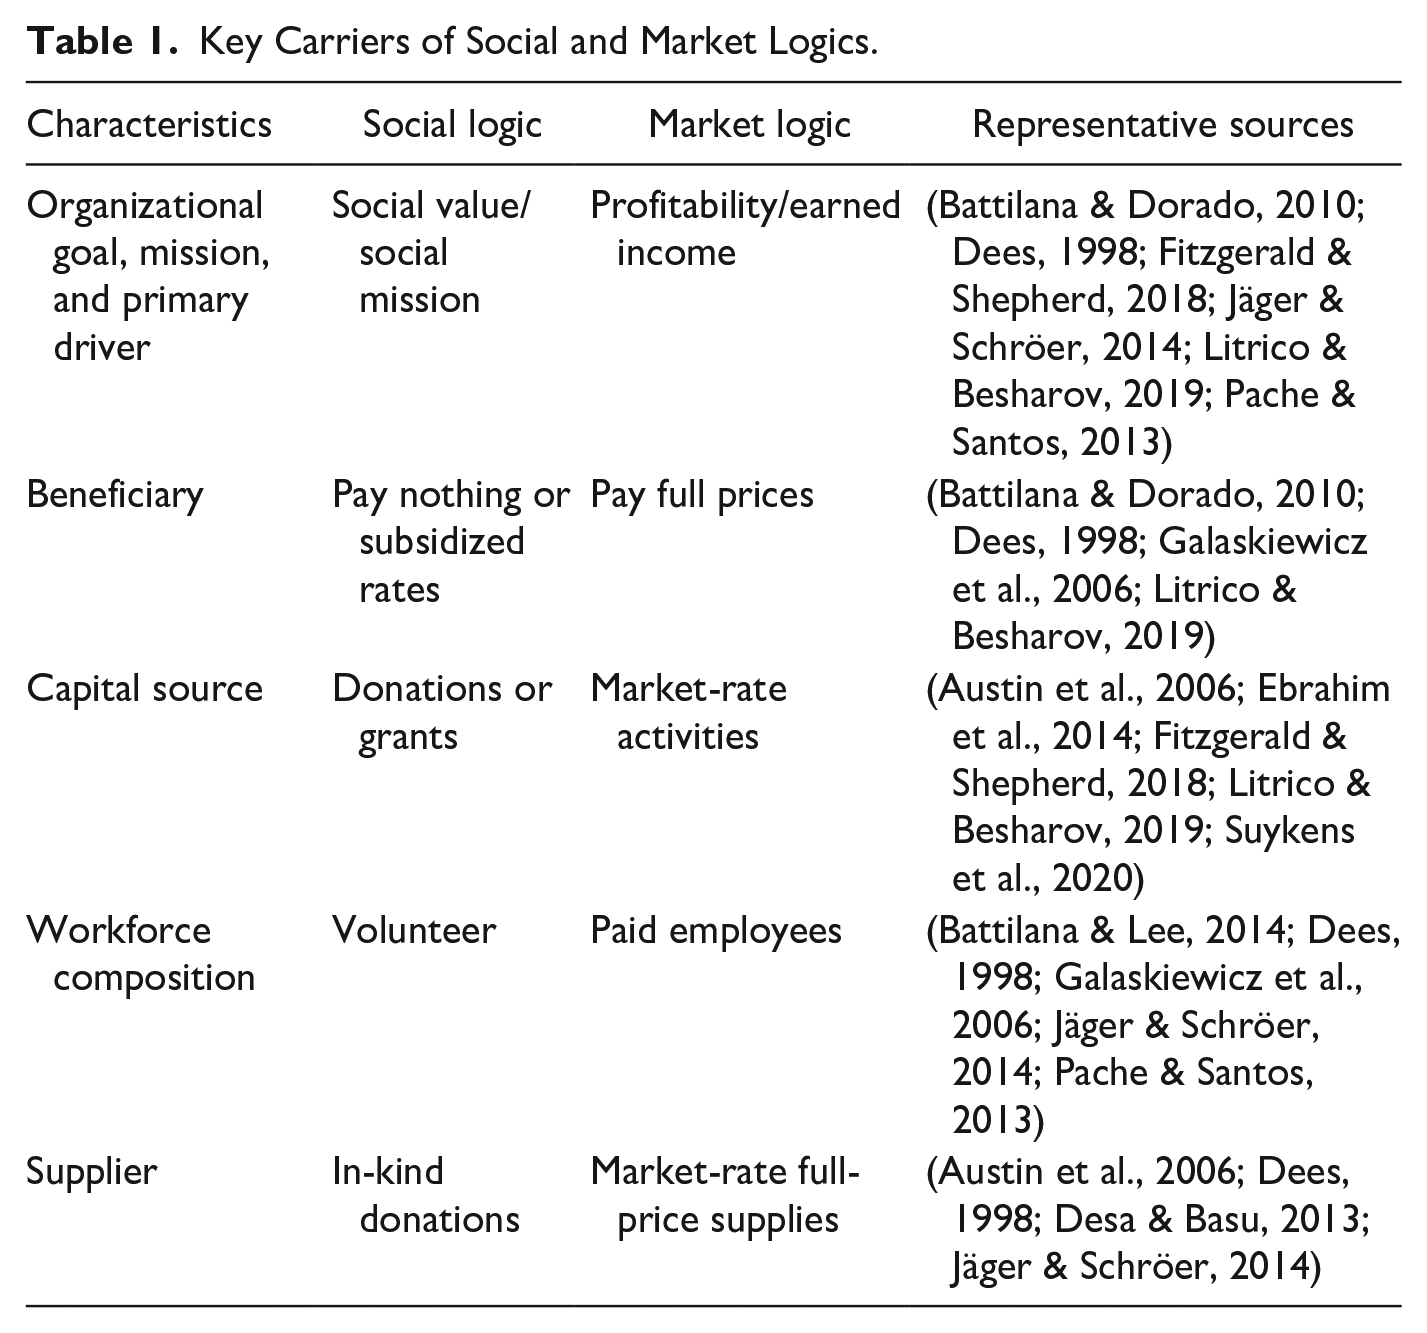
I adopted the language of the social enterprise spectrum (see Figure 3) to generate concrete items to ensure face and content validity. I created one item for each of the five aspects that would capture the constellation of social or market logic. Specifically, social logic is manifested in social value, beneficiaries who receive goods or services for free, donations and grants as capital source, volunteers as workforce, and in-kind donations as suppliers; market logic is manifested in economic value, beneficiaries who pay market-rate prices, market-rate capital, employees who receive market-rate compensation, and market-rate prices.
Due to the exploratory nature of this early stage of scale development, I created one redundant item that shared similar content but differed in wording. Redundancy in meaning helps identify the statements that best represent the construct, hence strengthening the scale through inclusiveness and repetition (DeVellis, 2016). I created one redundant item for organizational goals because organizational goals reflect more enduring core values and beliefs and are more central and important than organizational means to achieve goals, which tend to be malleable (Besharov & Smith, 2014). Accordingly, I adopted Dees and colleagues’ (2001) wording (“social mission” and “social value”) as similar ways of describing organizational goals in more philanthropic-oriented organizations. Similarly, I included both “profitability” and “earned income” to indicate organizational goals and motives in more market-driven SVs.
(In)compatibility
Because best practices in survey research recommend the use of plain language to make the survey easier for respondents to understand (DeVellis, 2016), I used a 7-point Likert-type-like scale to evaluate how much conflict, the synonym for (in)compatibility, between social and market logics within an organization each of the six items creates. Thus higher values indicated low compatibility. For example, one item probed how respondents perceived the degree of tension between volunteers and paid staff in their organization.
Centrality
Scholars have suggested measuring hybridity on a continuum anchored by a social logic on one end and a market logic on the other end (Battilana et al., 2017; Shepherd et al., 2019). Thus, for the centrality factor, I used a 7-point semantic differential scale to evaluate the extent to which both logics are core to organizational functioning and operations. Along this scale, on a continuum anchored by a social logic at one end and a market logic at the other end, centrality would be highest in the middle (i.e., both logics are dominant) and lowest on either end of the continuum (i.e., social or market logic is prioritized).
Altogether, the proposed scale consisted of six items (including one redundant item) for the (in)compatibility factor (see Table 2) and six items for the centrality factor (see Table 3). The scale was sent to four senior scholars and experts in the field to check for content validity.
Proposed Survey Instrument: (In)Compatibility.
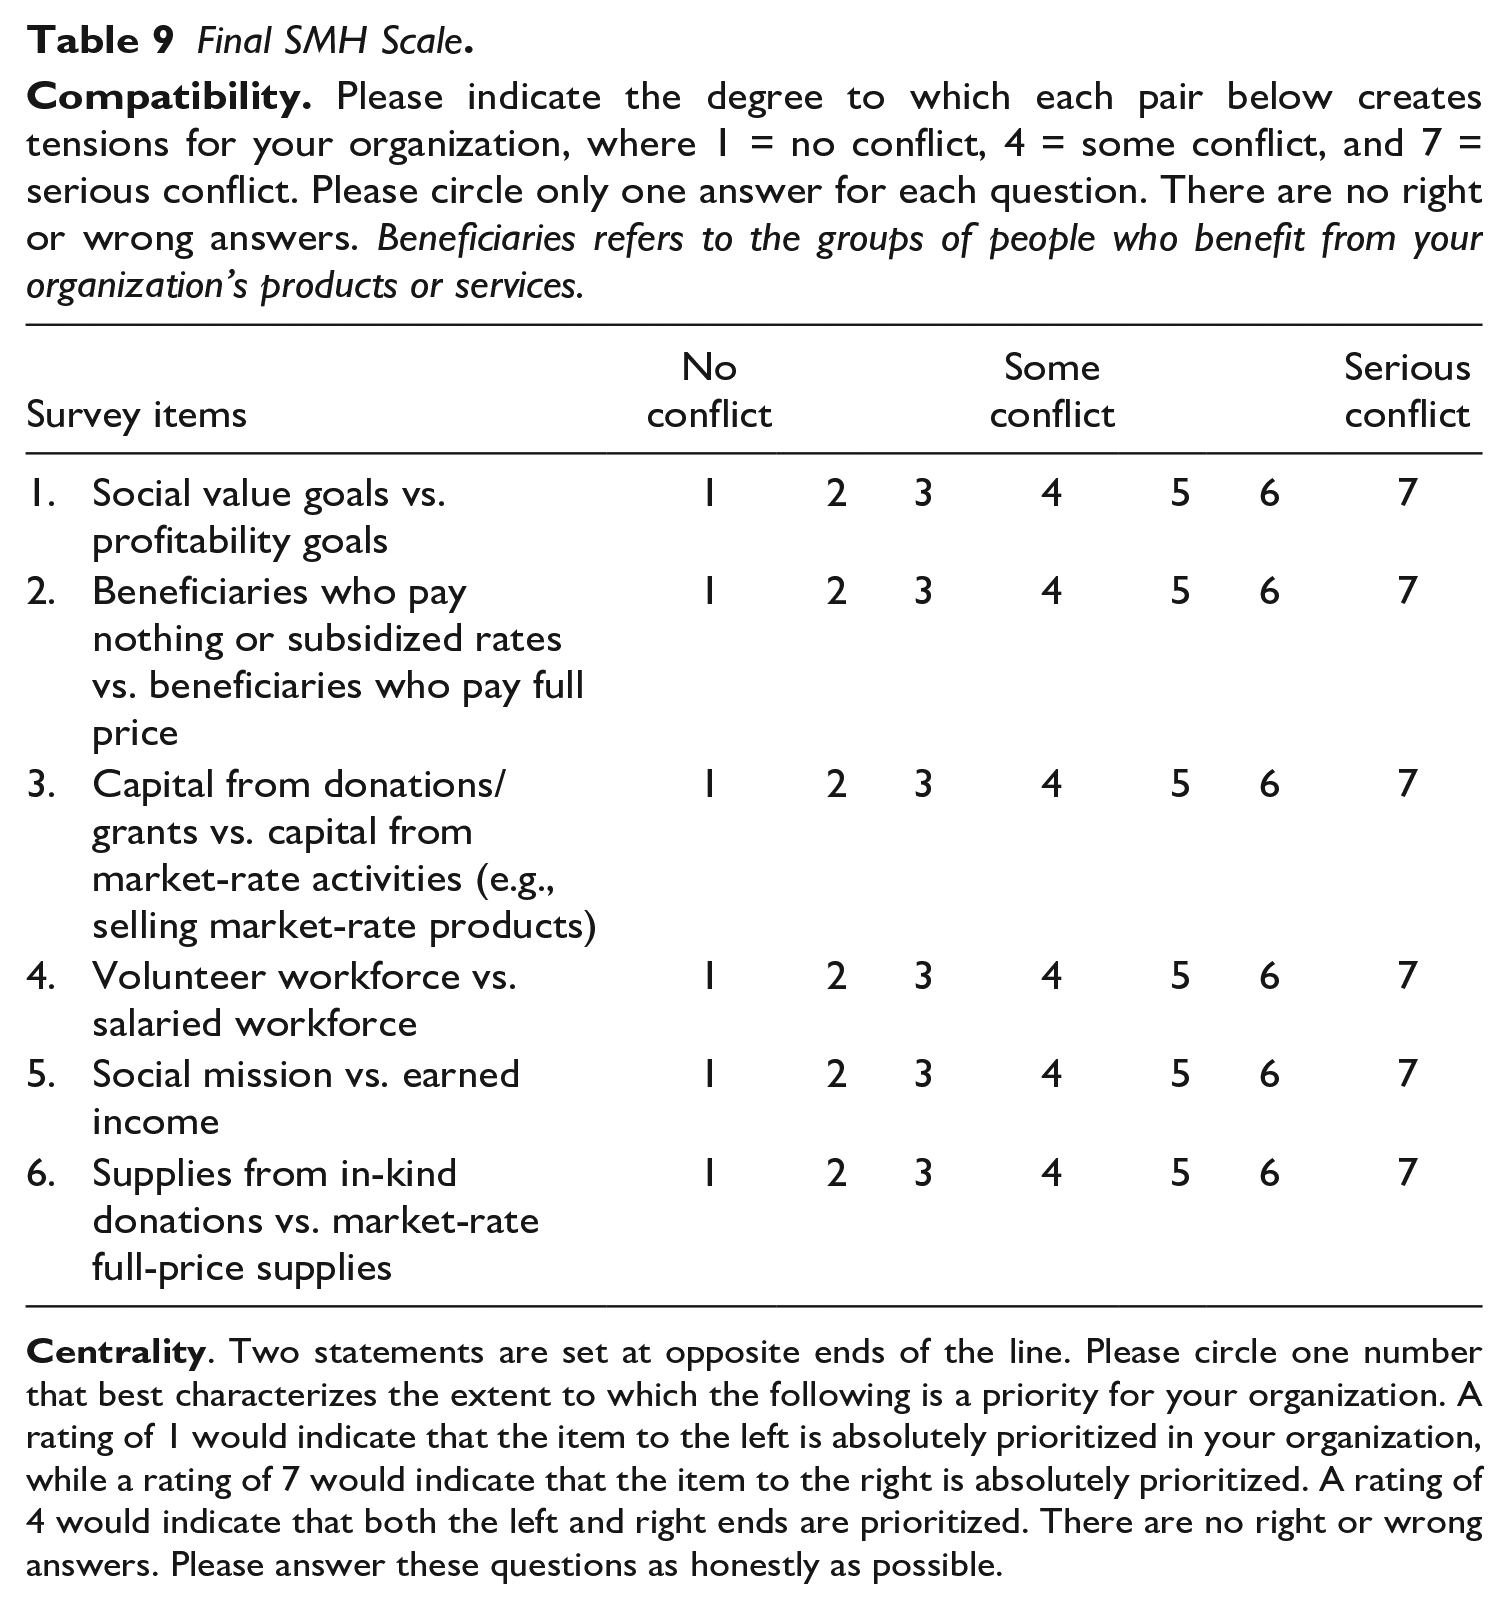
Please indicate the degree to which each pair below creates tensions for your organization, where 1 = no conflict, 4 = some conflict, and 7 = serious conflict. Please circle only one answer for each question. There are no right or wrong answers.
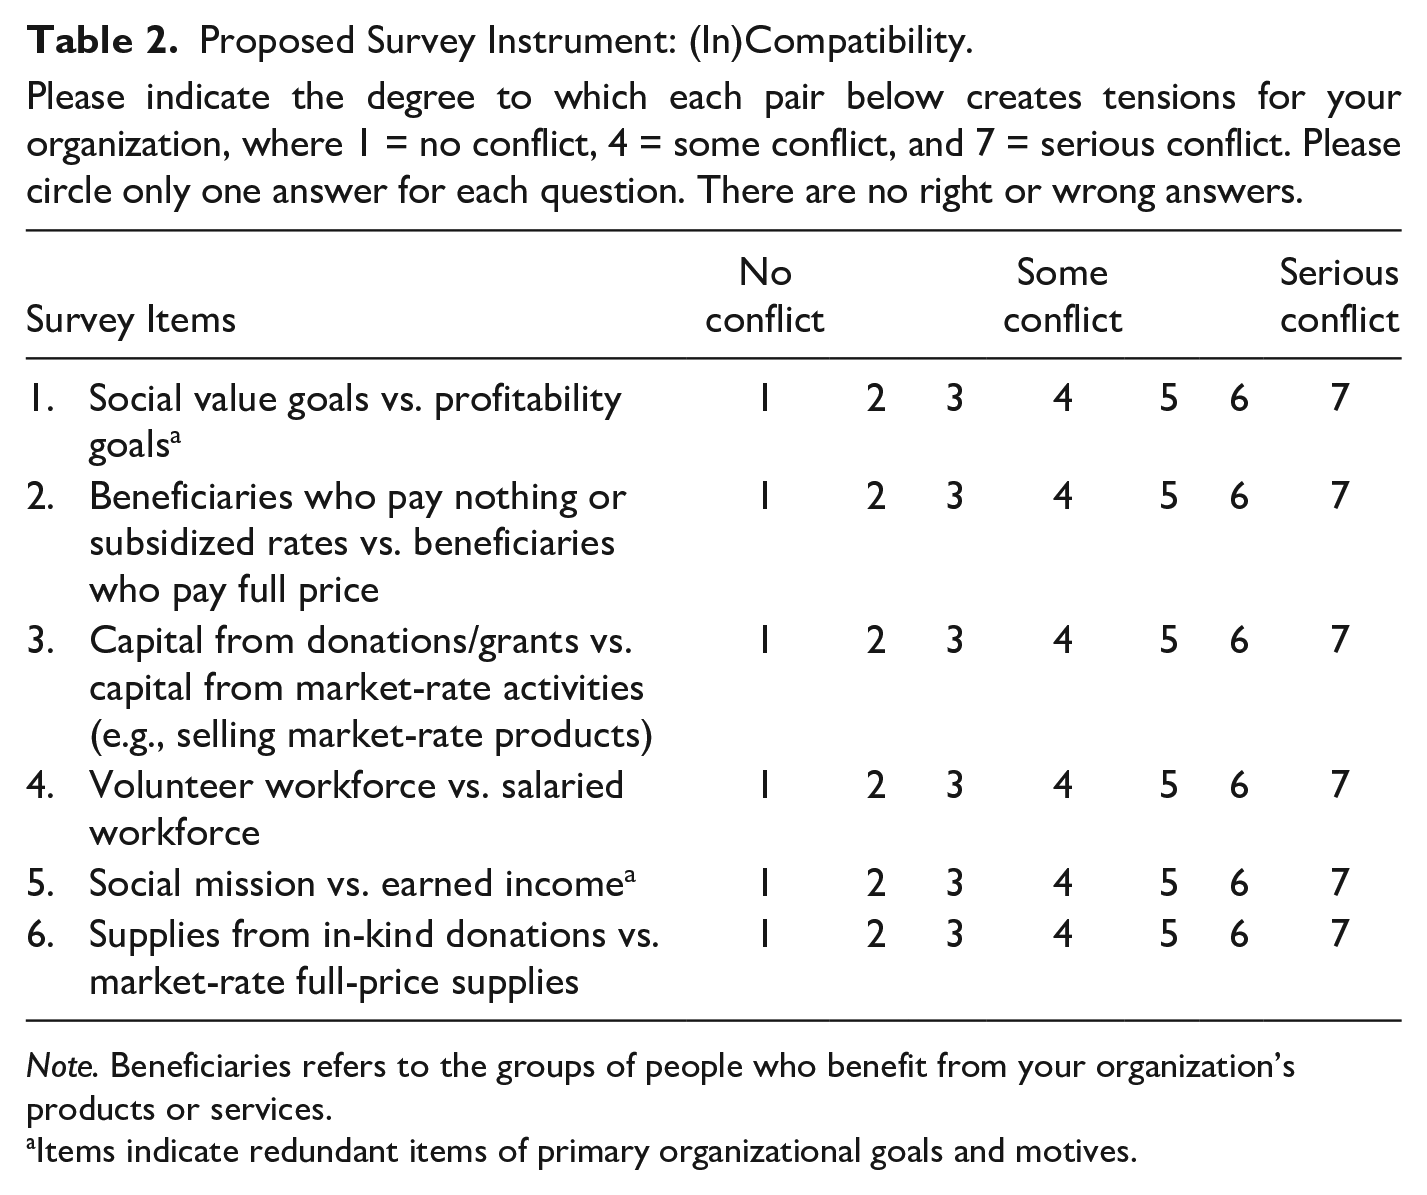
Note. Beneficiaries refers to the groups of people who benefit from your organization’s products or services.
Items indicate redundant items of primary organizational goals and motives.
Proposed Survey Instrument: Centrality.
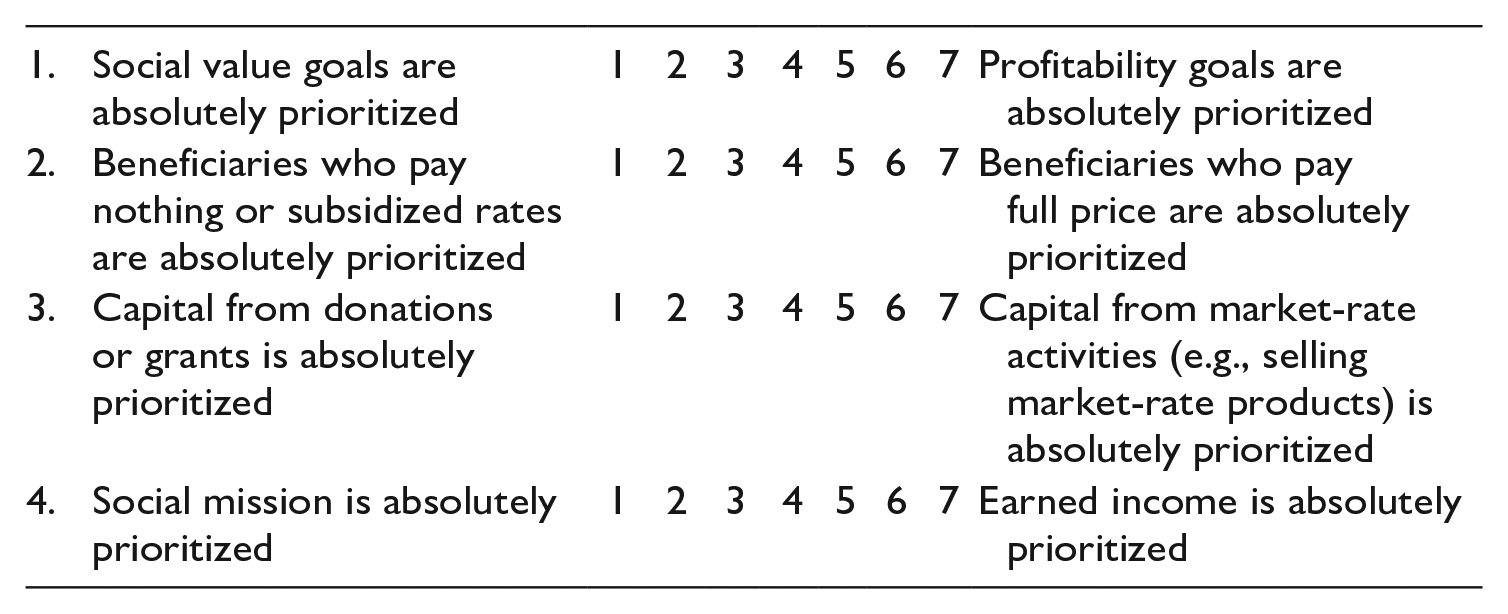
Two statements are set at opposite ends of the line. Please circle one number that best characterizes the extent to which the following is a priority for your organization. A rating of 1 would indicate that the item to the left is absolutely prioritized in your organization, while a rating of 7 would indicate that the item to the right is absolutely prioritized. There are no right or wrong answers. Please answer these questions as honestly as possible.

Items indicate redundant items of primary organizational goals and motives.
This research theorizes that SMH is a distinct latent higher order construct, encompassing the compatibility and centrality of social and market logics. There are several theoretical considerations that justify the proposed model as an effect model with reflective indicators (see Coltman et al., 2008). First, the latent constructs (i.e., compatibility and centrality) to gauge the interrelationship between logics exist independently of the measures for social or market logics (e.g., goals, beneficiary, workforce). Second, the causality is from the higher order constructs to items, meaning that the construct causes variation in item measures, whereas variation in item measures does not cause variation in the construct. Finally, the construct manifests the items; the items share a common theme and are interchangeable. In other words, adding or dropping an item does not change the conceptual domain of the construct.
I relied on organizational leaders—who typically possess significant knowledge about their organization—to serve as key informants (see Cycyota & Harrison, 2006; Fulton, 2018) about their organizations’ hybridity. Likewise, SV studies have surveyed leaders to evaluate organizational identities (Stevens et al., 2015). By surveying leaders, who have strong imprinting effects (Battilana et al., 2015), I treat the two higher order constructs as organizational-level constructs. Although I recognize research has explored the variances of hybridity within organizations (Binder, 2007; Waeger & Weber, 2019), this research operates with the organization as the unit of analysis and treats the degrees of compatibility and centrality as uniform across an organization. In the Discussion section, I consider how the SMH scale may be applied to take account of variation in hybridity across subunits within an organization.
Sample and Procedure
Nonprofit organizations (NPOs) face growing pressures to integrate commercial activities into their revenue streams for survival and growth. A recent survey reveals that, on average, NPOs in some sectors rely on commercial activities for as much as 48% of their revenue (Suykens et al., 2020). Hence, scholars have considered NPOs to be hybrid SVs (Dimitriadis et al., 2017; Litrico & Besharov, 2019). Paper questionnaires were sent via mail to a random sample of 2,000 medium-sized 501(c)(3) NPOs working in four National Taxonomy of Exempt Entities (NTEE) categories: A (arts & culture), C (environment), O (youth development), and S (capacity building & community development). Following SV research (Battilana & Dorado, 2010; Fitzgerald & Shepherd, 2018), these categories were chosen to maximize diversity. NPOs whose revenue was over $250,000 were chosen because they are more likely to generate earned income (Guo, 2006). NPO names and addresses were obtained from the GuideStar Nonprofit Database.
Nonprofit executive directors or their equivalents (e.g., board presidents or other C-suite executives) participated in the survey research from April to August 2017. Participants received a $10 gift card as an incentive to participate. Of the questionnaires mailed out, 63 were returned because the organization had moved or disbanded. Of the 1,937 remaining, 306 NPOs returned questionnaires, and among those, 293 questionnaires had valid, complete responses (response rate = 15.44%, completion rate = 97.71%). 2 On average, respondents had been working 10.54 years in their organization (SD = 8.57), indicating that they had good knowledge of their NPO.
Independent t-tests showed that responding NPOs were not different from nonresponding NPOs in revenue (t = .82, p = .41) or total assets (t = .90, p = .37), indicating no evidence of nonresponse bias. Furthermore, responding organizations did not differ from the U.S. nonprofit population registered with the Internal Revenue Service (IRS; N = 1,645,079) in revenue (t = −.05, p = .96) or assets (t = −.11, p = .92), suggesting the sample is representative of the NPO population.
The goodness of fit (GOF) indicators of CFA models are
Analytic Procedure and Results
EFA
I completed an orthogonal factor analysis with a varimax rotation, using the unconditional mean substitution for missing data (1.41%). In the first EFA with the 12 proposed items, two items had factor loadings below .45. I first removed Centrality item #4 since it had the lowest factor loading (β = .22). I then ran a second EFA with the remaining 11 items. During this analysis, I removed Centrality item #6 due to its low loading (β = .33). After this process, I ran a third EFA. Results indicated that all remaining 10 items had loadings greater than .45 and no cross-loadings were observed (see Table 4). In summary, EFA results demonstrated that all six (in)compatibility items uniquely loaded on to one factor and four centrality items uniquely loaded on to one factor (variance explained = .50 for each). The scree plot confirmed that a two-factor solution was the best solution, given that the eigenvalues for the two factors exceeded 1.
Exploratory Factor Analysis (EFA) and Factor Loadings.
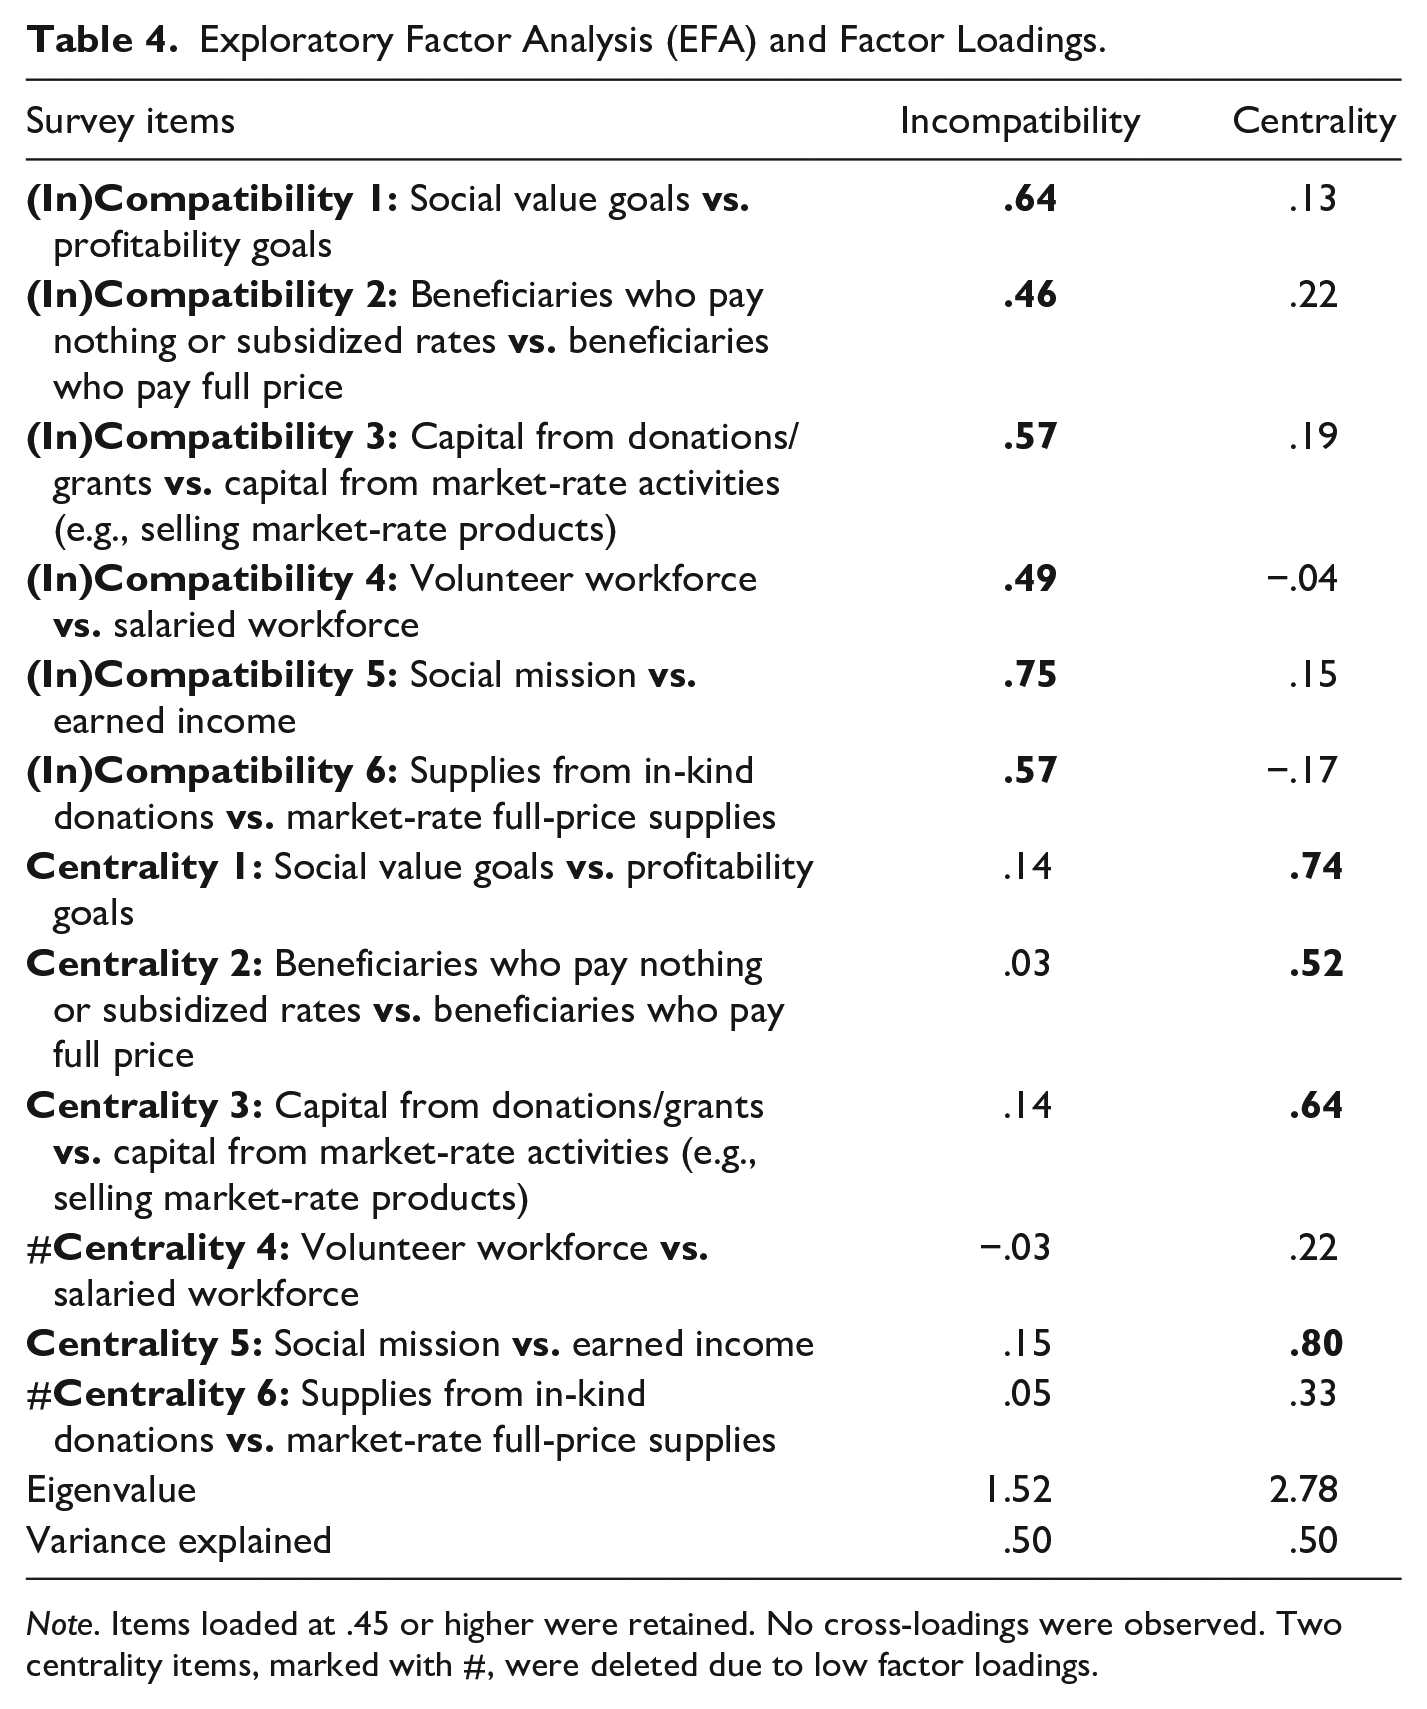
Note. Items loaded at .45 or higher were retained. No cross-loadings were observed. Two centrality items, marked with #, were deleted due to low factor loadings.
CFA
I conducted CFA to test the existence of latent higher order reflective constructs and evaluate the validity of the 6-item compatibility and the 4-item centrality scale that had emerged from EFA. After I allowed residual errors to covary within the same factor, the GOF of the model was good (χ2 = 57.26, df = 18,
Standardized Loadings of the SMH Instrument in Study 1/Study 2.
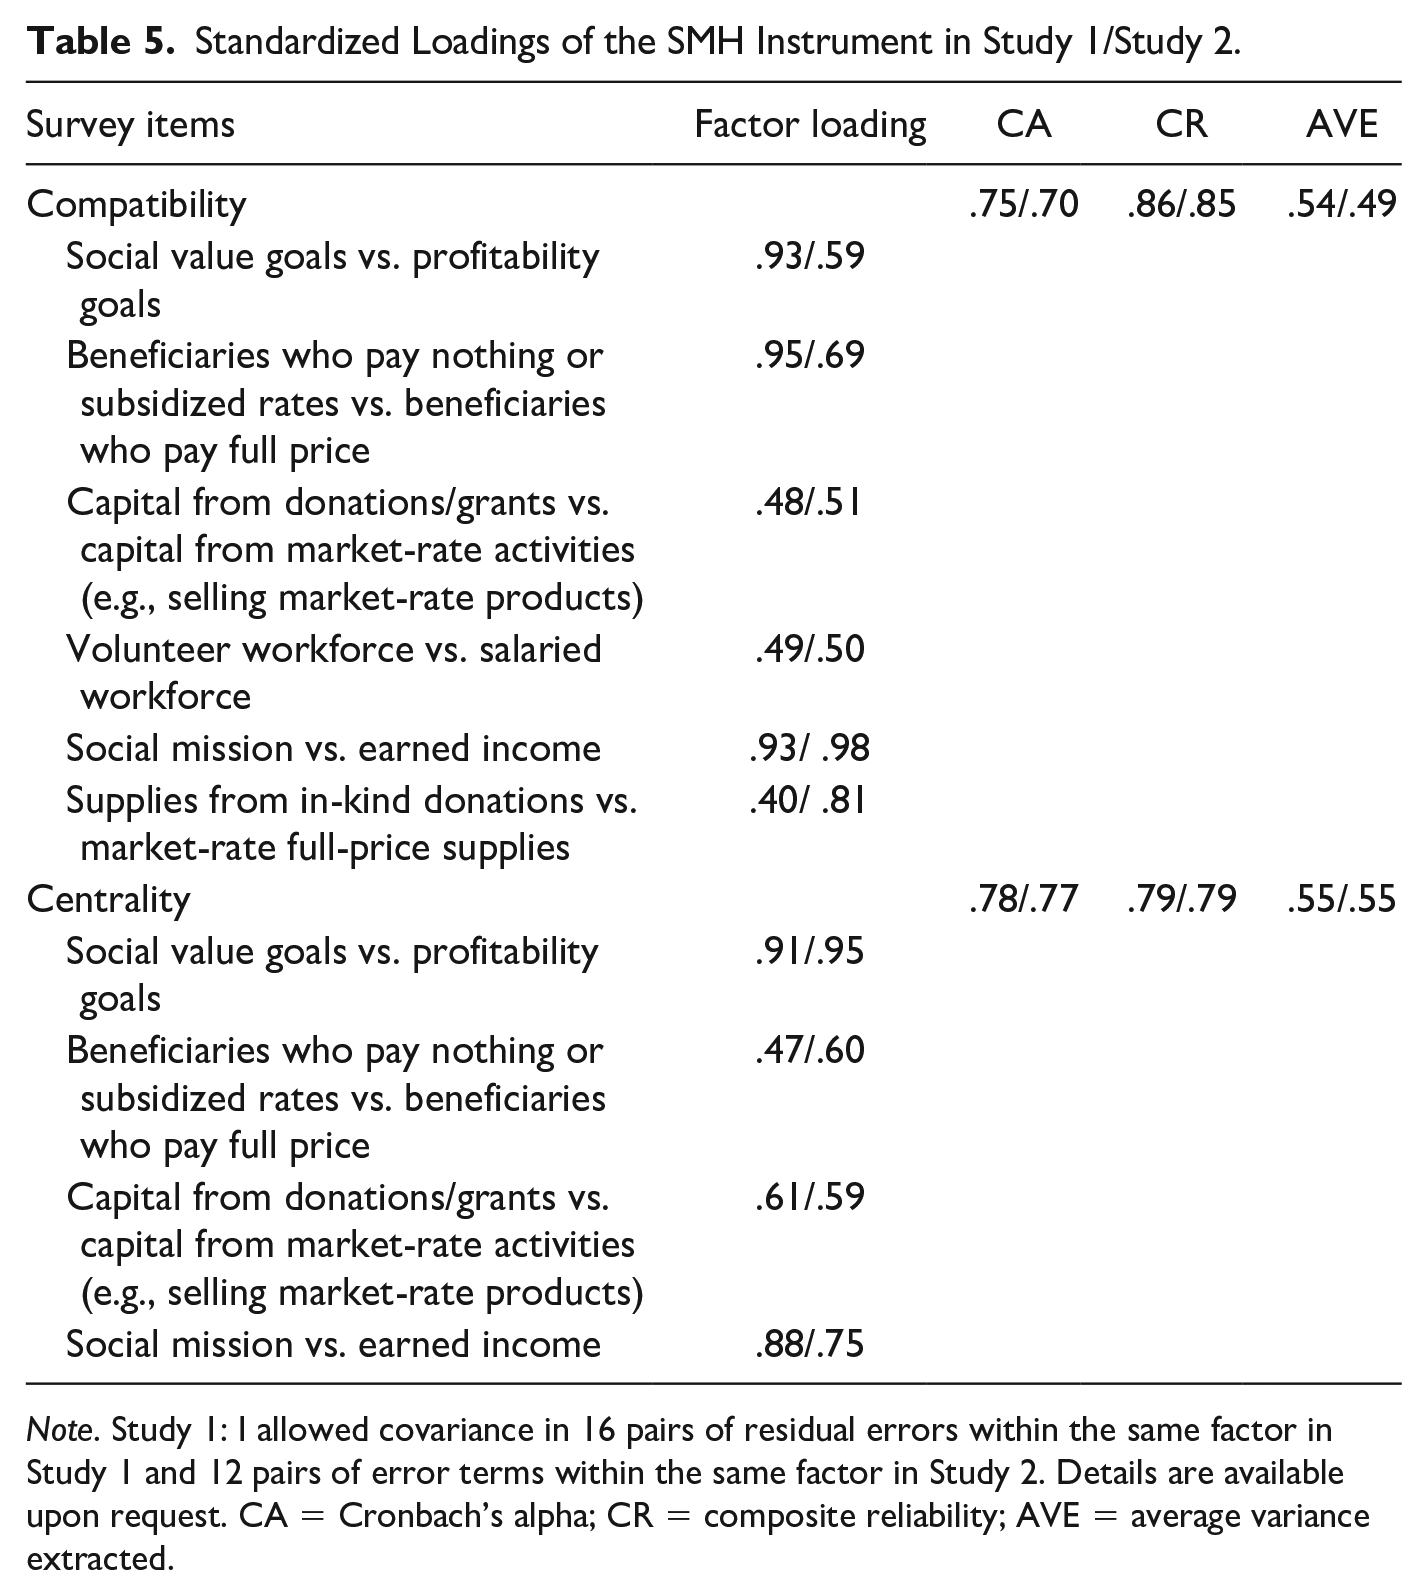
Note. Study 1: I allowed covariance in 16 pairs of residual errors within the same factor in Study 1 and 12 pairs of error terms within the same factor in Study 2. Details are available upon request. CA = Cronbach’s alpha; CR = composite reliability; AVE = average variance extracted.
Further Discriminant Analysis
To further test the discriminant validity of the scale, I compared the differences between SMH in multiple institutional logics and other theoretically close constructs such as importance of dual identities in SVs (Stevens et al., 2015; Wry & York, 2017). I compared the SMH scale with the utilitarian-normative identity scale developed and validated by Foreman and Whetten (2002; see Supplemental Appendix A) using the data from Study 1, which also contained questions probing identities. Utilitarian identity may be reflected in earned income goals, professionalism, and performance measurement; normative identity may be reflected in social mission and community building. Specifically, I created three confirmatory factor models to determine construct validity and factor structure:
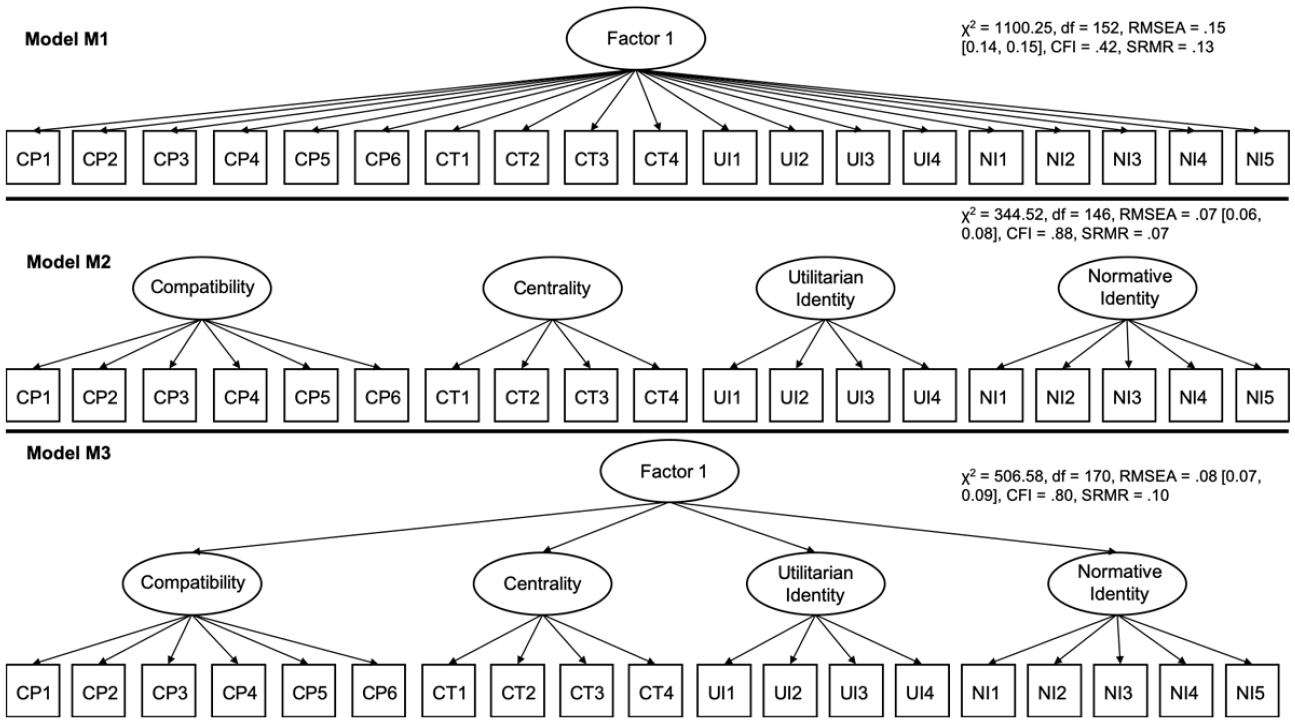
Illustration of Three CFA Models for Discriminant Analysis.
Summary of Study 1
The primary task in Study 1 was to develop the SMH scale structure. A series of EFAs and CFAs validated a two-factor structure, leading to the 6-item compatibility and 4-item centrality scale. Findings demonstrated high internal reliability and convergent and discriminant validity. Moreover, CFA results suggested the compatibility and centrality factors were distinct from each other and that they were distinct from other theoretically close concepts such as the importance of the normative-utilitarian identities. Therefore, Study 1 provides further evidence for the heuristic value of the SMH scale, which focuses on both the degree of conflict and the relative importance of social and market logics in creating varying degrees of hybridity across organizations.
Study 2: Scale Validation and Two Empirical Applications
To further validate the scale and enhance its generalizability to both nonprofit and for-profit SVs, I undertook a second study to demonstrate its criterion-related validity with a more diverse sample. Predictive validity refers to the extent to which a proposed measure can predict certain variables as suggested by theory and research (Hinkin, 1998). Following research (Mair et al., 2015; Suykens et al., 2020), Study 2 examined the link between perceived compatibility and centrality and the percentage of earned income in SVs’ revenue structure (which provided a more concrete measure of hybridity) to establish the scale’s predictive validity.
Concurrent validity assesses the ability of a scale to distinguish between different groups. Hybrid organizations often take varied organizational and legal forms (Battilana & Lee, 2014; Mair et al., 2015). Hence, Study 2 examined the differences among nonprofit and for-profit SVs in their perceived logic compatibility and centrality to establish the concurrent validity of the scale.
Sample, Procedure, and Nonresponse Bias
To ensure a diverse representation of SVs with varied legal forms, I recruited U.S. SVs from three different sources: (a) a new sample of 501(c)(3) NPOs registered in the IRS that did not include any organizations that participated in Study 1; (b) social enterprises affiliated with the Social Enterprise Alliance (SEA), a catalyst for the growth of the U.S. social enterprise sector; and (c) benefit corporations (B Corps) certified by B-Lab, a global leader in initiating B Corp certification. B Corps are for-profit corporations and legally required to generate profit for their shareholders, but also must provide social and environmental benefits to employees and the community (see Rawhouser et al., 2015; Stubbs, 2017). Executive directors or their equivalents received both a $15 gift card and a customized benchmarking report as incentives to participate.
IRS NPOs
There were 1,645,079 NPOs in the IRS nonprofit database as of September 2017. To maximize diversity, in addition to the four NTEE categories considered in Study 1 (A, C, O, S), I also recruited 501(c)(3) NPOs from these five categories: J (employment, job-related), K (food, agriculture, and nutrition), Q (international), R (civil rights, social action, and advocacy), and F (health) to produce a sample that did not include any organizations included in Study 1. Following Dimitriadis and colleagues (2017), I only included organizations founded within the past 5 years. These new ventures serve a social mission using innovative means and face considerable commercial pressures. In addition, only NPOs whose annual revenue was over $100,000 were chosen because these organizations were more likely to have earned income. 3
Applying the three filters (organizational mission, revenue, age) left 8,464 NPOs. From these I drew a random sample of 2,000, discarding any draws that consisted of an organization that participated in Study 1. Paper questionnaires were sent via mail to 1,961 NPOs with valid addresses, along with pre-addressed postage-paid envelopes and a cover letter explaining the purpose of the study, in three waves from November 2017 to March 2018. Of the questionnaires mailed out, 196 were returned. Of the remaining 1,765 NPOs, 85 returned paper questionnaires, and among these, 57 had complete responses. Organizations also had the option to participate online, which required a password and unique IP address. Another 260 people started the questionnaire online, among which 157 had complete responses. 4 Between online and paper distribution, NPOs had a total of 214 valid, complete responses (response rate = 13%, completion rate = 62%).
Social Enterprises and B Corps
Invitations, composed of a cover letter explaining the purpose of the study, were sent to all organizations affiliated with the SEA (N = 228) and all certified B Corps with the benefit corporation legal structure in the B-Lab databases 5 (N = 220). For practical reasons, the survey was offered online only to SVs affiliated with SEA and B-Labs. 6 Of the 410 invitations with valid addresses, 186 people started the online survey, but only 105 surveys 7 had valid, complete responses (response rate = 26%, completion rate = 57%).
Combined Final Sample (N = 319)
The final sample consisted of 319 U.S. SVs. Based on leaders’ self-reports of their legal form, 246 (77%) were registered as nonprofits (i.e., 501(c)(3) or cooperatives) and 73 (23%) were registered as for-profit (e.g., low-profit limited liability company, social purpose corporation). Independent sample t-tests and chi-square tests showed responding IRS NPOs did not differ from nonresponding NPOs in revenue (t = 0.53, p = .60), age (t = −1.87, p = .06), assets (t = 0.63, p = .53), income (t = 0.57, p = .57), or location (χ2 = 55.88, p = .26). Moreover, the responding social enterprises and B Corps were not significantly different from those of the nonresponding organizations in revenue (t = −0.78, p = .43), age (t = 0.56, p = .58), Twitter followers (t = 1.04, p = .30), Facebook likes (t = 0.72, p = .47), or location (χ2 = 51.45, p = .09). Hence, I found no evidence of nonresponse bias based on public and archival data.
Convergent and Discriminant Validity
Building on the 6-item compatibility and 4-item centrality scale developed in Study 1, I conducted CFA to examine the GOF of the scale for the current sample.
8
After allowing residual errors to covary within the same factor, the GOF of the scale was good (χ2 = 32.38, df = 22, p = .07,
The empirical results also confirmed my theoretical reasoning for a reflective model of SMH. First, the 10 items in the compatibility and centrality factors had relatively high positive intercorrelations (see Supplemental Appendix B). In contrast, a formative model would indicate that items would have any pattern of intercorrelation, even negative correlations. In addition, the Cronbach’s alpha, AVE, and factor loadings all exceeded the threshold values. Furthermore, the convergent and discriminant validity in the empirical test suggest that the items had similar signs and significance of relationships with the antecedents or outcomes as the construct. Finally, collinearity was not an issue as the largest condition indices from regressions of the two sets of indicators ranged from 7.09 to 21.29, all of which were well below the threshold of 30.
Two Empirical Applications and Criterion-Related Validity
In this section, I provide specific demonstrations and guidelines for using this validated instrument in empirical research in two different ways: (a) compatibility and centrality as two continuous variables; and (b) a categorical variable, derived based on the values of compatibility and centrality, to reflect the four types of hybrid organizations (i.e., contested, aligned, estranged, dominant; see Figure 1). Figure 5 illustrates the step-by-step procedures for variable recoding and transformation for each of the two applications.
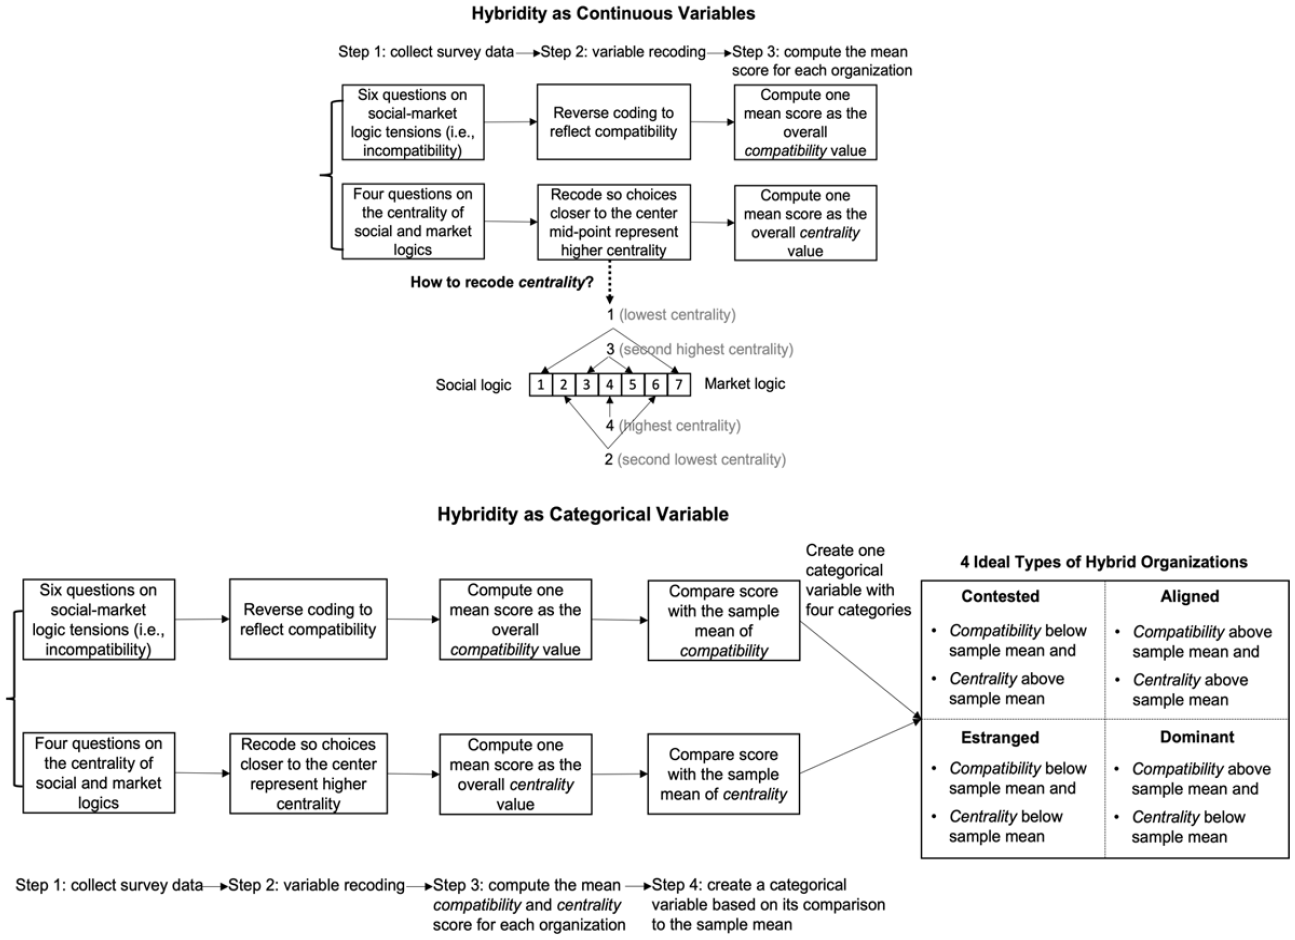
Procedure of Variable Transformation Hybridity as (a) Continuous Variables (Top) and (b) Categorical Variable (Bottom).
Compatibility
To obtain compatibility scores I reverse coded the value, since the original survey questions asked the degree of incompatibility. Given the good reliability of the compatibility scale (α = .70), I calculated the mean compatibility score of the six items for each organization in the sample for subsequent analysis (min = 1, max = 7, M = 5.61, SD = .77).
Centrality
High-centrality organizations prioritize both social and market logics and low-centrality organizations prioritize either the social or the market logic. Thus, centrality would be the highest in the middle and the lowest on either end of the continuum. To accurately reflect varied degrees of centrality, I recoded the scale such that organizations whose leaders selected 4 or values closer to 4 have higher centrality than those whose leaders selected values closer to 1 or 7.
1 = Lowest centrality: Respondents who selected 1 or 7; one logic or the other is extremely dominant in the organization.
2 = Moderately low centrality: Respondents who selected 2 or 6; one logic is moderately more dominant in their organization than the other logic.
3 = Moderately high centrality: Respondents who selected 3 or 5; one logic is slightly more dominant in their organization than the other logic.
4 = Highest centrality: Respondents who selected 4; both logics are core to organizational functioning.
As a result of this exercise, the original 7-point semantic differential scale was transformed to a 4-point interval scale where 1 = low centrality, 2 = moderately low centrality, 3 = moderately high centrality, and 4 = high centrality (see Figure 5). Based on the good reliability of the centrality scale (α = .77), I computed the mean centrality score for each organization in the sample for subsequent analysis (min = 1, max = 4, M = 2.03, SD = .81).
Predictive Validity
I used the percentage of earned income as the dependent variable and retained compatibility and centrality as two continuous variables. I controlled for basic attributes using organizational size and age. Since different legal status may put different statutory limitations on the percentage of earned income, I also controlled for an organization’s legal status. Table 6 presents the descriptive statistics and correlation matrix of all variables.
Descriptive Statistics and Pairwise Correlations (Study 2).

Note. Measure for revenue: 1 = less than $100,000, 2 = $100,000 to <$250,000, 3 = $250,000 to <$500,000, 4 = $500,000 to <$1 million, 5 = $1 million to <$10 million, 6 = $10 million to <$50 million, 7 = $50 million to <$100 million, 8 = more than $100 million. Measure for number of employees and volunteers: 1 = fewer than 10, 2 = 11 to 50, 3 = 51 to 100, 4 = 101 to 500, 5 = more than 500.
*p < .05. **p < .01.
Results (see Table 7) revealed that the degree of compatibility was negatively related to the percentage of earned income (B = −7.76, SE = 2.68, β = −.14, p < .01). In other words, SVs where social and market logics were perceived as more contradictory tended to rely more on earned income. This finding is consistent with recent experimental research, which suggests that stakeholders take a negative view of SVs manifesting elements from the business sector. People tend to be more skeptical and wary of such organizations’ dedication to social missions, which they see as in conflict with making a profit (Lee et al., 2017). However, centrality was not related to the percentage of earned income (B = 2.56, SE = 2.55, p = n.s.). In sum, the significant influence of perceived compatibility on the revenue structure provides predictive validity for the scale.
Regression Models Predicting Revenue Structure (Continuous Variables).

p < .10. *p < .05. **p < .01.
Concurrent Validity
Although t-tests suggested nonprofit SVs did not differ in their compatibility score from those registered as for-profits (t = −1.37, p = .17), their centrality score was significantly different (t = −2.18, p < .05). Specifically, nonprofit SVs had lower predicted centrality scores, indicating they prioritized one logic (i.e., social logic, as the mean score on the original 7-point scale before recoding was 2.34, left of the midpoint) more than for-profit ones. In other words, for-profit SVs exhibited higher centrality in that both social and market logics were core to organizational functioning. By contrast, social logic dominates nonprofit SVs’ core operations, creating lower centrality. Indeed, research suggests that for-profit SVs have a higher commitment to economic value creation than nonprofit ones (Litrico & Besharov, 2019; Suykens et al., 2020). This finding thus offered evidence for the concurrent validity of the scale.
Hybridity as a Categorical Variable
Alternatively, I created a categorical variable with four categories to reflect the four ideal types of hybrid organizations (see Figure 1) based on their compatibility and centrality values. Specifically, if an SV had an above-the-sample-mean compatibility score and a below-the-sample-mean centrality score, it was a dominant type (n = 108, 34.07%). Above-the-average compatibility and above-the-average centrality, below-the-mean compatibility and below-the-mean centrality, and below-the-mean compatibility and above-the-average centrality would indicate, respectively, aligned (n = 45, 14.20%), estranged (n = 68, 21.45%), and contested (n = 96, 30.28%) types (see Figure 5).
I used the dominant type, which tends to experience no internal conflict, as the base category in the model. Regression results revealed that aligned (B = 21.21, SE = 6.15, β = .63, p < .01), estranged (B = 22.88, SE = 5.38, β = .54, p < .01), and contested (B = 16.67, SE = 4.83, β = .82, p < .01) organizations had higher percentages of earned income than dominant types (see Table 8). This suggests that organizations experiencing any levels of internal conflict were more likely to have greater earned income than those experiencing no conflict. The correlation between internal conflict and percentage of earned income offers additional validity for the SMH scale. It aligns with prior research, which suggests combining commercial and philanthropic revenue may impose significant strain on SVs. For example, Battilana and Dorado (2010) found that SVs that receive both must depend on employees with different backgrounds, who may disagree about legitimate strategies to financially sustain an organization. Likewise, researchers find that stakeholders may have divergent expectations of SVs (Ebrahim et al., 2014; Pache & Santos, 2013) and see SVs that create earned income in a negative light (Lee et al., 2017).
Regression Models Predicting Revenue Structure (Categorical Variable).
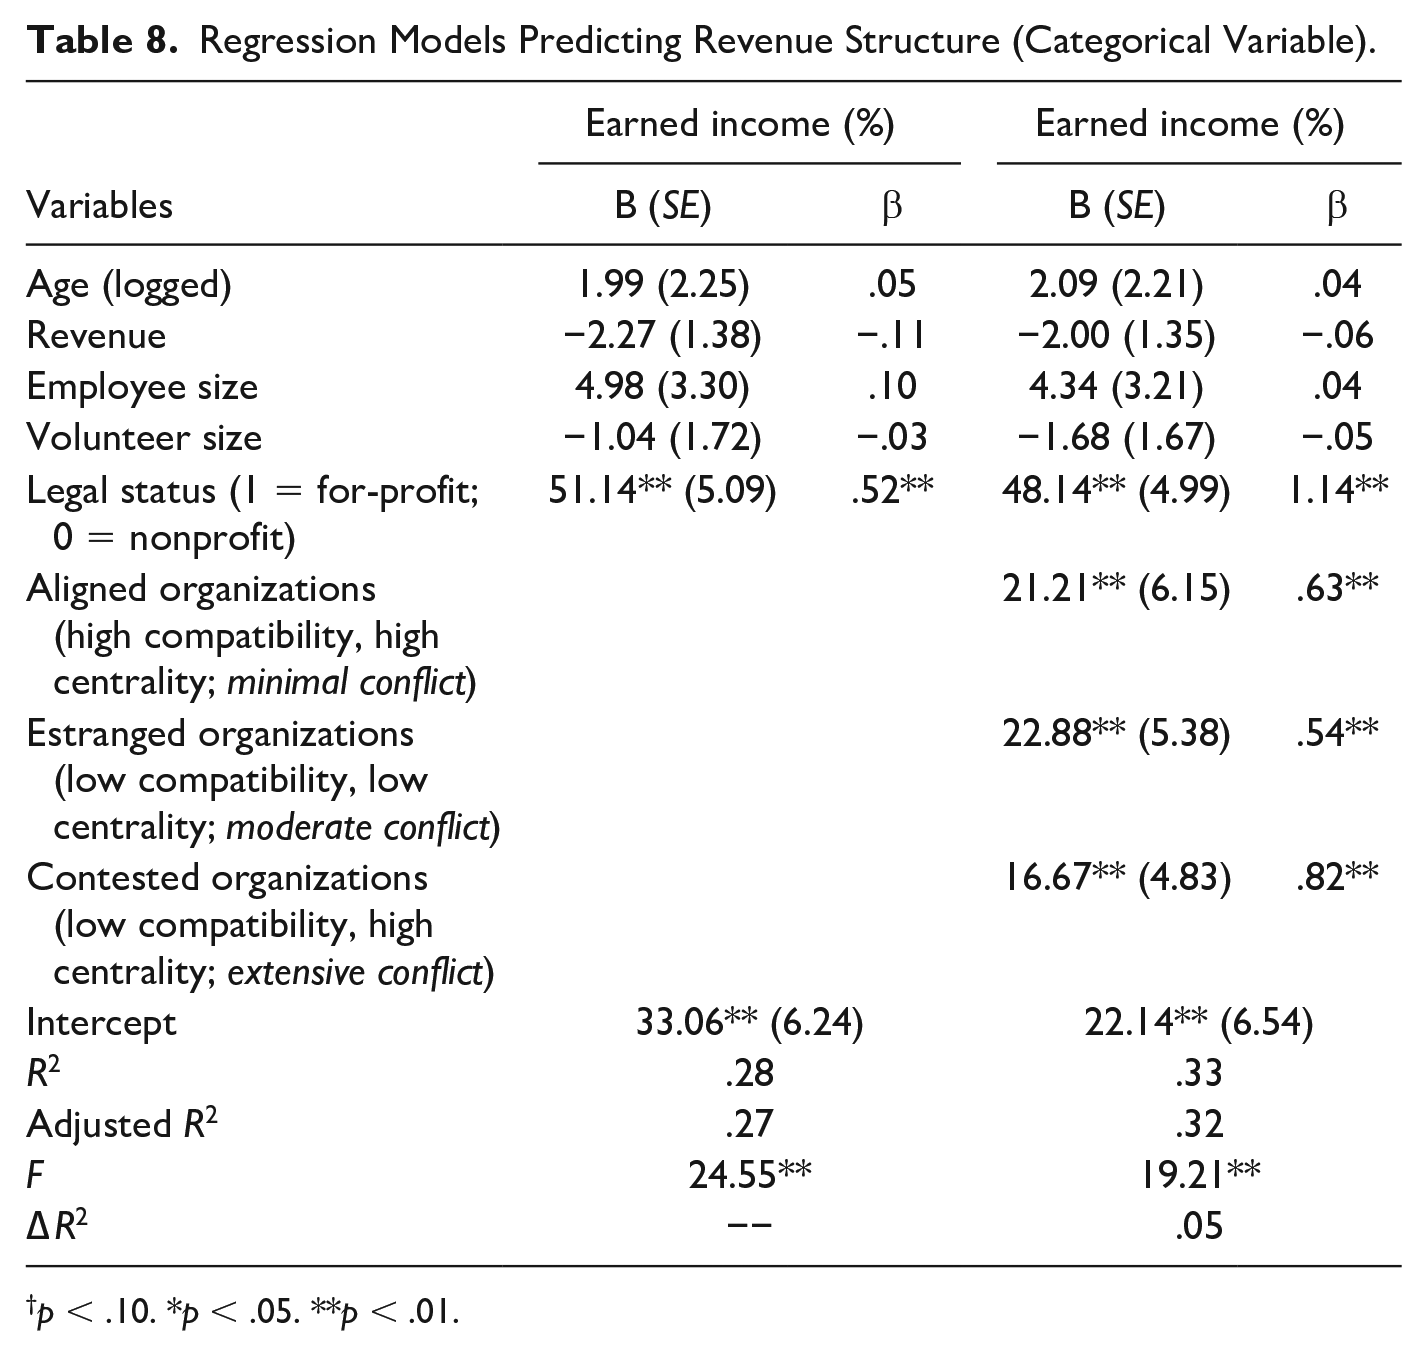
p < .10. *p < .05. **p < .01.
Summary of Study 2
In Study 2, I offered evidence of the SMH scale’s reliability and convergent and discriminant validity using a more diverse sample of SVs comprising 501(c)(3) NPOs, social enterprises, and B Corps. Moreover, I demonstrated the empirical application of the scale in two ways (see Figure 5): (a) compatibility and centrality as two continuous variables and (b) a categorical variable to represent four types of hybrid organizations. Findings revealed perceived compatibility is negatively related to an SV’s percentage of earned income through the sale of products or services, providing support for the predictive validity of the scale. Differences between SVs that registered as nonprofits versus those registered as for-profits in their centrality scores provided evidence for the scale’s concurrent validity. Table 9 presents the final SMH scale for future use.
Final SMH Scale.
Discussion
Research on SVs as hybrid organizations has gained momentum in the past three decades (see Battilana & Lee, 2014). Yet, despite recent progress in uncovering the variation in how SVs combine social and profit orientations, the lack of a perceptual scale has stalled progress in studying how social and market logics differentially manifest in and guide organizations. Because what matters for organizational action and performance is how organizational members perceive tensions (or lack thereof) in the organization (Lewis & Smith, 2014; Miron-Spektor et al., 2018), only a perceptual scale can help obtain valid insights on the variation in organizational hybridity.
Guided by the logic multiplicity typology (Besharov & Smith, 2014) and SV studies (see Table 1), I developed a reflective model of hybridity in which the latent multidimensional constructs—compatibility and centrality—manifest themselves in organizational goals and motives, beneficiaries, workforce composition, capital source, and suppliers. Following the structured scale development process (DeVellis, 2016; Hinkin, 1998), I developed a perceptual measure of SMH in SVs via two studies. In Study 1, I created a 6-item compatibility and 4-item centrality scale and showed its reliability and convergent and discriminant validity for nonprofit SVs. In Study 2, I validated the scale with a distinct sample of nonprofit and for-profit SVs and illustrated its predictive and concurrent validity.
Moreover, I demonstrated the empirical application of the scale in two distinct ways: (a) compatibility and centrality as two continuous variables and (b) a categorical variable illuminating the four types of hybrids. Study 2 also revealed that perceived compatibility is associated with the revenue structure of SVs, whereas perceived centrality is related to their legal status. The ability of the instrument to predict organizations’ revenue structure and legal status helps generate significant insight into the dynamics of hybrid and social impact organizing.
Practically, this scale provides organizational leaders with an additional diagnostic tool that can help improve their conflict management at work and “harness productive tensions” (Battilana et al., 2015, p. 1658) to enhance performance. For instance, the scale allows leaders to measure employees’ perceptions of the relationships between social and market logics, and hence devise corresponding strategies to manage divergent expectations and goals. Moreover, this scale can inform leaders’ decisions with regard to how they can configure the nature of hybridity (i.e., the degree of compatibility and centrality) in their organization. In turn this will impact key organizational outcomes, potentially serving both social and economic aims (Shepherd et al., 2019).
Future Research Directions
In this section, I discuss several research topics that can be investigated by using the SMH scale developed in this research to advance theory and empirical research.
SMH Beyond SVs
Although SVs exemplify hybrid organizations, SV is not the only context to study hybridity as a conceptual lens (Battilana et al., 2017). Opportunities arise to study the variation in hybridity in a broad set of hybrids that are also shaped by social and market logics. For instance, businesses confront inherent social-market tensions as they implement CSR programs (Hunoldt et al., 2020) and digital technologies (Alberti & Varon Garrido, 2017). Future research may apply the SMH scale beyond SVs in contexts such as business firms.
Drivers of Hybridity
The SMH scale will allow scholars to shed important light on the antecedents of variation in hybridity. Using the SMH scale, future research may examine the individual-level (e.g., relative power, ties to field-level referents), organizational-level (e.g., hiring, resource dependence), and field-level (e.g., centralization, fragmentation) drivers of hybridity (see Besharov & Smith, 2014; Greenwood et al., 2011). Understanding the antecedents to hybridity is important for organizational leaders wanting to configure how hybridity is socially constructed and framed in their organization, which will influence key organizational outcomes.
Outcomes of Hybridity
By gauging how logics variedly manifest in organizations, the scale opens up many opportunities for quantitative research to test hypotheses on how perceived hybridity influences organizational responses. Although some hybrids blend multiple logics well, thus supporting positive innovation and change, the conflict between these logics can create crises, performance failure, and even organizational demise (see Battilana et al., 2017). Future research using the SMH scale may investigate how perceived hybridity is related to outcome variables such as legitimacy, innovation, and social and financial performance. Linking hybridity with various organizational processes and outcomes will allow researchers to fully understand the challenges and opportunities in hybrids, thereby advancing a contingency theory of hybridity.
Perceptual Versus Objective Measure of Hybridity
An important research question relates to the extent to which more objective measures (Wry & Zhao, 2018) and subjective measures of hybridity are related. Preliminary findings from this research indicate that perceived SMH is related to SVs’ revenue structure and legal status. Additional analyses of the data from this research suggested perceptual measures and concrete organizational measures of SMH may or may not be related (see Supplemental Appendix F). This suggests that there could be important differences between the two; perceptions of hybridity may not align with organizations’ material practices. Future research may integrate perceptual measures with objective data to evaluate hybridity.
Hybridity at Other Levels of Analysis
In this research, I surveyed organizational leaders as representatives of their organization. Although additional tests revealed that leader attributes (i.e., position, tenure, sector, managerial experience) were not related to perceived compatibility or centrality (see Supplemental Appendix E), members in different roles and across subunits may have vastly different perceptions of organizational hybridity (Binder, 2007; Waeger & Weber, 2019). This, in itself, may be an indicator of conflict, factions, and low centrality in organizations. As perceived organizational-level hybridity may not represent organizational-wide hybridity, future research may maximize insights into variations of hybridity through distributing the scale among organizational members. Moreover, the development of the SMH scale will facilitate research of individuals and subunits within an organization. For instance, research may examine how perceived hybridity influences employee creativity at the individual level of analysis or how perceived hybridity in work teams influences network development at the group level.
A Global Scale
Scholars have studied SVs in a variety of institutional contexts (e.g., France, Italy, Germany), highlighting the embeddedness of organizational activity in the national socioeconomic, sociopolitical, and sociocultural contexts (Desa & Basu, 2013; Wry & Zhao, 2018). Hence, carriers of social and market logics could be different depending on their legal and market infrastructure, belief systems, and cultural norms. Thus, additional scale development efforts are needed to capture SMH beyond the U.S. context. More comparative research is necessary to make meaningful comparisons and generalize findings across institutional contexts.
Longitudinal Research
Future research may also use longitudinal design to trace how perceived hybridity changes over time. In fact, recent studies have started to embrace a dynamic approach to theorizing how organizations sustain hybridity over time (Litrico & Besharov, 2019; Smith & Besharov, 2019). Such studies may shed new light on why and how hybridity is subject to reconfiguration and the implications for organizational structure, action, and change.
Limitations
The SMH scale is of great theoretical and practical relevance, but it has several limitations. First, although it captures many indicators of social and market logics, it does not measure all organizational domains such as culture or governance mechanisms (Battilana & Lee, 2014). Having a larger item pool may increase the probability of getting the best items out of the data. Relatedly, future research may explore other conceptual dimensions that specify the interrelationship among logics, such as integration (Litrico & Besharov, 2019), to add nuance to the variation in organizational hybridity beyond compatibility and centrality dimensions.
Second, although I followed the best practices in survey research to enhance response rate (e.g., sending follow-up questionnaires and reminder emails, giving participants an option to fill out the questionnaire online), each study had a response rate smaller than 34%, making them sensitive to threats of nonresponse biases (see Fulton, 2018). Although I performed several nonresponse bias tests on key organizational demographics using archival data, I was not able to perform other tests, such as comparing survey response time or using response patterns. Thus, this research may still “contain significant nonresponse bias and thus produce biased estimates of means/proportions, variances, and correlations” (Fulton, 2018, p. 260).
Third, for the centrality factor, although I ruled out this possibility (see Appendix F), it is still possible that respondents who selected the midpoint did not have a preference for the degree of mixing of multiple logics. Future research may explicitly add an explanation for the meaning of midpoint value 4 (i.e., both orientations are prioritized) in the centrality question prompt.
Finally, this scale cannot capture more than two logics, nor can it directly capture hybridity that comes from the combination of logics other than social and market logics. Future research may collect more recent data and adapt the scale to further refine the 10 items, particularly those with marginally satisfactory factor loadings (e.g., incompatibility items #3 capital source and #4 workforce composition), to other types of hybrid organizations in different contexts, sectors, and organizational domains and fields (e.g., health care, arts, biotechnology, education).
Conclusion
In conclusion, this research takes an important step toward developing a measurement scale of hybridity to uncover the nuances in how social and market logics instantiate in SVs of varying degrees. This will open up new opportunities to facilitate more robust theoretical models to systematically examine how hybridity affects varied organizational structures, processes, and outcomes. This instrument can be fruitfully applied to assess how organizations variably embody social and market logics in a broad set of hybrids beyond SVs and to take account of variation in hybridity across organizational members and units, across institutional contexts, and over time. Insights in this vein will not only improve our understanding of hybrid organizing but also refine and advance our knowledge of institutional, entrepreneurship, and organizational theory broadly.
Supplemental Material
sj-docx-1-bas-10.1177_00076503231167569 – Supplemental material for Social-Market Hybridity in Social Ventures: Scale Development and Validation
Supplemental material, sj-docx-1-bas-10.1177_00076503231167569 for Social-Market Hybridity in Social Ventures: Scale Development and Validation by Jiawei Sophia Fu in Business & Society
Footnotes
Acknowledgements
The author would like to thank Drs. Michelle Shumate, Noshir Contractor, Edward (Ned) Smith, Klaus Weber, Shipeng Yan, Vikki Katz, Sophie Bacq; three anonymous reviewers; the MIT Work and Organization Studies group; the USC Annenberg Networks Network group; and participants of the 2019 Third Workshop on Responsibility, Sustainability, and Social Entrepreneurship: The Cutting Edge of Hybrid Organizations for their guidance and constructive comments on earlier drafts of this manuscript. This research is a winner of the 2017 National Science Foundation Doctoral Dissertation Research Improvement Grant and the 2019 Best Social Entrepreneurship Paper Award of the Entrepreneurship Division of the Academy of Management Annual Conference. This article is part of the author’s dissertation research, which was the winner of the 2020 Gabriel G. Rudney Memorial Award for Outstanding Dissertation Research of the Association for Research on Nonprofit Organizations and Voluntary Action, winner of the 2019 W. Charles Redding Dissertation Award of the Organizational Communication Division of the International Communication Association, and winner of the 2019 Gerald R. Miller Outstanding Doctoral Dissertation Award of the National Communication Association.
Declaration of Conflicting Interests
The author declared no potential conflicts of interest with respect to the research, authorship, and/or publication of this article.
Funding
The author disclosed receipt of the following financial support for the research, authorship, and/or publication of this article: For financial support, I thank the Decision, Risk, and Management Sciences division of the National Science Foundation (SES-1730079), Northwestern University’s The Graduate School Graduate Research Grant, Northwestern University School of Communication dissertation grant, and Rutgers School of Communication and Information startup funding.
Supplemental Material
Supplemental material for this article is available online.
Notes
Author Biography
References
Supplementary Material
Please find the following supplemental material available below.
For Open Access articles published under a Creative Commons License, all supplemental material carries the same license as the article it is associated with.
For non-Open Access articles published, all supplemental material carries a non-exclusive license, and permission requests for re-use of supplemental material or any part of supplemental material shall be sent directly to the copyright owner as specified in the copyright notice associated with the article.