
Abstract
In this study, the author examines the effects of three forms of gentrification—demographic shifts, private investment, and state intervention—on gang-motivated homicides in Chicago from 1994 to 2005 using data from the U.S. Census, the Chicago Police Department, business directories, and the Chicago Housing Authority. The findings suggest that demographic shifts have a strong negative effect on gang homicide. Private investment gentrification, measured here as the proliferation of coffee shops, has a marginally significant and negative effect on gang homicide. In contrast, state-based gentrification, operationalized as the demolition of public housing, has a positive effect on gang homicide.
In the 1990s and early 2000s, Chicago, like other U.S. cities, experienced two simultaneous trends: rapid gentrification and a remarkable crime decline. Together these trends prompt an empirical question important for urban studies, criminology, and public policy alike: What is the relationship between gentrification and urban crime? Although some recent research finds a negative relationship between gentrification and neighborhood crime (Kreager, Lyons, & Hays, 2011; Papachristos, Smith, Scherer, & Fugiero, 2011), other studies find a positive relationship (Lee, 2010; Van Wilsem, Wittebrood, & De Graaf, 2006). I suspect that these divergent research findings are associated with the difficult task of measuring complex gentrification processes and diverse crime outcomes. On one hand, forces gentrifying neighborhoods vary: private economic development gentrifies neighborhoods, but so does state intervention. On the other hand, not all crimes are alike; for example, a violent crime index lumps together homicides, aggravated assaults, robberies, and rape. In other words, we often speak of gentrification and crime as though they are clearly defined and circumscribed social phenomena when, in fact, both are incredibly complex.
The goals of the present study are two-fold. First, I unpack gentrification by looking at three different types of gentrification: (a) private economic investment, gentrification that assesses property potential based on neighborhood demographics—measured here as the proliferation of neighborhood coffee shops; (b) forced state intervention, a more controversial type of gentrification that turns over public lands to private investors under the guise of urban revitalization—measured here as public housing demolition; (c) changing demographic composition, the in-migration of particular residents and their resources into previously poorer neighborhoods—measured here through census factors of recently moved residents in mostly White neighborhoods and socioeconomic status (SES). The second goal of this study is to disaggregate violent crime to examine specifically gang-motivated homicides. Although some prior work demonstrates a general negative association between gentrification and violent crime, gang homicides exhibit important differences that may make neighborhoods with gang violence less susceptible to one form of gentrification over another.
Results from longitudinal count models suggest that different forms of gentrification have varying effects on gang homicide. Whereas demographic shifts that accompany gentrification and the proliferation of neighborhood coffee shops decrease gang homicides, public housing demolition gentrification actually increases gang homicides. This study proceeds in three parts. First, I offer a brief review of the research on gentrification and its relationship to crime. Second, I describe data sources and variable construction. Third, I present descriptive and longitudinal analyses that test the relationship between gentrification and neighborhood levels of gang homicide.
Gentrification and Chicago
Although not without debate, the term gentrification generally refers to a temporal and spatial churning process of higher income households directly and indirectly displacing lower income households changing the character and composition of a neighborhood (Glass, 1964; Lees, Slater, & Wyly, 2008). Research on gentrification tends to examine the unique characteristics of gentrifiers, the different stages of gentrification, the controversial displacement of the gentrified, and the political and economic forces pursuing gentrification as a viable mechanism of urban change. Theoretically, we think of gentrification as several different, but related, processes of production, consumption, and globalization (Lees et al., 2008). Production theories suggest that property values spur gentrification, often in the forms of “rent gaps” when properties are not generating their maximum rent potential (Smith, 1979, 1996). Consumption theories focus on the unique demographics of gentrifiers, specifically their higher education, income, tastes, and tolerance (Kennedy & Leonard, 2001; Lees et al., 2008). This demographic of gentrifiers is often accompanied by particular high-end neighborhood retail (Simon, 2009; Zukin et al., 2009). Globalization theories of gentrification stress the interplay of global, national, city, and community level forces as neighborhoods vie for global capital flows (Abu-Lughod, 1999; Lees et al., 2008). Based on these theoretical discussions, I consider two distinct indicators of gentrification in Chicago that are new to quantitative gentrification research. First, based on production and consumption theories of gentrification, I consider the proliferation of coffee shops to indicate exogenous private actors assessing the consumption demands of gentrifiers. Second, from a political economy perspective, I consider the demolition of public housing to indicate forced displacement by the state with racialized consequences.
Gentrification through private investment: Coffee shops
High-end retail emerging in previously poor neighborhoods is not random; it is indicative of a form of neighborhood change that requires profitable locations near a certain class of consumers. One such example of high-end retail is coffee shops. In Chicago, the number coffee shops multiplied in the 1990s as coffee shop giants and private entrepreneurs procured convenient storefronts in neighborhoods with residents willing and able to pay US$3 for a cup of coffee. Coffee shops imply an erudite culture and conspicuous consumption (Roseberry, 1996; Simon, 2009)—statuses desired to complement gentrifiers’ tolerance, tastes, and diversity. Starbucks, especially, attempts to market around sophisticated ideals of community and global awareness (Simon, 2009). An example of this type of private investment gentrification is found in the Chicago neighborhood of Wicker Park. What was once a mostly Puerto Rican neighborhood with a notorious gang problem has become a vibrant commercial district of boutiques, music venues, coffee shops, yoga studios, and art galleries (see Lloyd, 2006). This form of gentrification is dramatically different from the demolition of public housing.
Gentrification through state intervention: Public housing demolition
Gentrification is often cloaked as a policy solution that is beneficial for impoverished communities because of the inflow of new monetary resources; the end result tends to be the displacement of poorer and racial minority populations (Hyra, 2008; Rymond-Richmond, 2007; Smith, 1996). The process of public housing demolition and replacement with mixed-income housing perfectly reflects the churning process of the gentrification definition. However, unlike the exogenous private investment decisions driving the proliferation of coffee shops, state power and global capital drive the demolition of public housing. Public housing in Chicago has been considered the worst managed in the United States, and the notorious Chicago Housing Authority has been involved in high-profile lawsuits over the racial segregation of its public housing (Abu-Lughod, 1999; Popkin, Gwiasda, Olson, Rosenbaum, & Buron, 2000). The city’s response to the public housing crisis has been to cash in on the potentially profitable addresses by selling public lands to private investors at rock-bottom prices (Miller, 2008).
Cabrini-Green is a nationally recognized icon of public housing and its consequences of disinvestment and concentrated disadvantage. Cabrini-Green residents were predominantly poor Blacks living in isolated poverty surrounded by the extreme wealth of the Gold Coast neighborhood. The projects gained the reputation of being crime-ridden after several high-profile murders such as the 1992 murder of 7-year-old Dantrell Davis who was killed on his way to school by a stray bullet. Cabrini-Green demolition began in 1999 and continued through 2010 (Miller, 2008; Wyly & Hammel, 1999). Gentrification has displaced the poverty formerly found in Cabrini-Green, and now the neighborhood is beginning to resemble more of the affluence found in the adjacent Gold Coast neighborhood with new condominiums and a Starbucks standing across from high-rise demolition sites (Hyra, 2008).
Toward the end of the gentrification process, Wicker Park and Cabrini-Green appear affluent and revitalized; however, different forms of gentrification brought them to that point. 1 This distinction is important when looking at the relationship between gentrification and crime because high-crime neighborhoods might repel one type of gentrification while being more susceptible to another. Crime has declined in Wicker Park and Cabrini-Green, yet the mechanisms through which the crime decline occurred may have been quite different.
Gentrification and Crime
In spite of the fact that very little gentrification research examines crime outcomes, politicians and developers claim public safety and neighborhood improvement as justification for gentrification. Yet, empirical work testing the relationship between gentrification and crime has produced contradictory results across cities. On one hand, several studies find that gentrification increases crime; on the other hand, several studies find that gentrification decreases crime. These contradictory results support various criminological perspectives, which further complicate the understanding of the relationship.
Social control theories aver that gentrification should increase crime. Neighborhood change impedes the ability of a community to exert formal and informal social control (Bursik & Grasmick, 1993). In this vein, quantitative analyses of Baltimore from 1970 to 1980 (Covington & Taylor, 1989; Taylor & Covington, 1988) and more recently of the Netherlands (Van Wilsem et al., 2006) and Los Angeles (Lee, 2010) find that gentrification increases property and violent crime. Consistent with the social disorganization perspective (Shaw & McKay, 1942/1969), these researchers maintain that gentrification disrupts a community’s ability to maintain informal social control through the weakening of prior residents’ social networks and the absence of ties with new wealthier residents. However, the relationship between gentrification and crime might not be unidirectional. KreagerKreager and colleagues’ (2011) study of gentrification in Seattle finds that initial increases in property crime during early stages of gentrification preceded a later decline in property crime. They suggest a curvilinear effect of gentrification on property crime (but not on violent crime) as gentrified neighborhoods settle and reorganize (Kreager et al., 2011). In this sense, gentrification initially disrupts social control but only in the short term (see also Lee, 2010).
Other researchers align with the ecological dissimilarity framework of social control theories to explain that gentrification and its effects on crime are uneven across neighborhoods. According to the ecological dissimilarity framework, neighborhoods are not equal even when controlling for individual level characteristics (Sampson & Bean, 2006). Although gentrification is a process of advantage, it is an advantage experienced by some neighborhoods more than others—specifically predominantly White neighborhoods more so than predominantly Black neighborhoods. Papachristos et al. (2011) find gentrification had a negative effect on homicides and robberies in Chicago from 1991 to 2005, but this effect was mostly confined to White and Hispanic gentrifying neighborhoods. Homicides also declined in Black gentrifying neighborhoods, but robberies actually increased with gentrification (Papachristos et al., 2011).
In addition to this issue of divergent findings in the gentrification and crime research, there is also the issue that these studies treat crimes alike with a distinction only between violent and property crimes (with the exceptions of Lee, 2010, and Papachristos et al., 2011). For example, some of the previous studies use violent crime indices that collapse murder, manslaughter, rape, aggravated assault, and robbery into a single measure. Yet, a long line of research in criminology suggests that disaggregated crime reveals significant patterns pertaining to neighborhood structural conditions and processes (see Peterson & Krivo, 1999). Consistent with the criminological tradition of disaggregating crime data to better identify subgroups driving trends (Blumstein, 2000), this analysis focuses specifically on gang homicides.
Gang homicide differs from total homicide in several ways: Gang homicides more frequently involve firearms, offenders and victims are more likely to be minority males, gang homicides are more likely to occur publicly on the streets and in cars, and gang homicides are more likely to affect innocent bystanders (Block & Block, 1993; Robinson et al., 2009). Importantly, gang homicides are concentrated in particular Chicago neighborhoods (Papachristos & Kirk, 2006). Research continually demonstrates that gangs are community-level phenomena and should be understood in the neighborhood context (Katz & Schnebly, 2011; Pattillo, 2007; Rymond-Richmond, 2007; Venkatesh, 1997). The ecological dissimilarity framework proposes that gang homicide neighborhoods experience urban change, interventions, and investments differently than neighborhoods not characterized by gang homicides. Economic and political forces respond to ecological dissimilarities and, thus, intensify the dissimilarity more so. The headlines, stigmatization, and outcry against high gang-homicide neighborhoods promote a particular type of reaction from the state, often in the form of tough on crime politics targeting public housing. Extensive ethnographic research in Chicago links gangs to high-rise public housing as well as linking the demolition of public housing to increased gang conflict and fear of relocation (Hagedorn, 2008; Rymond-Richmond, 2007; Venkatesh, 1997). However, to the best of my knowledge, no quantitative study has assessed the extent to which the demolition of public housing contributes to gang violence. 2
I propose two competing hypotheses for the relationship between gentrification and gang homicide. Hypothesis 1 conceptualizes gentrification in terms of the shifting demographics of the residential population, as measured by Census factors, and in terms of private economic investment, as measured by the proliferation of coffee shops. Hypothesis 2 conceptualizes gentrification in terms of forced state intervention, as measured by the demolition of public housing. I ground these hypotheses in the ecological dissimilarity framework that assumes unequal outcomes across neighborhoods.
Hypothesis 1: Gentrification in the form of demographic change and coffee shops has a negative effect on gang homicides over time.
Hypothesis 2: Gentrification in the form of public housing demolition has a positive effect on gang homicides over time.
I proceed with my data and analysis to test the impact of gentrification on gang homicides at the neighborhood level across the city of Chicago from 1994 to 2005.
Data and Method
This project relies on four data sources: Chicago Police Department homicide records, the U.S. Census, Chicago business directories, and Chicago Housing Authority’s Moving to Work Reports. 3 I discuss each of these in turn as they relate to variables of interest.
Chicago neighborhood clusters over time
Almost all of the previous quantitative gentrification and crime research has relied on census tracts as the unit of analysis. This study differs by employing the 342 neighborhood clusters identified by the Project on Human Development in Chicago Neighborhoods (Earls, Brooks-Gunn, Raudenbush, & Sampson, 2007). 4 These neighborhood clusters combine the 847 census tracts of Chicago. Given the rarity of gang homicides as an event and the low neighborhood counts of coffee shops and public housing sites in Chicago, aggregating to the neighborhood cluster reduces the number of zeros in the analysis and, therefore, minimizes some of the overdispersion in the distribution of key variables. The unit of time in this analysis is 3-year periods from 1994 to 2005, totaling four time periods: 1994-1996, 1997-1999, 2000-2002, and 2003-2005. Data availability determined this time frame. These 3-year periods reduce the number of zeros in counts and provide a buffer against data errors while still maintaining temporal order. The unit of analysis is neighborhood cluster per 3-year period yielding n = 1,368.
Gang-motivated homicide
The dependent variable for this analysis is the total number of gang homicides in a neighborhood. These data include all homicides for which the Chicago Police Department attributed the incident as being gang motivated. Gang-motivated homicide is a conservative measure and adequately conceptualizes the spatial concentration of gang violence (Papachristos & Kirk, 2006; Rosenfeld, Bray, & Egley, 1999). Homicide data have several advantages over the use of other crime measures because there is a close match between known homicides and the true number of homicides, and homicide is less susceptible to definitional variation by the police. The 3-year gang homicide count variable ranges from 0 to 22 with a neighborhood cluster mean of 2 gang homicides.
Census measures
Wyly and Hammel (1999), who provide some of the most comprehensive quantitative gentrification indicators, state, “gentrification is notoriously difficult to measure” (p. 726). Though census variables can measure neighborhood change, they are unable to assess the demographic composition of those moving in and out of neighborhoods and whether displacement occurs—features that are central to the definition of gentrification. Furthermore, the decadal limitation of census variables masks annual neighborhood fluctuations, such as a year during which massive public housing relocation occurs. However, census measures offer important controls to this analysis and factor loading allows for indicators more consistent with the definition of gentrification. 5 To begin, I generated linear interpolations of the 1990 census measures on the 2000 census measures for the four 3-year periods. From these interpolations, I used principal components factor analysis to produce two composites: mobile White population and SES. Table 1 presents the composites, census indicators, and factor loadings.
Factor Loading of Census Variables.

Three census variables—percentage of population that moved to the neighborhood in past 5 years, percentage of population that is Black, and percentage of the population that was foreign born—loaded on a single factor I call “mobile White population.” This factor describes neighborhoods with a high proportion of non-Black and non-foreign-born residents who have recently moved to the neighborhood. This factor supposes the mobility feature of the gentrification definition. Katz and Schnebly (2011) find that neighborhoods characterized by high residential mobility corresponded with low concentrations of gang members. The second factor, SES, loads on the percentage of new housing built in the past 5 years, the percentage of the population with a bachelor’s degree, and the logged mean family income. Gentrifying neighborhoods experience population turnover often through the influx of White, well-educated individuals with higher levels of income. 6 Consistent with Hypothesis 1, I expect mobile White population and SES to be negatively associated with gang homicides in a neighborhood.
Coffee shops
I use coffee shops as an indicator of private investment gentrification to supplement the census factors and examine a different form of gentrification. My colleagues and I coded coffee shop data from listings in annual Chicago business directories. 7 Coding included address, year, coffee shop name, and type of coffee shop. 8 The variable is based on a 3-year average to limit data errors. The average number of coffee shops per neighborhood ranges from 0 to 38 with 0 coffee shops in 277 out of the 342 neighborhood clusters over the entire 12 years of analysis. Because of the large number of 0s, the neighborhood mean number of coffee shops is less than 1. The regression models include the lagged coffee shop averages, which assume the temporal ordering of coffee shop growth gradually affecting later crime rates. I have no reason to believe that the opening of a coffee shop results in immediate gang violence or immediate gang displacement, but it is important that I distinguish temporal order when it is theoretically valid to do so to avoid reverse interpretation of decreasing crime rates increasing private investments (see O’Sullivan, 2005). I assume coffee shops act as a proxy of a particular form of gentrification rather than the isolated mechanism driving down crime rates (see Papachristos et al., 2011). 9
Public housing demolition
Whereas coffee shops approximate private investment gentrification, public housing demolition is a form of forced state intervention gentrification. The necessary spatial and temporal data on Chicago’s public housing projects are available through the Chicago Housing Authority’s Annual Moving to Work Reports (Chicago Housing Authority, 2010). In the appendix of each annual report is a table containing all of the proposed, begun, and completed demolition of public housing by address. From these appendices, I created a dummy variable for the neighborhood clusters experiencing the beginning of public housing demolition. According to the Chicago Housing Authority, major public housing demolition began between 2000 and 2001.
Annual data on the beginning of demolition approximate residential displacement. I do not lag this variable in the analysis because the qualitative literature shows an immediate effect of displacement and gang turf disruption on gang violence (Hagedorn, 2008; Rymond-Richmond, 2007). There is a risk of endogeneity with the inclusion of this variable, as gang homicides and public housing are highly concentrated in areas of disadvantage. Unfortunately, a proportion of number of units demolished to the total public housing units was not available with these data; this means that within a single neighborhood cluster, there could be demolition and public housing. Of the 342 neighborhood clusters, public housing was present in 21, and demolition began in 17 during the observation window. I capture the demolition process in two ways. First, I created a dummy variable (1 = demolition) for every neighborhood that began public housing demolition during the third and/or fourth 3-year period. The control group is every neighborhood with no public housing plus every public housing neighborhood that did not begin demolition during that time. This dummy is zero for all neighborhoods in the two time periods before year 2000. Second, I generated a series of 17 dummy variables for each of the 17 neighborhoods experiencing public housing demolition to isolate the fixed effect of individual neighborhoods on the gang homicide outcome. The control group for each of these 17 dummies is every neighborhood except for the individual demolition neighborhood.
Results
Descriptive analyses
Figure 1 presents stacked line graphs of total homicides, total gang homicides, and total coffee shops in Chicago from 1994 to 2005. Consistent with national trends, Figure 1 shows an overall decline in Chicago homicides ranging from 928 homicides in 1994 to 448 homicides in 2005. However, the gang homicide line is much more sporadic and nonmonotonic. There were 209 gang homicides in Chicago in 1994 followed by an increase in 1995 and 1996. After 1996, we see a decrease in gang homicides until 2001 when there was a spike up to the two highest points in the gang homicide line. Gang homicides gradually dropped to 154 by 2005. Comparing these first two trend lines suggests that mechanisms driving down total homicides may not have had the same effect on gang homicides. In fact, the proportion of gang homicides comprising the total homicides increased during this time. In 1994, gang homicides comprised 23% of Chicago’s total homicides, in 2005 gang homicides comprised 34% of Chicago’s total homicides. The highest proportion was in 2002 when gang homicides comprised 46% of Chicago’s total homicides—almost half of the city’s total. Although total homicide dropped, the number of coffee shops more than tripled from 61 coffee shops in 1994 to 225 coffee shops in 2005. The gray-shaded areas in Figure 1 indicate public housing demolition beginning in 2000. Demolition appears to correspond with the spike in gang homicides when analyzed at the city level.

Stacked line graphs of total homicides, total gang homicides, and total coffee shops per year in Chicago, 1994 to 2005.
To test whether neighborhoods with high gang homicides are the same neighborhoods with high number of coffee shops, I employed Spearman’s rho tests, which test correlations between rank-ordered variables. 10 These tests suggest that coffee shop neighborhoods and gang homicide neighborhoods are negatively correlated albeit weakly (Spearman’s rho ranges from −0.18 to −0.24). However, the ranks are stable. Top coffee shop neighborhoods remain top coffee shop neighborhoods over time (Spearman’s rho ranges from 0.67 to 0.71), and high-gang-homicide neighborhoods remain high-gang-homicide neighborhoods over time (Spearman’s rho ranges from 0.56 to 0.64). This suggests that although these two phenomena might cross paths in a neighborhood, one high rank will not overcome the other high rank within the same neighborhood. This inverse relationship between coffee shops and gang homicide is also visible in the geographic representation of Chicago by neighborhood cluster in Figure 2.
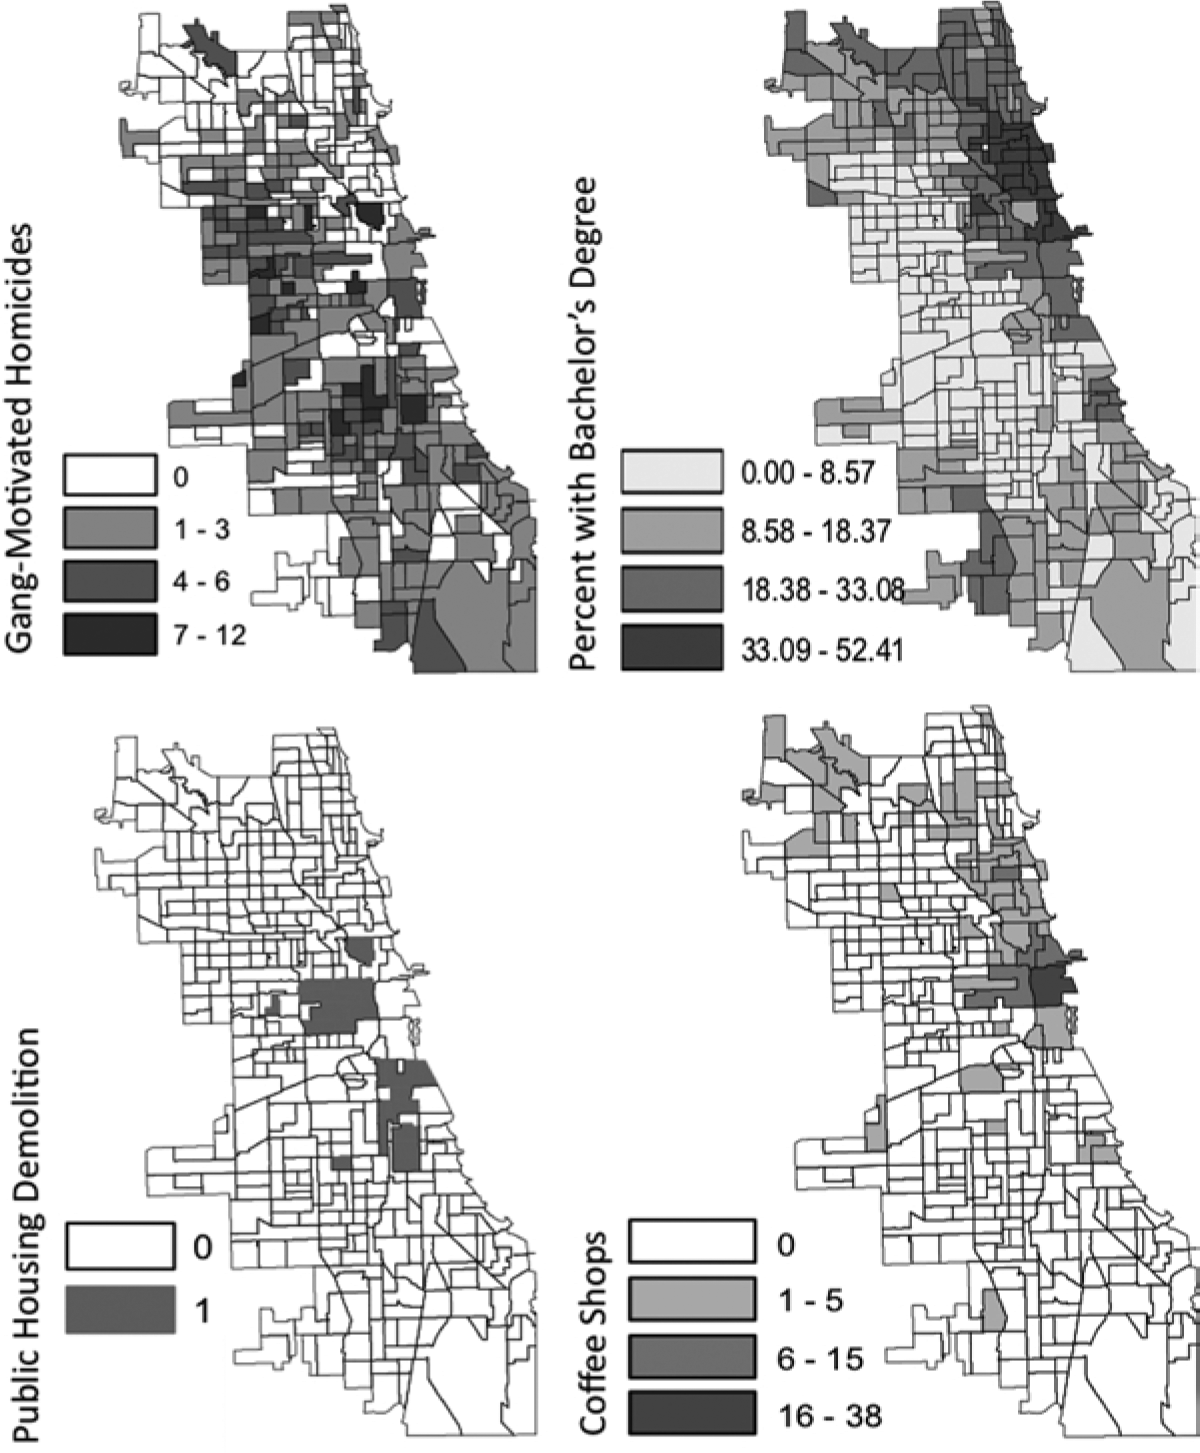
Maps of Chicago depicting the spatial distribution of total gang homicides 2003-2005, percentage of population with bachelor’s degree 2000, public housing demolition 2000-2005, and average coffee shops 2003-2005.
Figure 2 displays the geographic distribution of several key variables. In the upper left panel of Figure 2, the dark areas representing high-gang-homicide neighborhoods contrast with the dark areas of high percentage of bachelor’s degree in the upper right panel and dark areas of high average coffee shops in the lower right panel. These maps make clear that some forms of gentrification (coffee shops and human capital) cluster in neighborhoods different than gang homicides. Public housing demolition neighborhoods are the most spatially concentrated of these select variables and have a less clear pattern when compared with gang homicides, percentage of bachelor’s degree, and coffee shops.
In 2003 to 2005, the citywide mean of gang homicides was 1.73, whereas the public housing demolition neighborhoods with no coffee shops had a mean of 3.00 and the top coffee shop neighborhoods had a mean of 0.74. Of all the 21 public housing neighborhoods, 14 of them did not gain a single coffee shop from 1994 to 2005. This suggests that the scene of coffee shops opening across from public housing demolition sites, such as the Cabrini-Green example, is more of an exception than the rule. These descriptive analyses suggest that the concentration of coffee shops versus the concentration of public housing demolition are ecologically dissimilar neighborhoods, and, thus, as explanatory variables are likely to have divergent effects on gang homicides.
Longitudinal analysis
Table 2 presents a series of six models testing the effects of different indicators of gentrification on changes in gang homicide over time using longitudinal negative binomial regression with random effects. These models are ideal for analyzing count data as they correct for the overdispersion of a highly skewed distribution and large number of zeros in the dependent variable (Cameron & Trivedi, 1998; Long & Freese, 2006) and are especially well suited for analyzing crime data (Osgood, 2000). Furthermore, longitudinal models allow for modeling gentrification as a process over time rather than a singular event or singular change. Population is used as an exposure term in all models, which effectively assumes comparable rates. All models include a dummy variable to control for the effect of the Loop, Chicago’s central business district, which is an exceptional case with the highest number of coffee shops in the city (for further discussion, see Kubrin, Squires, Graves, & Ousey, 2011).
Longitudinal Negative Binomial Regression Models Predicting Gang-Motivated Homicides in Chicago, 1994 to 2005.

Note. Standard errors are listed in parentheses. n = 1,368, the 342 neighborhood clusters during four time periods for Models 1, 2, 4, and 5. n = 1,026, the 342 neighborhood clusters during three time periods for Models 3 and 6.
Seventeen separate dummy variables created for each neighborhood experiencing demolition. The reference category is no public housing demolition begun. Only the five significant coefficients are included in the table.
A dummy variable for the central business district. Reference category is all other neighborhoods.
Dummy variables for the four 3-year time periods. Period 2003-2005 is the reference category.
p < .1. **p < .05. ***p < .01. ****p < .001.
Model 1 is a base model including the three types of gentrification—changing demographics, coffee shop growth, and public housing demolition. Models 2 and 5 add in time period dummy variables to test for city-level period effects on gang homicide net of all other variables in the model. Models 3 and 6 drop the period effect dummies to introduce the lagged dependent variable. One of the best predictors of crime outcomes is the previous crime rate (Morenoff, Sampson, & Raudenbush, 2001), and including the lagged gang homicide count tests the robustness of the gentrification measures and improves model fit. Models 1 to 3 use the demolition dummy variable in which 1 equals demolition and 0 equals no demolition. In contrast, Models 4 to 6 test the 17 individual public housing demolition variables that isolate the fixed effect by neighborhood. In all six models, the public housing demolition variables are not lagged because of the qualitative finding of the simultaneity of public housing demolition and increased gang conflict. This means that the models need not account for the passage of time for this explanatory variable. In contrast, I use lagged coffee shops in all of the models because we have no evidence suggesting that the building of coffee shops is contemporaneous with gang homicides. Furthermore, the use of lagged coffee shops allows for the interpretation of temporal causality and is indicative of more gradual neighborhood change affecting gang homicides rather than the reverse (see also Kreager et al., 2011).
As both of the census factors increase, mobile White population and SES, the number of gang homicides significantly decreases per neighborhood cluster over time. These relationships are remarkably stable across all the models shown in Table 2 and maintain coefficient size when other variables are added. These coefficients suggest that the mobility of White, U.S.-born residents into neighborhoods (a population shift often associated with gentrification) decreases gang homicide over time. Similarly, the increase of SES has a negative effect on gang homicide over time. This second factor is similar to the notion of concentrated advantage, but it is especially relevant to the changing income bracket and high educational attainment of gentrifiers. The census factors support Hypothesis 1 that gentrification’s demographic change decreases gang homicide over time.
Lagged coffee shops also have a negative effect on gang homicide over time, but the effect is only marginally significant even when controlling for the central business district. Because the descriptive analysis showed gang homicide neighborhoods are not coffee shop neighborhoods, I had expected the coffee shop measure to have little explanatory power with regard to the number of gang homicides. The coffee shop effect becomes insignificant when including lagged gang homicide in the model. Pertaining to Hypothesis 1, it appears that coffee shops, as a form of private investment gentrification, marginally decrease gang homicide over time.
The noteworthy contribution of these models is the effect of public housing demolition on gang homicide over time. In Models 1 to 3, the overall public housing demolition dummy variable has a positive and significant effect on gang homicide. This effect persists even when controlling for prior gang homicide. 11 When isolated in Models 4 to 6, demolition’s positive effect holds up marginally in 5 of the 17 neighborhoods and strongly in 3 of the 17 neighborhoods. In support of Hypothesis 2, public housing demolition significantly increases gang homicide over time. This positive effect is noteworthy because gang homicide was decreasing before demolition began and the increase appears contemporaneous with the demolition of public housing even when controlling for prior gang homicide and city-level period effects.
The control variables (the Loop, period effects, and prior gang homicides) test the strength of the gentrification effects. The Loop is marginally significant and positive compared with all other neighborhoods, but this effect becomes insignificant when controlling for lagged gang homicide. The period effects show that something occurred at the city level during the 1994-1996 period and the 2000-2002 period that significantly increased gang homicide compared with the 2003-2005 period net of all other variables. The 1997-1999 period is not significantly different from the 2003-2005 period. These period effects show that at the city level, gang homicides were curvilinear. Most importantly, the gentrification effects are stable even when including period effects. However, the coffee shop and public housing demolition gentrification effects drop in significance (but do not change in direction) when controlling for prior gang homicide, even though the prior gang homicide variable is only significant in Model 3 and not in Model 6.
Discussion
This analysis captures a unique historical moment in Chicago, 1994 to 2005, a period of increased gentrification and overall crime decline. The current economic situation in the United States has stagnated urban growth: Coffee shops are no longer multiplying in Chicago, Starbucks experienced its first annual loss, and massive public rebuilding projects have been put on hold due to funding constraints. One limitation of this analysis is that the data endpoints mask neighborhood changes after 2005, a period experiencing continued demolition and economic change. Research also proposes that immediate increases in crime from gentrification would eventually level out as neighborhoods stabilize (Kirk & Laub, 2010; Kreager et al., 2011; Lee, 2010). Kreager and colleagues (2011) find a curvilinear relationship in gentrification’s effect on property crimes but not on violent crimes. Unfortunately, I am unable to test a curvilinear relationship without a longer period of analysis. However, descriptively, the 17 demolition neighborhoods in Chicago eventually did experience decreases in gang homicide, perhaps implying that following a fatal neighborhood disruption, neighborhoods then reorganize or the gangs are displaced. Another limitation to this analysis is the possibility that my findings are consequences of some unobserved or unmeasured trend, such as changes in illegitimate markets, law enforcement practices, zoning policies, displacement, neighborhood cohesion, gang factionalizing, and so on. Future directions for gentrification and crime research should consider innovative ways to measure different aspects of gentrification and crime to unpack the various actors, influences, processes, and mechanisms.
Conclusion
Just as crimes are not equal, neither is gentrification. The verdict is still out on whether gentrification increases or decreases crime. Rather than taking a side on the direction contradiction within the quantitative gentrification and crime literature, I am instead advancing the understanding of this contradiction by adding several layers of disaggregation. I look at a subgroup of violent crime that occurs unequally across neighborhoods and is likely to characterize an entire neighborhood as dangerous. Second, I differentiate between types of gentrification (demographic shifts, private investment, and state intervention) with new structural measures that allow for longitudinal analysis. I concur with traditional census-based demographic understandings of gentrification having a negative effect on crime: increased SES and the mobility of White, native-born residents into neighborhoods decrease gang homicide over time. However, structural manifestations of gentrification divert the findings. The proliferation of coffee shops over time has a marginally significant negative effect on gang homicide, suggesting that neighborhoods characterized by high gang homicide might be resilient to private investment or that gang homicide has been displaced by the late stages of gentrification during which coffee shops proliferate. In contrast, public housing demolition gentrification increases gang homicide over time. This finding proposes that state efforts to revitalize crime-ridden areas are actually intensifying neighborhood crime conditions and increasing body counts, at least in the short term.
These findings have implications for the larger gentrification debates. Overall gentrification research has minimally engaged crime data as an outcome, whereas politicians and urban planners employ gentrification as a viable crime prevention strategy. I suggest that gentrification research engage more seriously with crime outcomes to challenge this conventional assumption. I have shown that gentrification as private investment has a marginally negative effect on gang homicides but state intervention gentrification actually has a positive effect on gang homicides. A more compelling crime prevention strategy would include investigating the characteristics that make gang homicide neighborhoods more volatile during public housing demolition.
Footnotes
Acknowledgements
Thanks to Sharla Alegria, Irene Boeckmann, Roland Chilton, Sanjiv Gupta, Janice Irvine, Ken-Hou Lin, Andrew Papachristos, Wenona Rymond-Richmond, Mary Scherer, and the anonymous Crime & Delinquency reviewers.
Declaration of Conflicting Interests
The author(s) declared no potential conflicts of interest with respect to the research, authorship, and/or publication of this article.
Funding
The author(s) received no financial support for the research, authorship, and/or publication of this article.