
Abstract
While it is clear that space matters when it comes to explaining crime, there is a lack of research exploring whether such spatial effects remain significant if victim characteristics are introduced into the analysis. This paper addresses this gap by applying risk terrain modeling to predict assaults for victims of different racial backgrounds and local versus non-local residents. The results show spatial risk factors have different impact on the likelihood of victimization for individuals of different racial backgrounds and those who live in the city where the crime occurs versus those who are visiting. The findings suggest that more attention should be given to integrating the victim characteristics with the characteristics of space when predicting violent crime using spatial analysis.
Do people of different racial and ethnical backgrounds have an equal chance of becoming a victim of violence at the same “risky” places? Does living in the area versus visiting changes one’s likelihood of becoming a victim of violent crime? Over the past three decades, environmental criminologists have produced a substantial amount of research on the effects of space on crime finding that some places are prone to more crime than others (Brantingham et al., 1976; Kennedy et al., 2018; Weisburd et al., 2008, 2012). Race and crime researchers, on the other hand, have found that traditionally minorities have been victimized more often than non-Hispanic Whites (Fitzgerald & Hale, 1996). Routine activity theory proponents suggest that one’s chance of victimization is dependent upon the routines one has established, such as where victims and offenders reside, work, go for shopping, and do other regular activities (Felson & Cohen, 1980). All three of the subfields of criminology mentioned above take different stances on offending and victimization. Not a single theoretical perspective accounts for all three factors (i.e., place, routine activities, and race/ethnicity) in its explanation of crime. Although there is a substantial body of research on each of the aforementioned factors and their role in offending and victimization, there is a scarcity of research combining the three factors together. To remediate the gap in the literature, this study is exploring the impact of victim race and ethnicity, as well as one’s residence (local vs. non-local), on spatial risk factors of violent victimization.
It is important to study the effects of space on crime in conjunction with race and ethnicity of the victims and offenders, as well as their place of residence, both for the sake of improving criminological theory and equipping policymakers and practitioners with more tailored tools to address crime. This study adds to the existing literature in several ways. First, it tests the generalizability of the findings from previous research examining the effects of place on violent crimes by analyzing crime data for Arlington, TX—a city that has not been studied using spatial violent crime analysis tools before. Second, it introduces victim race as a variable into the analysis along with the spatial variables which helps us understand whether racial background of the victim plays a role in explaining victimization at certain risky places. Third, it uses victim residence as one of the predictor variables to shed light on whether where a person lives determines their likelihood to become a victim of violent crime in hot spot areas. This research essentially merges parts of the explanations of crime and victimization used by environmental criminologists with that of race and crime and routine activity theory researchers.
Literature Review
Environmental Criminology
A large body of spatial criminology suggests that crime tends to always cluster in certain places (Eck et al., 2005; Kennedy et al., 2011; Weisburd et al., 2012). Although there is a big variety of perspectives on the place and crime relationship, the statement that all environmental criminologists appear to agree on is that specific areas possess certain characteristics that make them more attractive for criminals (Brantingham & Brantingham, 1981; Kennedy et al., 2011; Weisburd et al., 2009). Such characteristics or features may create opportunities for illegal activities, attract offenders, as well as reduce the ability of the mechanisms of social control to prevent crime (Kennedy et al., 2016). Various geographical micro units of analysis have been used by criminologists as a place, including individual buildings, blocks, street segments, as well as police administrative or jurisdictional areas (Weisburd, 2015; Weisburd et al., 2009). As multiple criminogenic features converge in one place, the place’s “risk level” increases (Caplan et al., 2011; Drawve, 2016; Dugato, 2013). The purpose of place-based or geographically focused policing is to identify high-risk places and take actions preventing or mitigating crime (Braga et al., 2014).
The problem with spatial analysis-based criminological research is that while it helps us understand where crime occurs and clusters, it does not always provide clarity as to why crime occurs in a specific area (Kennedy et al., 2011). Stemming from this, hotspot policing in its current form does not always lead to the most effective allocation of police resources. Sometimes, an area may possess multiple criminogenic characteristics, yet not much illegal activities might be taking place in such an area (Kennedy et al., 2011). Risk terrain modeling (RTM) has become a new step in place-based criminology that goes beyond simply identifying crime hot spots by including into the analysis a set of criminogenic risk factors that are associated with crime in a certain geographical area (Kennedy et al., 2011). RTM is based on the theory of risky places that posits that the risk level of a place is determined by the landscape vulnerability and crime exposure of the specific place (Caplan & Kennedy, 2016). The risk of any place is a dynamic value in both place and time and depends on developing interactions and transpiring events (Valasik et al., 2019). The theory of risky places integrates the interaction of such well-established spatial concepts such as hotspots, near repeats, and environmental risks to produce what is known as the next generation of spatial intelligence (Caplan & Kennedy, 2016). At the same time, RTM still possesses the same problem that is inherent to other spatial analysis models used in criminology—it still only accounts for the environmental characteristics of the place essentially assuming that criminogenic factors of space equally apply to all victims regardless of their individual characteristics. This study attempts to improve the RTM approach by incorporating into the analysis victim race and place of residence as additional variables that should be considered along with the spatial characteristics of a place for the purposes of improving violent crime prediction.
Race and Crime Perspectives
Crime statistics have shown racial disparities among both the offenders and victims since late 19th century (Garland, 2012; Hawkins, 1987; Petersilia, 1983). Both of the most widely used sources of crime victimization statistics, the Unified Crime Reports (UCR) and the National Crime Victimization Survey (NCVS), clearly show that non-Hispanic Blacks and Hispanics have traditionally had a higher chance of violent victimization than non-Hispanic Whites (Oudekerk et al., 2020), although in recent years (2018–2019) this started to change. 1 Multiple theoretical perspectives have been proposed by criminologists to explain this racial discrepancy in offending and victimization, including strain, conflict, social control, culture conflict, and other theories (Garland, 2012; Gover et al., 2020). Among the most prevalent explanations for why minorities are likely to become a victim of a violent crime are socioeconomic, educational, and systemic discrimination factors (Garland, 2012; Graham et al., 2020; Xie & Baumer, 2019). Although race and crime researchers do study places in their work, such studies are mostly focused on disparities in housing conditions across different races, community infrastructure in minority neighborhoods, access to healthcare and education, etc. (in contrast to environmental criminologists who focus mostly on criminogenic characteristics of the place). As such, research indicates that Blacks are more likely than non-Hispanic Whites or Hispanics to live in multi-unit apartment buildings, while Hispanics are more likely than Blacks or Whites to share a single-family house with extended family (DeLuca et al., 2019; Fabius et al, 2018; Snowden & Graaf, 2021). Furthermore, minorities are generally more likely than Whites to live in extended family households (i.e., share residence with vertical or horizontal extended family members) (Reyes, 2018) and in areas with concentrated poverty and social disorganization (Bernhardt & King, 2022; Garland, 2020; Sampson, 2019). At the same time, these findings have not been reflected in the studies of crime. This research aims to supplement race and crime literature by insights from a study of the effects of victim race and place of residence on victimization while controlling for the location.
Routine Activities Theory
Besides using the theoretical explanations of crime offered by environmental criminology and race and crime studies, this research is also partly based on one of the most well-regarded criminological theories—routine activities theory. Specifically, this study is using the spatial part of the explanation of crime offered by this theory. In contrast to environmental criminology and race and crime studies, which focus primarily on place or offender/victim, respectively, routine activities theory views crime as an event effectively merging the environmental characteristics with those of the victim and offender (Cohen & Felson, 1979; Mustaine & Tewksbury, 2000; Tewksbury & Mustaine, 2000). The main proposition of routine activities theory is that crime is more likely to occur when three elements converge in time and space: a motivated offender, suitable target, and the absence of a capable guardian (Cohen & Felson, 1979). An offender can be anyone who is capable, motivated to commit crime; a suitable target is anyone who is viewed by the offender as such; and guardianship can be provided by a person or object that is capable to deter the offender (Felson, 1995; Felson & Cohen, 1980). The theory further posits that eliminating any of the three elements will result in crime prevention (Cohen et al., 1981; Felson & Cohen, 1980). The theory’s name stems from the fact that it suggests that the routines of both the offender and victim play a role in whether and when their paths intersect (Tewksbury & Mustaine, 2000). Confirming the theory’s propositions, numerous empirical studies have found that most violent crimes occur in places where large numbers of people gather (night clubs, bars, apartment buildings, etc.) (Drawve, 2016; Kennedy et al., 2011).
In the RTM literature, only a small part of routine activity theory is used. Being a spatial analysis technique, RTM cannot account for the characteristics of offenders and victims (i.e., how motivated the former and how suitable the latter are). However, what RTM can take from the theory is the spatial element. Since for a crime to occur, according to routine activities theory, the paths of the offender and victim need to intersect in time and space (in the absence of a capable guardian and while both engage in routine activities), space is a necessary component of this theory. Of particular interest to the researchers in this study is victim residence. Including this variable in the analysis will allow the researchers to see if non-residents become victims of the crime of assault at a different rate compared to those who permanently reside in a risky place.
Based on the above, this study aims to answer the following research questions:
(1) Does the effect of spatial criminogenic risk factors vary for assault victims of various racial and ethnical backgrounds?
(2) Does the effect of spatial criminogenic risk factors vary for assault victims who are local residents of a certain geographic area compared to those who do not reside in such an area?
Assault Crimes
In Texas, assault is defined as an action (1) intentionally, knowingly, or recklessly causing a bodily injury, (2) intentionally or knowingly threatening another with imminent bodily injury, or (3) intentionally or knowingly causing physical contact with another person when the person knows or should reasonably believe that the other will regard the contact as offensive or provocative (Texas Penal Code, 2022). The crime of assault, consisting of both simple and aggravated assault offenses, has been selected for this study due to three reasons. First, assault is a commonly used measure of violence in criminological research (Farrington et al., 2003; Jolliffe & Farrington, 2009; Lauritsen & Heimer, 2008; Riedel & Welsh, 2015). Second, the sheer volume of assault crimes (assault is the most common type of violent offense, Bricknell, 2008) provides a sufficient number of cases for the statistical analysis used in this study. Third, assault is one of the violent crimes where victim and offender are physically present at the same place. Thus, if victim characteristics are important for predicting crime using spatial analysis techniques, as hypothesized here, only violent crime that is dependent upon the characteristics of the victim can be used for the purposes of this study.
The following section will describe the study setting, nature of the data, and statistical techniques utilized in this research. It will be followed by an overview of the results of the statistical analysis and their interpretation.
Methodology
Setting
City of Arlington, Texas is the third largest city in the Dallas-Fort Worth (DFW) metroplex, with a total population of 394,266 residents and 99.7 square miles in size. It is a suitable setting for this study because it has almost equal and well-represented racial groups of Black (22.7%), Hispanic (29.6%), and White (38.6%) residents. 2 At the same time, in 2019 Arlington had a noticeable rate of aggravated assaults (1,396), which in the DFW metroplex was surpassed only by Dallas and Fort Worth. 3 Arlington is also located only 20 miles from Dallas and 12 miles from Fort Worth making it suitable for study of victims who engage in a daily commute (non-local visitors).
Data Sources
Data used in this study come from multiple government sources. Arlington Police Department has provided the researchers with the incident-level crime data for 2019 which, among other factors, included such variables as the type of crime occurred, location where the incident took place, victim race, and victim city of residence. The dataset originally contained 6,760 unique incidents with known victim information. There were 2,763 Black, 1,569 Hispanic, and 2,428 White victims of assault used for this study. The majority of cases included one victim (84.6%), followed by two victims (11.8%), three victims (1.9%), and four victims (1.6%). For incidents with multiple victims, race and ethnicity were determined as Black when at least one victim was Black or Hispanic when at least one victim was Hispanic. In cases of both Black and Hispanic victims, the cases were coded based on predominant victim race. In four cases where incidents involved an equal number of Black and Hispanic victims, victims were randomly assigned a value of either Black or Hispanic. The place of residence was determined based on “hometown” field in the Arlington PD’s records management system (RMS). Victims who resided outside of Arlington were marked as “non-locals” regardless of their place of residence. There were total of 5,576 victims identified as “local” and 1,184 victims identified as “non-local” (2,273 local Blacks, 490 non-local Blacks; 1,993 local Whites, 435 non-local Whites; 1,318 local Hispanics, and 251 non-local Hispanics).
The space features variables were obtained by the researchers through U.S. Census (city population and racial composition for each block), Google Earth Application (banks, check cashing facilities, convenience stores, fast food places, grocery stores, gas stations, lotteries, and pawn shops), Open Texas Data Portal (cigarette retailers, alcohol outlets, and alcohol serving facilities), 4 and the City of Arlington website (city health inspections, code enforcement violations, apartment complex inspections, childcare facilities, zoning cases, and brownfields). 5 Having data from 2019 allows the researchers to explore the research questions without the biases stemming from the COVID-19 pandemic that started in 2020 and dramatically changed the behavior of victims and offenders.
Data on the racial composition of each geographical unit have been obtained from ASC-2019 conducted by U.S. Census to match the study time period. 6 All data have been geocoded to x and y coordinates using ArcGIS 10.6.1.
Analytic Strategy
First, the traditional kernel density estimation (KDE) hot spot analysis was conducted to visually examine hot spots for simple and aggravated assaults for all victims and separately for victims of White, Black, and Hispanic races/ethnicity. Separate KDE hot spot models were also estimated for local and non-local residents of each races/ethnicities. This step allowed to visually determine whether hot spots are co-located and/or overlapping for each group of victims. The cell size was set to 500 ft and is similar to the one used for other analyses. The search radius was set to 1,500 ft., representing three blocks. The processing extent was set to the Arlington boundary file excluding cities of Pantego and Dalworthington Garden from the estimation due to their location inside the boundaries of Arlington city.
Second, the negative binominal regressions were performed using assaults per victim race as the dependent variable and Census resident race/ethnicity as the independent variable. The data were aggregated at a block level. In doing so, we tested whether the differences in hot spot locations for victims of different races/ethnicities are simply function of places where they primarily reside. The dependent variables of our study were the number of assaults crimes and crime hot blocks where statistically more assault crimes occurred for each group of victims. There were 12 groups of victims examined stemming from a combination of the following criteria: All races, Black, White, and Hispanic and all victims, local and non-local victims. If blocks in the study area overlap with crime hot spots of each crime type, we code the overlapping block 1, otherwise 0, creating a binary outcome for hot blocks. To generate the hot spots, we used KDE with 500 ft cell size and 1,500 search radius to identify micro-area hot posts. After generating multiple contours of KDE for each victims group, we selected contour polygons from the top 3.7% (or z-score higher than 1.96) of the surface. This defined crime hot spots of each dependent variable.
The major independent variable for our study was composition of the race group of each block. For variables titled as “white,” we estimated the proportion of white to non-white population on each block, for variables labeled as “black,” we estimated proportion of black/to non-black population. The same logic applied to Hispanic population variable. The model was controlled for the size of blocks in the spatial regression model. The area size was measured by the squared foot area of each block. To ensure the normality assumption in the regression model, we transformed the raw squared-foot size of each block using the logarithm with base 10 in order to reduce the variable’s ladder of power. We also controlled for the spatial lag effect of crimes across adjacent blocks assuming an automated spill-over effect of crime exists across nearby blocks. Since we found evidence of significant spatial lag effect using the Moran’s-I test, we have to reject the null hypothesis of random distribution of crime across the blocks in the study area. GeoDa 1.8 was used to generate the spatial lag variable and control the spatial lag in the regression models.
Third, a risk terrain modeling (RTM) analysis was conducted to determine whether the criminogenic factors of environment are different for various races/ethnicities of victims and whether these risk factors vary for victims who were local residents or visitors of Arlington. 7 RTM examines features of landscape (often referred to as risk factors) that create unique opportunities for crime. The probability of crime is measured through the spatial influence of landscape features using RTMDx, special software utility developed at the Rutgers Center on Public Security. 8 RTM estimates the risk of crime through a grid of the study area made up of equally sized cells that represent a continuous surface of places where values of risk exist (Kennedy et al., 2011). The RTMDx output consists of relative risk value (RRV) for each significant factor which is the exponentiated factor coefficient, the optimal operationalization, and the distal extent of spatial influence (Gimenez-Santana et al., 2018). Output also includes a relative risk score (RRS) which is assigned to each cell within the study area. RRV is a relative weight and allows to compare risk values across various risk factors that are statistically significant. 9 The optimal operationalization allows to determine whether the distance (proximity) or density of the landscape feature has the most spatial influence on the probability of crime, while the spatial influence determines the distal distance (in feet) that each risk factor has on the probability of crime. 10 Separate RTM models were estimated using the RTMDx software for each race/ethnicity total and also for each race/ethnicity group of local and non-local residents resulting in nine models. Since Arlington does not have a grid planning structure like many other large cities, 250 ft place size and 500 ft standard value were used which is the size of an average city block for most US cities. This resulted in total of 45,167 places to be analyzed. Each risk factor was set to be operationalized as both density and proximity which allowed the researchers to consider both influence of distance and density of criminogenic factors on the output variable. All factors were set to test at maximum of three blocks which is a standard value for this analysis.
A total of 28 risk factors grouped into three categories derived primarily from previous RTM literature were used. The risk factors were categorized into three types: code enforcement violations, risky land use, and risky facilities. Code enforcement violations are known factors of social disorganization that are traditionally related to the increased crime rates in general (Caplan et al., 2014; Kennedy et al., 2016). Research also shows that alcohol outlets, shopping malls, hotels, banks, and restaurants that create transiency are often empirically co-located with the spatial concentration of interpersonal violence including assaults (Barnum et al., 2017; Drawve & Barnum, 2018; Kennedy et al., 2016). Other risk factors often associated with criminal opportunities that were also considered for this study included lottery shops, check cashing facilities, pawn shops, gas stations, and fast-food places (Bernasco & Block, 2011; Block & Block, 1995; Drawve et al., 2016; McCord et al., 2007; Valasik et al., 2019; Vildosola et al., 2020). Previous research also suggests that risky land use factors may not directly relate to the interpersonal violence but provide an opportunity of crime in general by lowering the economic value of the property in the area (brownfields, vacant and abandoned buildings, and zoning violations) (Andresen & Hodgkinson, 2018; Kennedy et al., 2016). Vacant and abandoned property are also related to the increase in drug activity, which in return can be associated with some interpersonal violence (Contreras & Hipp, 2020).
Findings
Hotspot Analysis
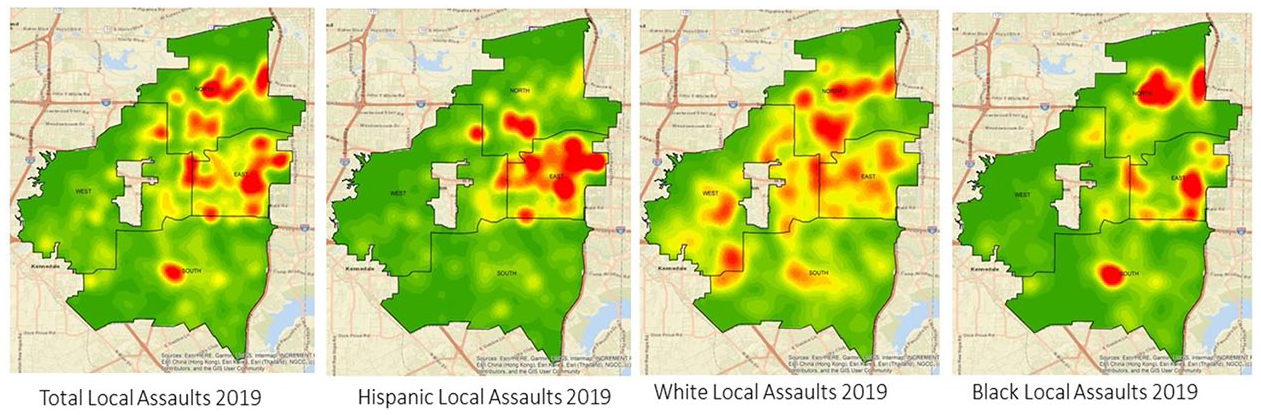
The visual examination of KDE was done to do a preliminary assessment of the spatial distribution of assaults based on different races/ethnicity of the victims and their residencies. Figure 1 shows series of KDE maps for victims regardless of their residency. The overall map shows that assault hotspots were located in three of Arlington divisions (East, South, and North) but primarily concentrated in East and North divisions. However, the race/ethnicity-specific maps indicate that most assaults against Hispanic victims were concentrated in East divisions, while assaults against Black victims were equally located in both North and East. Hotspots for White victims were located in all four divisions, including West, which is different from the overall assault crime picture. The comparison of Figures 1 and 2 provides similar spatial distribution, although not entirely identical. This is likely due to the fact that most victims in this sample were identified as locals. The examination of Figure 3 draws a very different picture: the majority of non-local assaults were committed in the North with more dispersion for Black victims. Overall, the visual examination of KDE maps shows that concentration of assault incidents varies from race to race and place of residence. Knowing from Census data that the majority of White population reside in the Western division, majority of Hispanics reside in the Eastern part, and majority of Blacks reside in the South division, the next step was to statistically determine whether racial distribution of hotspots could be mainly due to the segregated residencies of various racial groups in Arlington city rather than the hypothesized differential likelihood of victimization for people of different backgrounds.

Hot spot distribution for assault victims of different races/ethnicities regardless of their places of residence.
Hot spot distribution for assault victims of different races/ethnicities for local residents only.

Hot spot distribution for assault victims of different races/ethnicities for non-local residents (visitors).
Binominal Negative Regressions
Table 1 displays a summary of 12 binominal negative regressions run separately for each dependent variable that consists of assault hot spots for 12 groups of victims based on various combinations of race and place of residence. The independent variable includes proportion of White, Black, and Hispanic race/ethnicity of residents for each block. The constants and orthogonal polynomial terms from each model are not displayed.
Summary of Negative Binominal Regressions for Assault Victims’ Race/Ethnicity and Predominant Race of Block Group per Census.
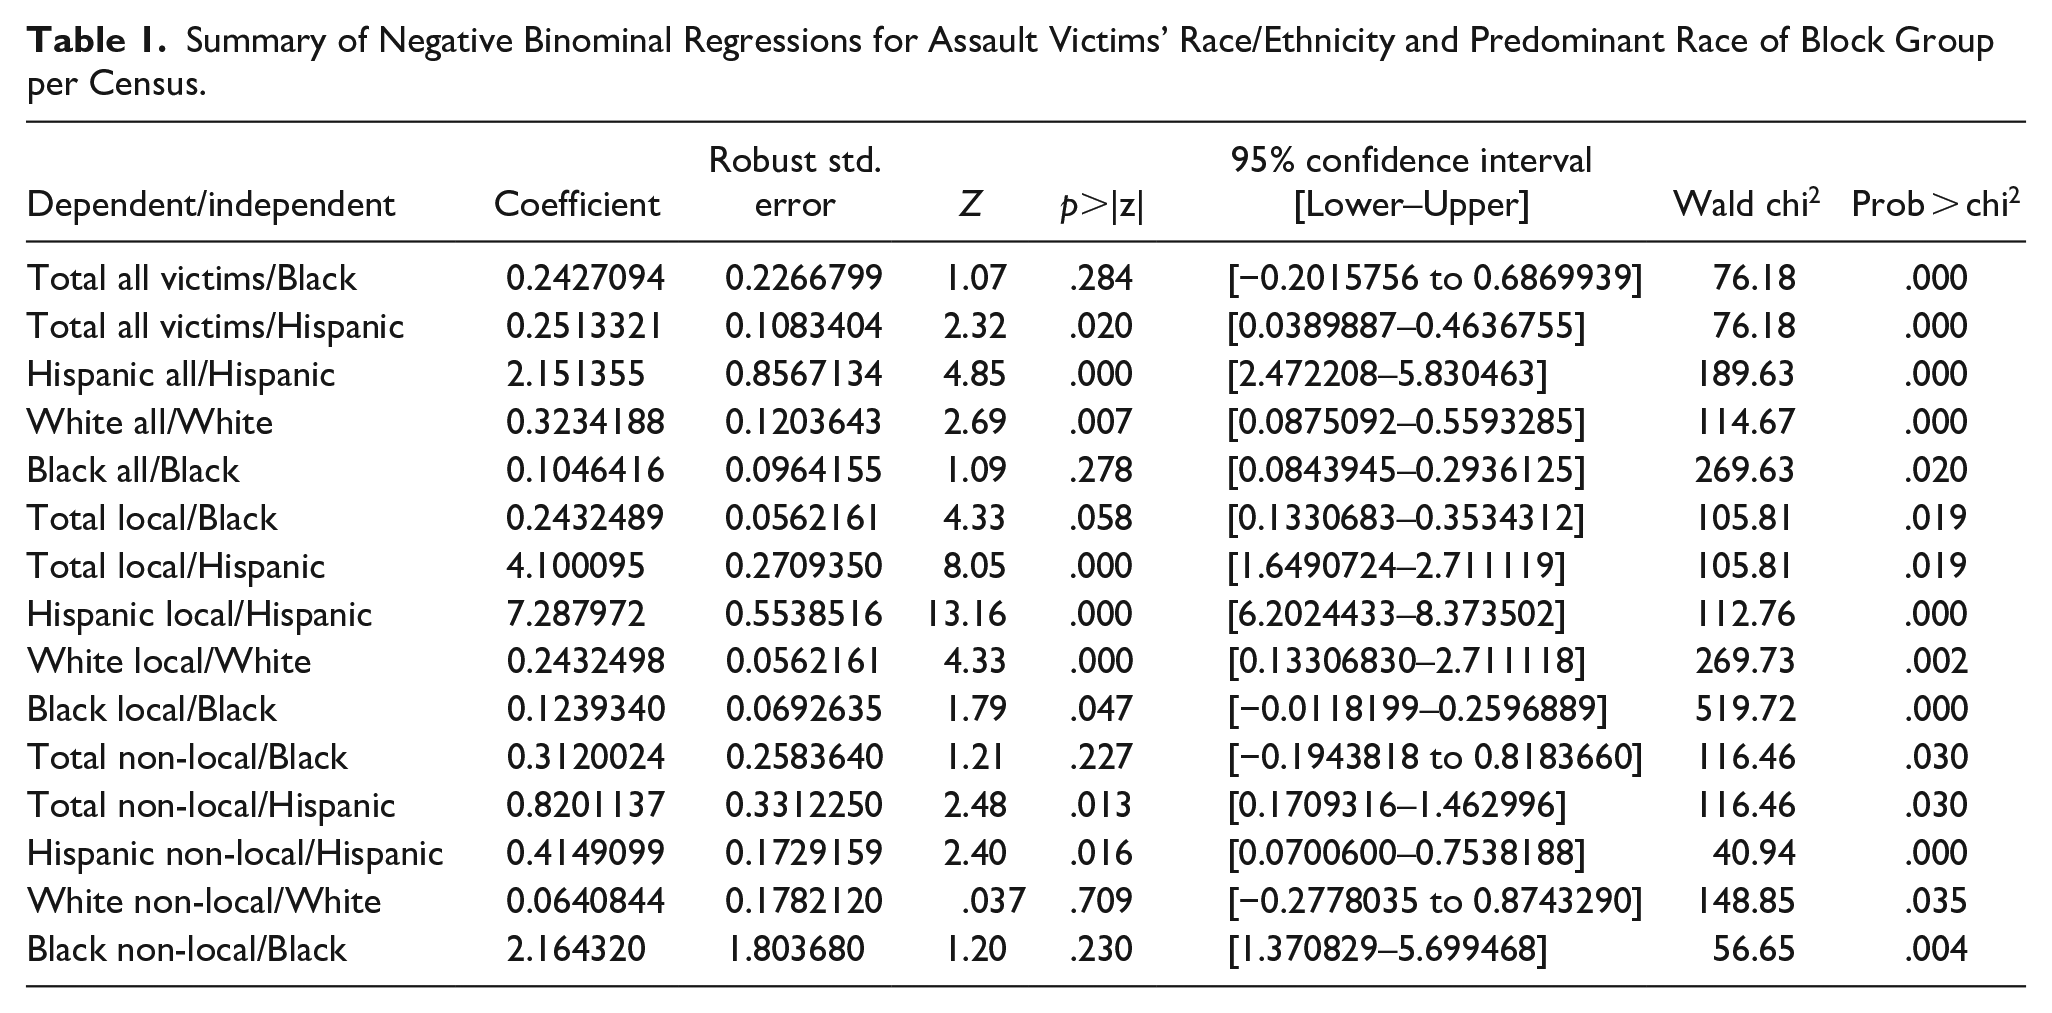
Table 1 indicates that the probability of assault hot spots for all victims of all races was higher in the areas with higher proportion of Hispanic residents. This pattern was also consistent for all local victims of assault and all non-local (visitors) victims. There was no statistically significant relation between the assault hot spots for all victims of all races and proportion of Black residents. This was also true for all local victims and non-local victims of assault.
There was also a statistically significant relation with the hot spots for all Hispanic victims and proportion of Hispanic population. This was equally true for local and non-local Hispanic residents. Hot spots of all White victims and local White victims were statistically significantly related to the proportion of White population on the block. This pattern did not hold true for non-local White victims of assault.
In sum, there are clear spatial relations with the hot-spots of assaults for all victims and proportion of Hispanic population on the block. The spatial relation was also statistically significant for local White victims but coefficients were significantly smaller than for Hispanic population. The locations of hot-spots for non-local visitors of all races were primarily independent from the proportion of White or Black residents on the block. Overall, the spatial distribution of hot spots on Figures 1–3 cannot be fully explained by the racial composition of blocks where the incidents occurred. This is particularly true for non-local (visitors) assaults. Therefore, other factors of environmental risk should be explored in order to understand the differences.
Risk-Terrain Modeling
Table 2 provides a summary of relative risk scores (RRS) for each of our nine RTM models. RTMDx assigns a relative risk score to each of the study area cell defining it as a risk of particular incident to occur in this cell. Ranges of RRS vary significantly among different groups of victims with Black non-local visitors presenting the highest range. The findings suggest that there have been some micro-places in Arlington, TX that produce much greater risk for Black victims than it is for Hispanic and White victims. White non-local victims appear to have lowest range of RRS (1–71.295) compared to all other groups. All of these high-risk places are highly concentrated with only 4.44% of all places to present a significant risk to Black victims. For all groups of victims, the percentage of places with a significant risk was under 5% of the entire territory which supports an overall proposition that assault incidents are highly concentrated in this jurisdiction.
Summary of Relative Risk Scores for Each RTM Model per Assaults Victims’ Race/Ethnicity.

Table 3 provides a summary of RTM models for all victims per race and all risk factors included in the model. From 28 proposed factors, only 13 risk factors showed significant spatial influence on incidents of assault for some groups of victims. From these factors, only eight factors have been significant for all victims of all races. These include exterior and trash violations, apartments, apartments with poor inspection scores, food establishments, hotels, and bars. These risk factors have been operationalized differently for different groups of victims and also have various relative risk value (RRV) and spatial influence (SI). Outside of code enforcement, for Black victims, the highest risky facilities included apartments (4.934), bars (3.219), and hotels (2.946). For Hispanic victims, the highest risky facilities were hotels (8.141), bars (4.411), and cigarette shops (3.307). For White victims, the highest risky facilities included hotels (4.576), bars (2.770), and alcohol shops (2.451).
Summary of RTM Models for All Black, Hispanic and White Assault Victims.
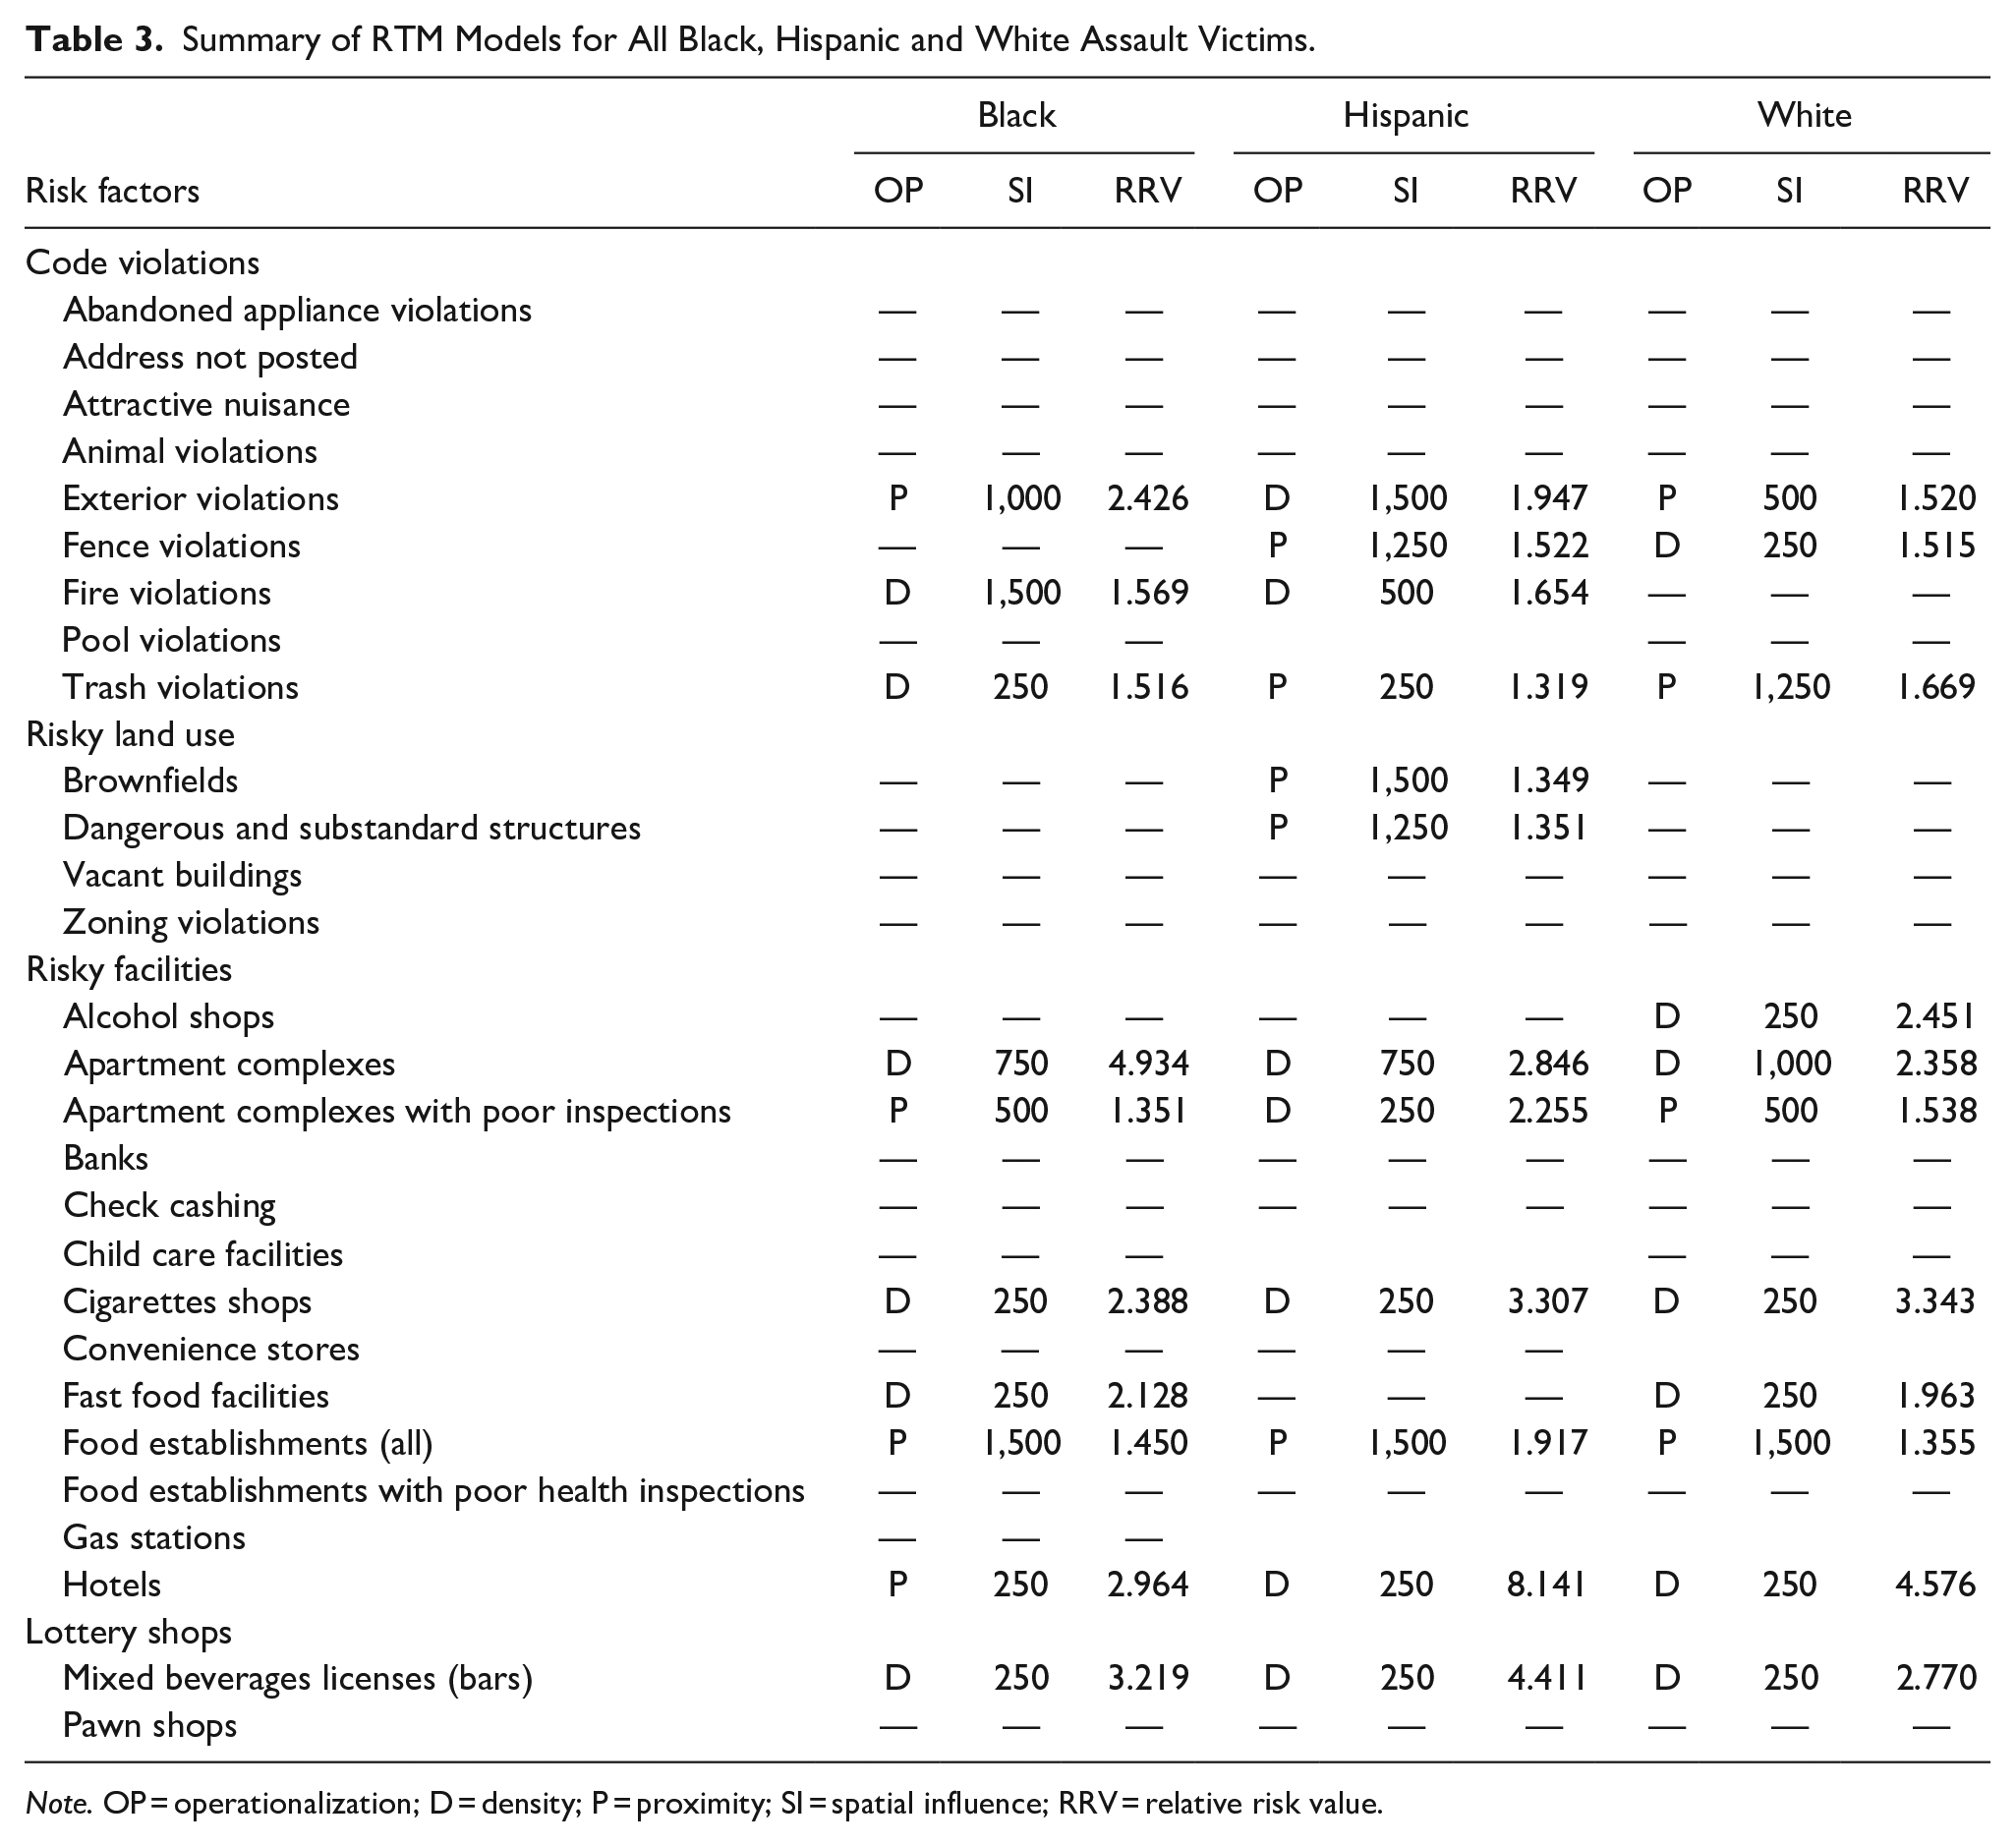
Note. OP = operationalization; D = density; P = proximity; SI = spatial influence; RRV = relative risk value.
Table 4 provides a summary of RTM models only for local victims per race and all risk factors included in the model. Out of 28 risk factors examined, only 14 have statistically significant spatial relations with assaults for local victims and only five risk factors are significant for all race groups. The comparison of Tables 3 and 4 suggests that risk factors for each race group differ when examining local victims only. For example, brownfields emerge as a risk factor only for total Hispanic victims but not for local Hispanic victims. At the same time, local Hispanic victims appear to have more risk factors in the code violation group (exterior, fence, fire, and nuisance violations) compare to the other local Black and White victims. Hotels also emerge as a risk factor only for local Hispanic (6.354), but not for local Black and White victims. At the same time the relative risk value (RRV) of apartments increases for local Black victims (5.671) when compared to all Black victims (4.934). Also, one can see that RRV of bars declines across all race groups for local victims when compared to all victims of all races (3.219, 4.411, 2.770 in Table 4 compared to 2.763, 3.424, 1.987 in Table 3 accordingly).
Summary of RTM Models for Local Assault Victims per Race.
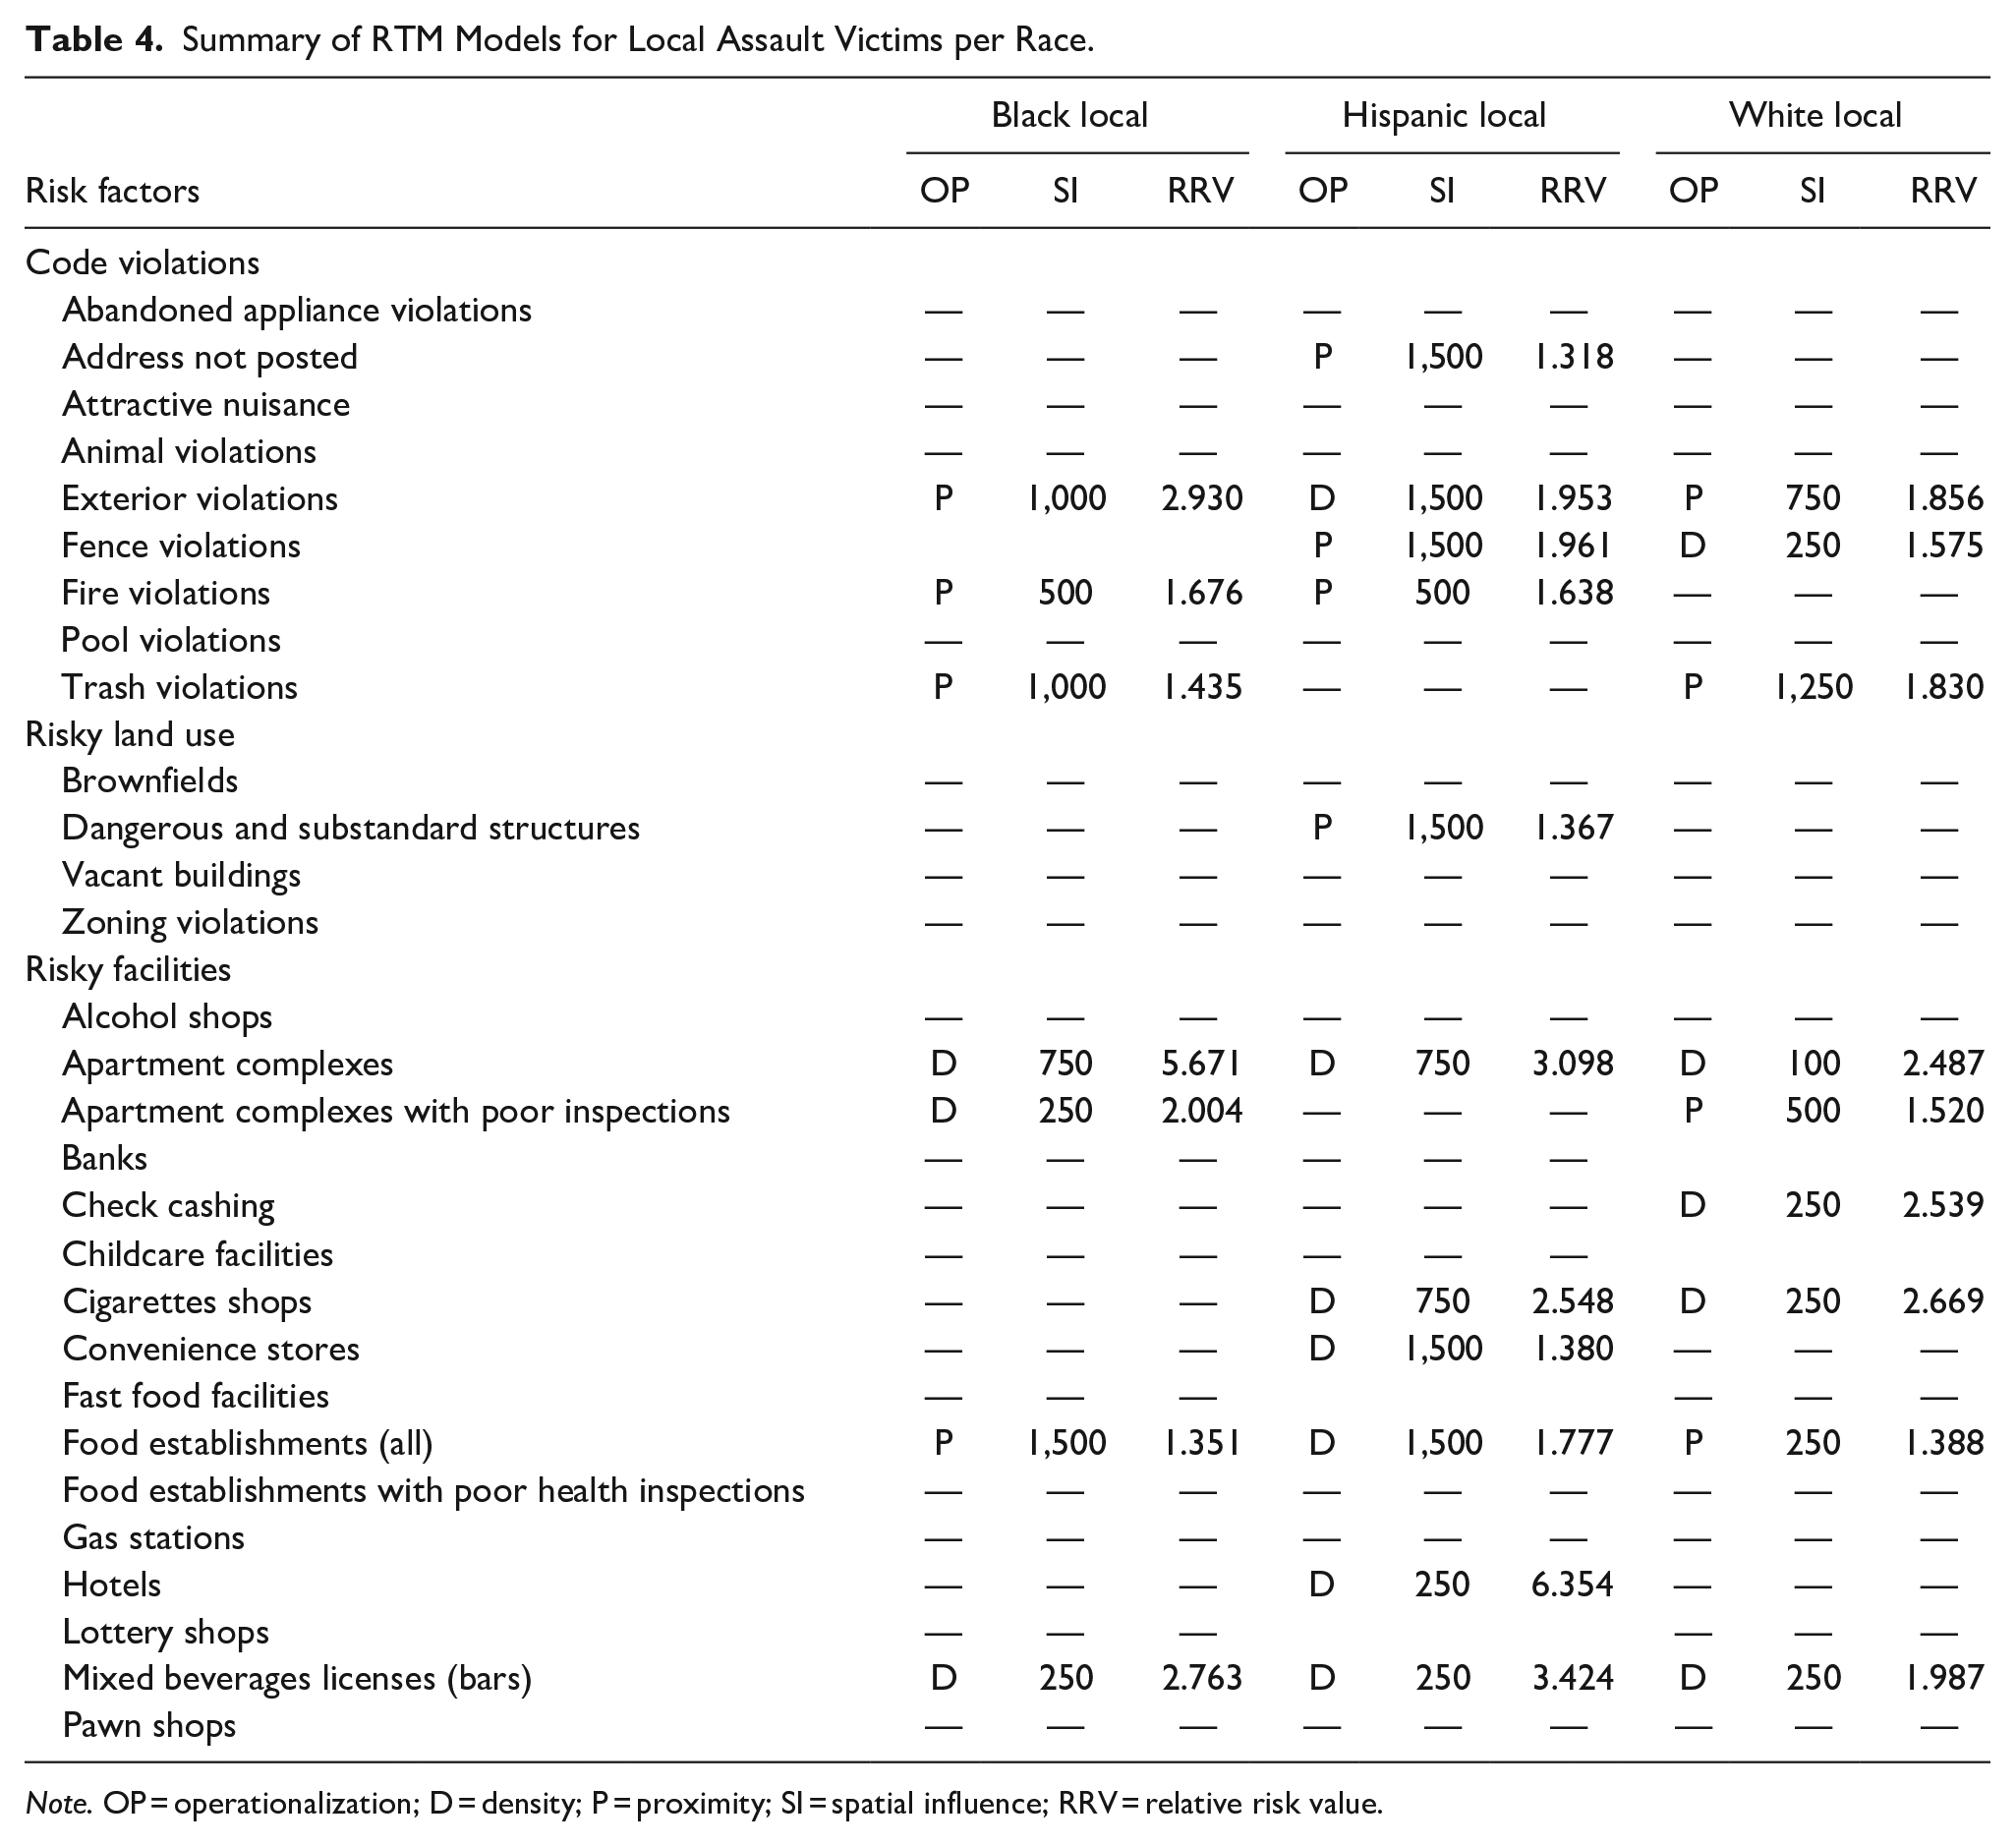
Note. OP = operationalization; D = density; P = proximity; SI = spatial influence; RRV = relative risk value.
Table 5 provides a summary of RTM models for non-local victims per race and all risk factors. Out of 28 risk factors, only 10 have statistically significant spatial influence on assault incidents for all groups of victims. Only one factor (bars) appears to be significant for all three races of non-local victims. A comparison of Tables 4 and 5 results in a significantly different set of risk factors suggesting that assault victimization of local and non-local individuals can vary significantly. Most of the code violation factors are insignificant for non-local, group of victims while the risk factors associated with transiency (gas stations, fast food places, cigarette shops, and food establishments) are more likely to produce statistically significant spatial association. For example, hotels appear to be a risk factor for non-local Black and White victims but not for Hispanics individuals. It is also interesting to notice that apartment complexes continue to be a risk factor for non-local White and Black victims but not for Hispanic individuals. Bars is one stable factor that increases risk for non-local victims of all races. The relative risk values for bars are higher for all non-local victims when compared to local individuals (4.984, 5.782, 3.828 in Table 5 compared to 2.763, 3.424, 1.987 in Table 4 accordingly).
Summary of RTM Models for Non-Local (Visitors) Assault Victims per Race.

Note. OP = operationalization; D = density; P = proximity; SI = spatial influence; RRV = relative risk value.
Overall, our findings confirm our proposition that risk factors for micro-places of concentrated assault incidents vary not only by victim’s race but also by place of residence. These differences include operationalization, spatial influence, and relative risk values of each risk factor.
Discussion
Our findings suggest that concentration of assault crimes varies spatially for victims of different racial and ethnical backgrounds and those who reside in Arlington, TX versus those who do not. This variance can only partially be attributed to the predominant race of residents on each city block. The relationship is more pronounced for local Hispanic and somewhat for White victims of assault which suggests that some of their assault victimization concentration is explained by their place of residence. The relationship does not hold true for non-local residents in general and Black victims specifically. Thus, the findings are supporting the idea that other activities common to these groups of victims are likely to be responsible for spatial variation in the likelihood of victimization.
This study also finds that multiple spatial risk factors common for RTM analysis differ for various race/ethnicity groups and local/non-local victims. This can give an insight into the particular patterns of assault victimization specific to these groups. For example, many code enforcement violations that are more likely to occur in older single home residencies were statistically significant for Hispanic victims of assault. One can see that this might be due to the fact that Hispanic individuals tend to reside with their extended families in an older rental single home dwelling (Newman & Holupka, 2021). As such, the crime reduction policy of code enforcement that is often related to the broken windows theory is likely to have an effect on local Hispanic victimization in Arlington, TX but is less likely to change the assault victimization for local Whites and Blacks. At the same time, the effort to improve the quality of apartment complexes with additional inspections may have some effect on all Black victims and local White victims, however not on Hispanic victims.
Certain risk factors appear to be equally important for the assault victims of all racial and ethnical backgrounds; however, individual victim characteristics add important details essential for an effective crime reduction policy. For example, both proximity and concentration of hotels were important spatial risk factors for all groups of White, Hispanic, and Black assault victims. However, a closer look showed that hotels were an important risk factor for local Hispanics as well as non-local Blacks and Whites. One can imagine that this is more likely to occur with local Hispanic working at the hotels or around hotels and non-local Back and White visitors who stay in the hotel or conduct business around the hotel. Another example of how victim-based characteristics can provide better understanding of victimization are transient places like gas stations that were a statistically significant risk factor only for non-local Whites and Blacks.
Yet, other risk factors appear to be universal for all victims’ groups which suggests that some places are risky for all individuals. One example of such risk factors is bars that sell mixed beverages. Bars were a statistically significant risky place across all groups of individuals although they had a higher risk of assault victimization for Black and Hispanic people.
Limitations
While this study undoubtedly provides a substantial theoretical contribution to environmental criminology and space-based policing, a few limitations should be acknowledged. First, the design of this study was restricted by the data that the authors were able to collect. Only data obtained from governmental agencies (Arlington Police Department and the City of Arlington as well as publicly available state and federal databases) were used in this study. Although the composition of variables analyzed here is ideal for the spatial analysis portion of this study, “victim residence” is perhaps a less-than-optimal measure of the victim’s routine activities. Had the available dataset been more descriptive about the type of activity the victim was engaged in at the time of victimization, this study could have benefitted from a more precise measure. Similarly, knowing the precise place of residence of those who are coded as “non-residents of Arlington, TX” would allow for more meaningful results. Furthermore, including only victim race into analysis, while not including the offender race, does not paint a clear picture of the environment in which crime was committed. Had the researchers had data on the offender race available to them, this study would have provided more clues about the crimes that were analyzed.
Second, as the measure of violence, this study is using both simple and aggravated assaults. The inclusion of simple assault in the analysis was necessary to ensure that there is a sufficient number of cases for the statistical model. Both simple and aggravated assaults are commonly considered violent crimes. However, using simple assault leads to potential biases related to the variety of subcategories of simple assault which may include a threat of bodily harm with no physical contact as well as an unwanted physical contact (which is further divided into contacts causing a light injury and serious injury). This variety of definitions for various subcategories of simple assault leads to the inclusion into data analysis not only assaults involving physical contact (which are commonly understood as violence) but also assaults involving only verbal threats.
Third, this study could have benefitted from an additional qualitative component of research design, whether in the form of observations or interviews with residents or police officers familiar with the hot spot areas, who would be able to provide additional context for each of the hot spot areas. This could be helpful in the interpretation of the results as this would potentially provide insights into why specific areas within Arlington, TX were found to be highly dangerous for people of all races regardless of their residence while other hot spots posed higher risks only to people of a specific race or residence status. Lastly, as it is common in RTM research, this study only analyzes data from one city (Arlington, TX) and generalizability of these findings should be assessed cautiously and in the context of other environmental- and space-based criminological studies.
Conclusion
Overall, the study suggests that the victim-specific variables can enhance the spatial risk models by providing more nuanced understanding of victimization patterns and thus equip the law enforcement community, as well as community partners, with a better way to develop effective crime reduction policies. This study supports that idea that not all risky places present the same risk to all victims which could be based on their socio-economic status and/or attributed to the shared routine activities that these individuals engage in. Consistent with the previous studies, our research suggests that Black individuals tend to have higher spatially concentrated victimization although specific risk factors vary for local and non-local individuals.
The findings discussed in this article can be useful to the law enforcement community and other community stakeholders in developing new or adjusting existing crime prevention strategies. The Newark Public Safety Collaborative is an example of how various government agencies and community partners, including a variety of for-profit and non-profit organizations collaborate on crime prevention, as well as many other public safety initiatives, using RTM analysis. Such spatial crime analysis supplemented with the individual characteristics of the victim, as it was done in this article, can prove to be a useful tool for crime prevention in medium to large size cities (as RTM analysis requires a significant amount of data to produce reliable results, smaller towns may not have a sufficient number of crimes of the same type that occurred lately—this may limit the usefulness of RTM for smaller towns).
More research is needed to fully understand this phenomenon. Such research should likely incorporate victim gender to explore potential intersectionality of race and gender and risk factors specific to “gendered” places. More studies should also be done in various locations to see how the overall composition of jurisdiction might influence spatial risk factors for various groups of victims. There is also a need to examine potential victim-specific variables in the context of other crimes to see whether pattern holds for property and other violent crimes. Finally, there is also a possibility to develop the offender-specific spatial models that would take into account race and gender of the offender and explore whether the spatial risk factors for such crimes differ for various groups of individuals.
Footnotes
Declaration of Conflicting Interests
The author(s) declared no potential conflicts of interest with respect to the research, authorship, and/or publication of this article.
Funding
The author(s) received no financial support for the research, authorship, and/or publication of this article.