
Abstract
This quasi-experimental study examines the impact of a mentoring program for low-income and minority middle and high school students displaying early warning indicators of dropping out on attendance, behavior problems, and course passing. The study was conducted over 3 years in five districts throughout the country and used a comparison group identified through propensity score matching. Although students reported positive experiences with mentoring in surveys, significant program effects on student attendance, behavior, and course passing were not found. Such interventions may have little demonstrated effect not only due to implementation issues but also because they do not address school experience variables that influence student outcomes.
Introduction
Understanding how to keep more students on the path to high school graduation and college enrollment is one of the crucial questions for education researchers and policymakers. Much of the recent research on the predictors of high school graduation builds on the theoretical construct of student engagement in school (e.g., Fredricks, Blumenfeld, & Paris, 2004). The process of disengagement from schooling often begins in elementary and middle school. Students with lower levels of parental support for education, which is correlated highly with having a young and low-income single parent (Rumberger & Lim, 2008), often have lower levels of attendance in early elementary school and lower levels of achievement (e.g., Alexander, Entwisle, & Kabbani, 2001; Finn, 1989). Interest in school often declines as students are not successful academically. Self-esteem drops, and frustration with school increases.
By middle and high school, this disengagement generally manifests itself behaviorally in absenteeism, failure to complete assignments, and failure to pass courses. Chronic absenteeism is a strong predictor of course failure, and course failure, particularly in ninth grade, is a strong predictor of dropping out (Allensworth & Easton, 2005, 2007; Baltimore Education Research Consortium [BERC], 2011; Finn, 1989; Lan & Lanthier, 2003; Mac Iver, Balfanz, & Byrnes, 2009; Mac Iver & Mac Iver, 2010; Meyer, Carl, & Cheng, 2010; Neild, 2009; Neild & Balfanz, 2006). Paying attention to the transition between middle and high school has been shown to be crucial (e.g., Cohen & Smerdon, 2009). Course failures prior to high school, often associated with retention and overage-for-grade status, also have a close association (much stronger than test scores) with a drop-out outcome. Balfanz, Herzog, and Mac Iver (2007) have shown that behaviors manifested in sixth grade (attendance, course failure in English or mathematics, and a record of misbehavior) accurately predict at least 50% of eventual dropouts. In short, one can summarize the early indicators of a drop-out outcome as the ABCs: attendance, behavior problems, and course failure (Balfanz, 2011; Mac Iver & Messel, 2013).
Conditions within the school experience also influence student motivation, engagement, and achievement, and underlie the surface indicators of disengagement. We focus below on several school-level components that influence student outcomes: student–teacher relationships, teacher beliefs and attitudes, classroom climate, and classroom instruction.
The important role of interpersonal relationships in student achievement motivation is emphasized by all the major theoretical frameworks (attribution theory, expectancy-value theory, goal theory, self-determination theory, self-efficacy theory, and self-worth motivation theory; Martin & Dowson, 2009). Research has shown that student achievement motivation is shaped by positive relationships with teachers, including feeling accepted, valued, and cared for (Hardre & Sullivan, 2008; Martin & Dowson, 2009). Some studies have linked these positive relationships directly to student achievement (Goodenow, 1993; Kontos & Wilcox-Herzog, 1997). Domagala-Zysk (2006) has shown that failing students are significantly less likely than successful ones to view teachers as helpful and motivating. Allensworth and Easton (2007) found ninth-grade failure rates to be lower in schools where “students report high levels of trust for their teachers and . . . that teachers provide personal support to them” (p. 30). Dropouts themselves have reported that they would have worked harder if a teacher had shown concern for them, and given them challenging and interesting work (Bridgeland, Dilulio, & Morison, 2006).
Farrington’s (2008, 2014) qualitative study of eight high school students who had failed ninth-grade courses provides rich insights into how teacher/school practices and policies influence student responses to failure. The study found that failing high school students perceived the following classroom attributes as most important for their success:
(a) teacher demonstrations of genuine care about the students’ well-being (or the lack of such demonstrations); (b) teacher commitment to student learning and provision of support and encouragement to ensure that students learned (or the lack of such commitment and provision of support); and (c) classroom activities that were interesting and able to hold students’ attention (or lack of interesting activities). (Farrington, 2008, p. 183)
Further analyses indicated that “school and classroom policies and practices . . . did indeed have a significant impact on student sensemaking about failure in ways that impeded students’ success in classes as well as their recovery of lost credits” (Farrington, 2008, p. 249). Grading policies (particularly in reference to late work) and structured opportunities within the school for meeting the as yet unmet course standards appeared to be particularly influential.
Teacher–student relationships are themselves influenced by factors that become particularly salient in low-income schools. The quality of teacher–student relationships, particularly teachers’ persistence in helping struggling students, is influenced by teacher self-efficacy and other teacher attitudes (Ashton & Webb, 1986; Bandura, 1997; Gibson & Dembo, 1984; Guskey, 1988; Kurz & Knight, 2004). Teachers may be unwilling to provide personal support or additional intervention to students they perceive as unmotivated. Experimental studies of teacher response to student failure on tests have confirmed that teachers do indeed make distinctions between failure due to perceived lack of student effort and perceived lack of student ability or other mitigating circumstances—feeling less responsibility, and showing less inclination to intervene and more inclination to give failing final marks in response to perceived lack of effort (Matteucci & Gosling, 2004; Weiner, 2003). There is also evidence of teachers’ independent approaches to grading that contribute to student failure. For example, the practice of giving zero credit for failed or late assignments can destroy student incentives for continued effort when receiving a passing course grade has become nearly or completely impossible (Guskey, 2000; Reeves, 2004, 2008).
Not surprisingly, research indicates that student academic performance is also related to quality of classroom instruction and classroom climate. High-quality classroom instruction is by definition rigorous and engaging, which helps to maintain student interest, and increase attendance and classroom participation (if not always, effort in completing homework and studying). Marks (2000) found a positive association between rigorous (“authentic”) instruction and behavioral measures of student engagement. The need for relevant curriculum to keep students engaged and motivated cannot be overemphasized, given focus group findings from dropouts regarding how “uninteresting classes” contributed to their drop-out decision (Bridgeland et al., 2006). Research indicates that classroom activity that students find interesting and relevant is positively associated with student motivation (e.g., Green, Miller, Crowson, Duke, & Akey, 2004). Keith and Cool (1992) found that student motivation was influenced by quality of instruction, and in turn, motivation influenced completion of homework and taking more rigorous coursework, which had a positive effect on academic performance.
In addition, there is evidence of a significant impact of classroom climate (particularly the existence of structure, autonomy support, caring and respectful relationships, encouragement, and cooperation) on student motivation and academic behaviors (Haertel, Walberg, & Haertel, 1981; Jang, Reeve, & Deci, 2010; Matsumura, Slater, & Crosson, 2008; Pianta, Belsky, Vandergrift, Houts, & Morrison, 2008; Pierce, 1994). School-level findings from a study completed in Chicago have indicated that student attendance and course performance are related to “how teachers work together in the school,” particularly their sense of joint responsibility for student success and the degree of coherence in instructional programming across the school (Allensworth & Easton, 2007, p. 33). Teachers’ sense of collective responsibility for student success has been linked to achievement gains at the school level (e.g., Lee & Smith, 1996).
In response, there has been considerable attention in recent years to creating more personalized learning environments that emphasize teacher–student relationships as well as high-quality instruction that is both rigorous and relevant (Bloom, Thompson, & Unterman, 2010; Bloom & Unterman, 2013). In addition, educational organizations such as Achieve, America’s Promise Alliance, the Alliance for Education, the National High School Center, the Mid-Atlantic Equity Center, SEDL, and others have translated research findings into practical advice for district and school leaders regarding implementation of early warning systems and interventions to keep students on-track to graduation (e.g., Heppen & Therriault, 2008; Jerald, 2006; Kennelly & Monrad, 2007; Pinkus, 2008). The positive effects of close monitoring of student performance and provision of interventions for attendance, behavior, and academic course performance in the “Check and Connect” program (Sinclair, Christenson, Lehr, & Anderson, 2003; U.S. Department of Education, Institute of Education Sciences, 2009) influenced the development of the Diplomas Now intervention by Johns Hopkins University, together with its partners City Year and Communities in Schools (Balfanz, 2011; Corrin et al., 2014).
Although most of the intervention work based on early warning indicators has been organized at the school or district level (e.g., Allensworth, 2013), there is a growing call for external nonprofit partners to “connect their [out-of-school-time] work to students’ progress in school” using early warning indicator data from schools (Balfanz, 2013, p. 26). Coordinating the work of schools and community organizations to ensure student success is increasingly important in the context of limited resources for addressing massive challenges in low-income neighborhoods.
Evaluation studies of out-of-school-time (OST) programs, both summer school and afterschool, have found mixed results regarding program impacts on school outcomes (attendance and achievement). A meta-analysis conducted by Lauer and colleagues (2006) found significant effects of OST programs designed to help improve reading and mathematics achievement. Although Dynarski et al. (2004) found a significant positive effect on middle school attendance in their study of 21st Century Community Learning Centers (using a matched comparison group), Gottfredson, Cross, Wilson, Rorie, and Connell (2010) and Lauver (2002) found no statistically significant effect of afterschool program participation on school attendance or most other school behaviors or achievement in two separate randomized studies of middle school students.
The connection of close monitoring of student academic performance and delivery of mentoring to struggling students is therefore an important area to explore, as mentoring is a means of personal intervention. Recent research on mentoring has included a focus on student academic performance as one of a group of outcome variables. Studies differentiate between school-based and community-based mentoring. Bernstein, Rappaport, Olsho, Hunt, and Levin (2009) pointed out that school-based mentoring (often provided by external partners) is often constrained by the academic year calendar and delays in start-up that reduce the dosage to 6 months or less, which may render it less effective than community-based mentoring that has fewer calendar-based constraints. At the same time, school-based mentoring may offer a tighter connection between students’ school records and the mentoring efforts, which could be important in influencing academic outcomes. Although a recent meta-analysis (Dubois, Portillo, Rhodes, Silverthorn, & Valentine, 2011) reported positive effects of mentoring programs generally on academic outcomes, findings from large-scale randomized studies have not been as encouraging. Promising academic outcome effects reported by Herrera, Grossman, Kauh, and McMaken (2011) did not sustain the following year, and positive effects of a school-based mentoring intervention for Latino students across the grade span found positive effects on socioemotional measures but not on academic outcomes (Karcher, 2008). The large-scale national evaluation of school-based mentoring programs funded by the U.S. Department of Education found significant effects of school-based mentoring on absenteeism and truancy, but none of the effects remained statistically significant after accounting for multiple comparisons in the analysis (Bernstein et al., 2009).
This study extends the literature by focusing on the connection between mentoring and early warning systems. It analyzes a mentoring program implemented for middle school students by an external partner that worked with schools to obtain access to early warning indicators of a drop-out outcome (data on attendance, behavior problems, course grades). The research thus focuses on how a “check-and-connect” approach can be extended from a school-based intervention to one that relies on help from external partners to provide a mentoring experience designed to help struggling students improve in attendance, behavior, and course performance, and thereby stay on-track to high school graduation.
Study Background and Research Questions
Because of its concern about helping to ensure that youth graduate from high school, the external partner organization 1 developed a mentoring program for middle school students that emphasizes (a) a personal relationship between a student and mentor, (b) intentional tracking of data on early warning indicators of a drop-out outcome (low attendance, behavior problems, course failures) and implementation of interventions in response, and (c) partnerships between the afterschool organization, school, and family to increase student success.
Member organizations in numerous cities nationwide received funding to implement the program for 3 years. Each member organization began program implementation by requesting the local schools or district to provide lists of students in grades six through eight who had early warning indicators of falling offtrack to high school graduation (patterns of poor attendance, behavior referrals, failure in reading or math classes), and these students were recruited for participation in the program. Member organizations either used program staff as members or recruited volunteers from the community. Training was provided for mentors on how to probe for how students were doing academically and socially in school, and how to talk about various issues with students (the importance of school, resolving problems, academic and behavioral issues, etc.). The program goal was for mentors to interact with students for at least 1 hr weekly in a relationship that would allow them to help students be successful in regular attendance, good behavior, and satisfactory course performance.
The 3-year evaluation study focused on five of the sites throughout the country where the program was implemented. Table 1 summarizes characteristics of these five districts. All had a majority of students eligible for free or reduced-price lunch, and in one of the districts, more than 90% of students met this criterion of low-income status. In four of the five districts, non-White students were in the majority, and in two of those, non-Whites constituted 95% or more of the student population. In one district, two thirds of students were English language learners. Table 3 summarizes program student characteristics. Nearly all were low-income minority students.
District Characteristics.
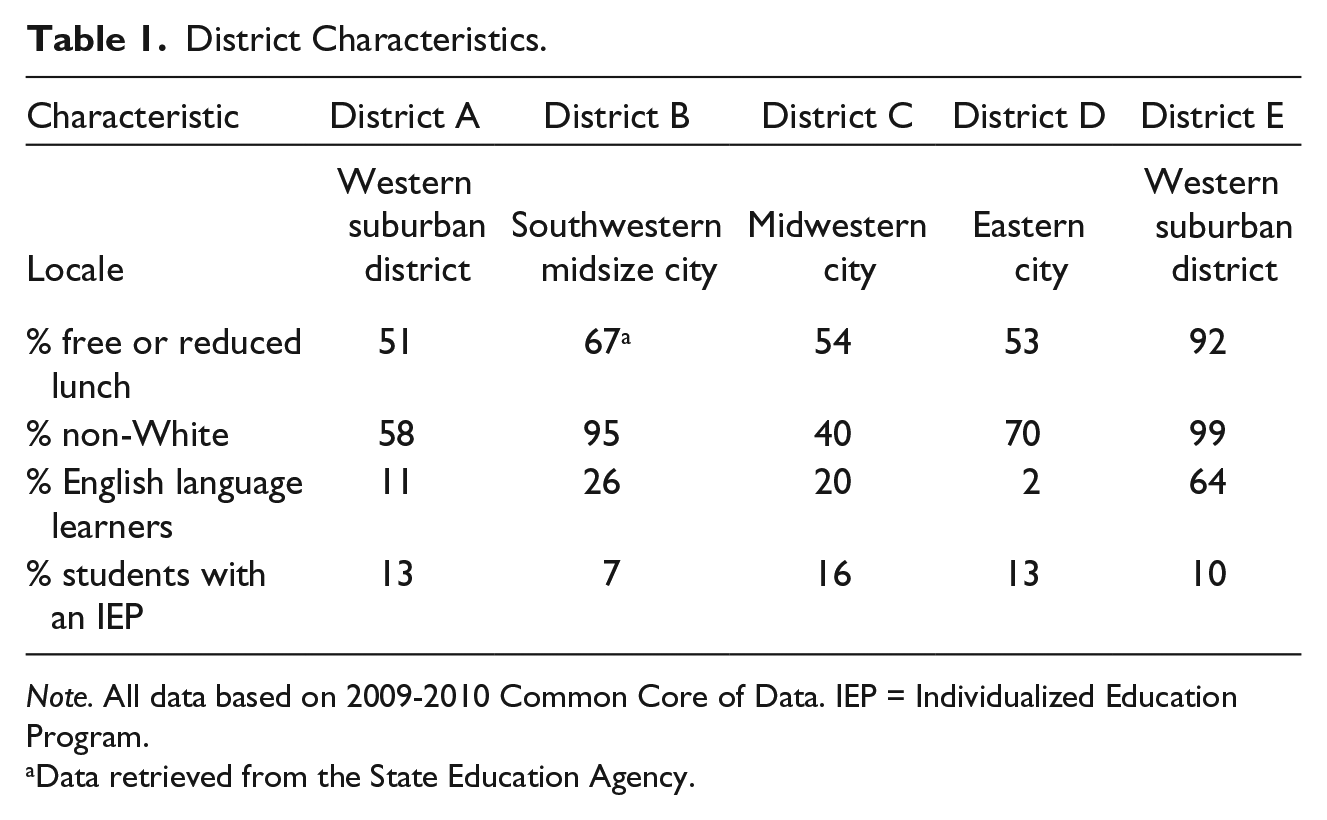
Note. All data based on 2009-2010 Common Core of Data. IEP = Individualized Education Program.
Data retrieved from the State Education Agency.
The evaluation study sought to address the following research questions:
Given the time frame of the study and the grade level of the participants, it was not possible to examine the ultimate outcomes of interest—high school graduation and postsecondary enrollment. But as many studies have shown (e.g., Balfanz et al., 2007; Neild & Balfanz, 2006), these intermediate outcomes are the primary predictors of a graduation outcome as well as postsecondary enrollment (Mac Iver & Messel, 2013).
Method
Data Collection
Institutional Review Board clearance was obtained for the study data collection procedures. The research team maintained regular email and telephone contact with the program directors from each of the five evaluation study sites throughout each of the 3 years of the study (2010-2011, 2011-2012, and 2012-2013) to keep abreast of program implementation issues. Site visits were conducted in each of the five districts each year. Field notes were kept for all contacts with program sites, and analyses identified common themes related to implementation challenges. Program sites provided preliminary and final lists of program student district identification numbers. The programs also provided data on number of student–mentor contacts from monthly contact sheets completed by mentors each year.
In Year 1, a short school engagement survey was administered to students in all program sites just after program enrollment and at the end of the 2010-2011 school year. Based on the work of Fredricks, Blumenfeld, Friedel, and Paris (2003), the survey items measured several dimensions of school engagement: emotional (happiness, excitement in school), behavioral (paying attention, following the rules), and cognitive (activities exercising the mind related to schoolwork). Each item was measured on a 5-point scale ranging from 1 = never to5 = almost always. Data were analyzed to measure increase in the three separate dimensions of engagement over the course of the year.
In Years 2 and 3, surveys were conducted among both students and mentors at each of the sites at the end of the school year (spring 2012 and spring 2013). The survey instruments were adapted from the Youth Mentoring Survey and mentor survey (Match Characteristics Survey) developed by Applied Research Consulting. Questions focused primarily on details of the mentoring experience, and perceptions of students and mentors of the experience. A process of consultation with program directors at each of the five sites to adjust question wording and select appropriate questions for the mentoring program resulted in the final questionnaire versions. The evaluation team met with directors at each site to help facilitate survey administration for each site, and partial administration occurred at several of the sites during the research team members’ visits in spring 2012 and 2013. Surveys were processed, and descriptive analyses were conducted by the evaluation team.
From each of the five districts serving students in the program, de-identified student-level data for the year prior to the beginning of the program (2009-2010) and the 3 following school years were obtained for all students in the grade-level range of the program students in 2010-2011 (e.g., data for all fifth through seventh graders in 2009-2010 when the program students were in Grades 6-8 in 2010-2011). Besides demographic and school status variables, these files included state test scores. Data on attendance rate, number of suspensions, and grades for reading/English language arts and mathematics were also requested from districts, but these were not available from all districts (particularly for the baseline year of 2009-2010).
Because it was not possible in this study to assign students randomly to the program or control group, the evaluation study followed a quasi-experimental design, using propensity score matching models to produce comparable treatment and control groups on sets of observed characteristics. (As expected, the program students differed significantly from the full group of nonprogram students within their districts because they were selected based on their at-risk characteristics.)
In our propensity score matching models, we used as many potential predictors of program assignment as were provided in prior year administrative data from participating districts. These predictors included demographic characteristics (gender, minority status, free or reduced lunch status, English proficiency, special education status/disability), academic ability characteristics (standardized reading/English test scores and standardized math scores, measured by proficiency levels, particularly when matching exactly on grade level did not produce the best overall match, and test scale scores did not have the same meaning across grade levels), and a behavioral characteristic (attendance) when available.
Propensity score calculations (using logistic regressions of all the available covariates on program participation) and the matching procedures were conducted for each district separately in the MatchIt program of the R statistical computing software. One of the advantages of using the MatchIt program is that diagnostics to check covariate balance in the matched data set are built into the software. The goal with propensity score matching is to achieve balanced treatment and control groups with respect to the observed covariates: A major advantage of the propensity score models is their ability to eliminate the problem of dimensionality by converting the entire set of covariates into a single propensity score. In other words, rather than matching treatment group cases to similar control group on each of the covariates, we matched only on the propensity score. We selected a nearest-neighbor algorithm to match control group cases to treatment group cases. Given the issue of mobility in this longitudinal study, we identified a group of six to 12 closest-matching students for each program student (rather than a single “nearest-neighbor” approach). Analyses indicated that each of the final models successfully eliminated significant differences between the groups for all of the observable characteristics. Baseline equivalence between program and comparison group students was achieved on all the available preintervention student characteristics.
Analyses were conducted using the matched comparison group identified in the process described above for the end of Year 1 analyses. For end of Year 2 analyses, we included all program students who had participated in both Years 1 and 2, together with the matched controls for these students only (excluding the matched controls for any students who were no longer in the program). Balance checks of the remaining program and matched control students were conducted again to ensure that there was still baseline equivalence between the groups. Because of significant attrition over the 3 years of the program, new students in Year 2, and the program decision not to enroll new students in Year 3 at most sites, we decided that the end of Year 3 analysis would include students who participated in the program for both Years 2 and 3. Given the new program students in this group, we conducted another propensity score matching procedure, based on baseline 2010-2011 data, to identify matched comparison students for this group of program students. (This procedure thus controlled for any Year 1 effects of the program for any of the Year 2 or 3 students who had also participated in Year 1, when matching included prior records of attendance, suspension, and failing grades in math or English).
Because we established baseline equivalence on all the available preintervention student characteristics, we used simple ANOVA to test the significance of differences in means between the treatment and control group on the dependent variables of interest. We also combined the five districts into a single analysis group of program and comparison students to conduct regression analyses, controlling for all the demographic and status variables that were available for all five districts.
Table 2 summarizes the data collection plan and analysis groups for the evaluation over the 3-year period.
Overview of Data Collection for the Program Evaluation.
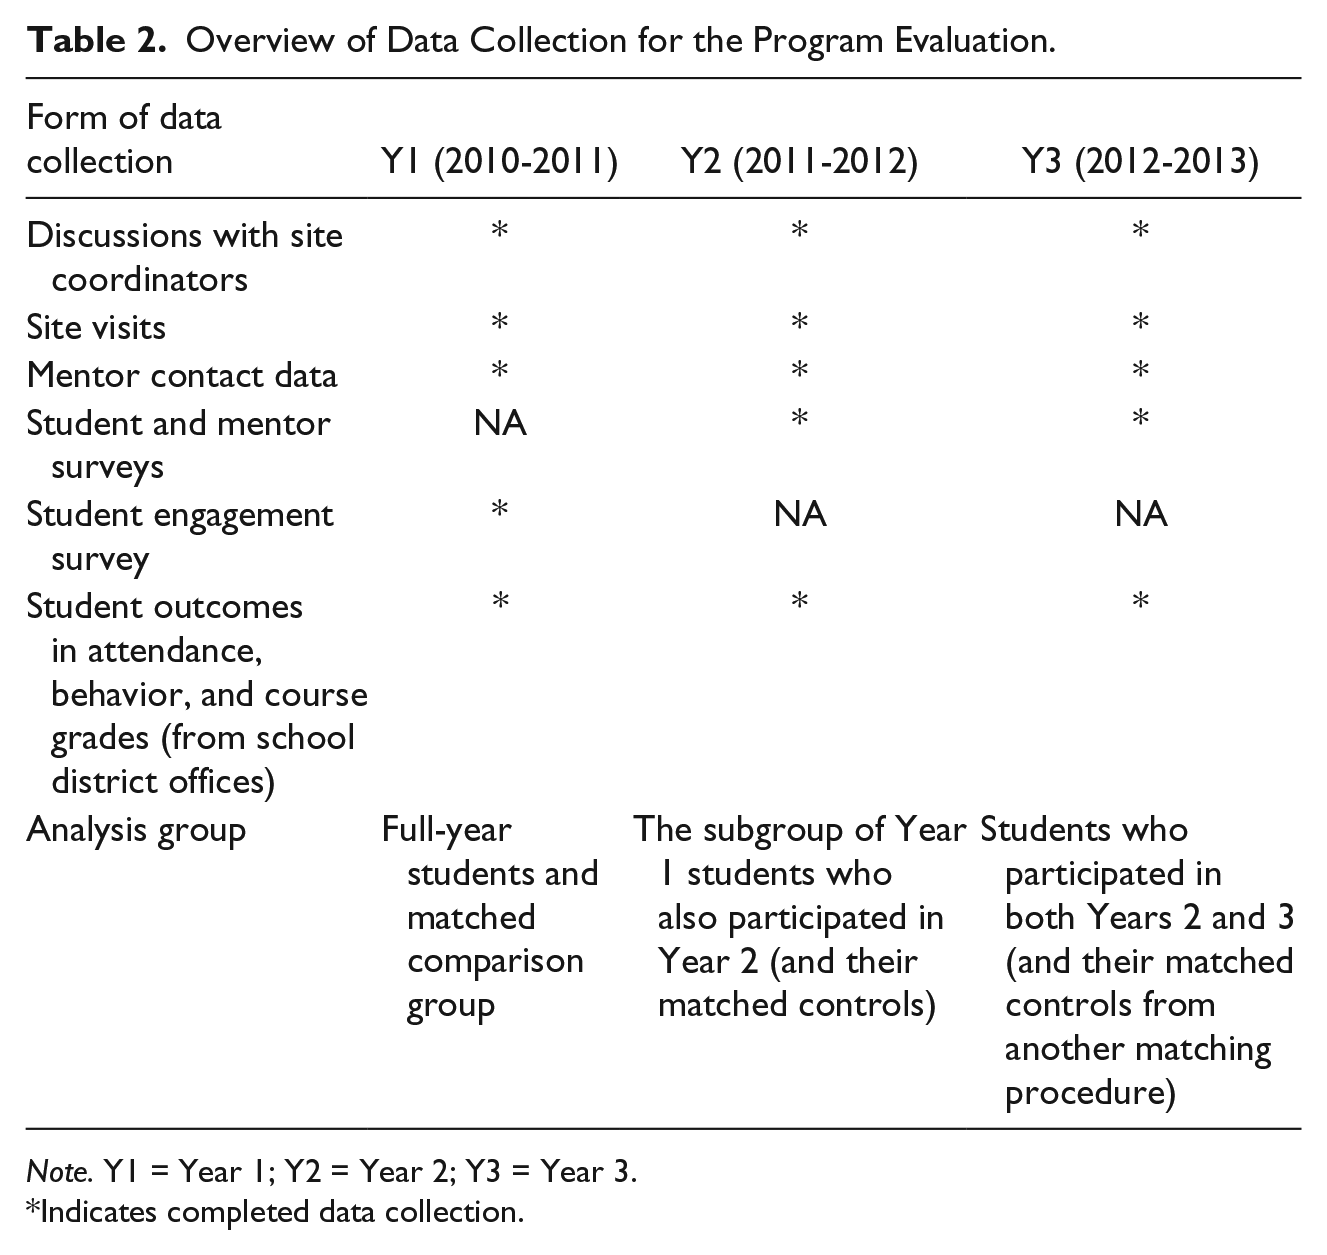
Note. Y1 = Year 1; Y2 = Year 2; Y3 = Year 3.
Indicates completed data collection.
Results
Implementation Findings
We first summarize general findings from our discussions with program staff and site visits focused on implementation issues. During Year 1, all five evaluation sites succeeded in recruiting students and mentors, implementing the program to some degree, and obtaining regular administrative data on program students from the school district on attendance, behavior, and course grades, which were submitted to the evaluation team at the end of the school year. At the same time, implementation of the program in the five evaluation sites varied widely in Year 1. In particular, the following implementation issues were noted during informal qualitative data collection in Year 1: (a) One of the sites had a notably late beginning in implementation, and another site had significant leadership turnover; (b) levels of mentor commitment varied considerably, and program students received different amounts of mentoring time; (c) students in some sites received a form of group mentoring rather than one-on-one mentoring; (d) mentors in some programs did not have access to student early warning indicator data until later in the school year; (e) mentoring occurred for some students at their school and for others at the program site.
As expected, implementation at the five sites improved in Year 2, compared with Year 1, as program directors addressed the challenges confronted in getting the mentoring program off the ground. Mentoring generally began earlier in the year (except when students had moved into new schools and new relationships with those schools had to be built to obtain access to students and student data). Overall, students and mentors reported high levels of satisfaction with the program in their survey responses, and the mentoring appears to be having a notable impact in helping many students negotiate the various problems that affect their performance at school.
Four of the five sites had a high degree of turnover in the students served between Year 1 and Year 2, and so the number of students who have received mentoring through the program for 2 years (the focus of the impact evaluation) is relatively small in those four sites. Given recruitment issues at several of the sites, there was no requirement to recruit new students in Year 3 to meet the enrollment targets. There was continued attrition of students from Year 2 to Year 3. Implementation at the five sites continued to improve in Year 3, as program directors addressed the challenges confronted in getting the program off the ground and running as planned.
We found wide variation in how the mentoring program was enacted across sites. Variation in implementation occurred in these broad areas:
Whether mentors are staff or volunteers
Extent to which mentors connect with each other to provide support and help each other be more effective
Extent to which mentors are supported administratively (with paperwork, etc.)
Where and when mentoring occurs (at school during school day, after school, or a combination of both in one site for different students)
Longer, more formal mentoring sessions versus shorter, more frequent informal “check-ins”
Extent to which data (especially course performance data) are regularly available
Although such variation is to be expected, as local sites seek to implement a program in a way that works well for their organization, it is difficult with a small group of evaluation sites to draw any firm conclusions about the impact of different ways of implementing the program. It might be worthwhile to explore these factors over the broader group of mentoring sites nationwide.
Although there was considerable variation in implementation, the sites generally faced a common challenge: significant turnover in leadership and mentors (as well as student population) over the 3-year period. Although this level of turnover is common in such an organization that relies on young adult staff who are particularly mobile, it does affect the level of impact that can be expected from a mentoring program, as new relationships between mentors and students are continuously having to be formed. The target student population is also particularly mobile. The degree of student attrition experienced by the program sites over the 3-year period underscores the difficulty in giving at-risk students enough of an intervention over time that could lead to a measurable difference in their academic lives.
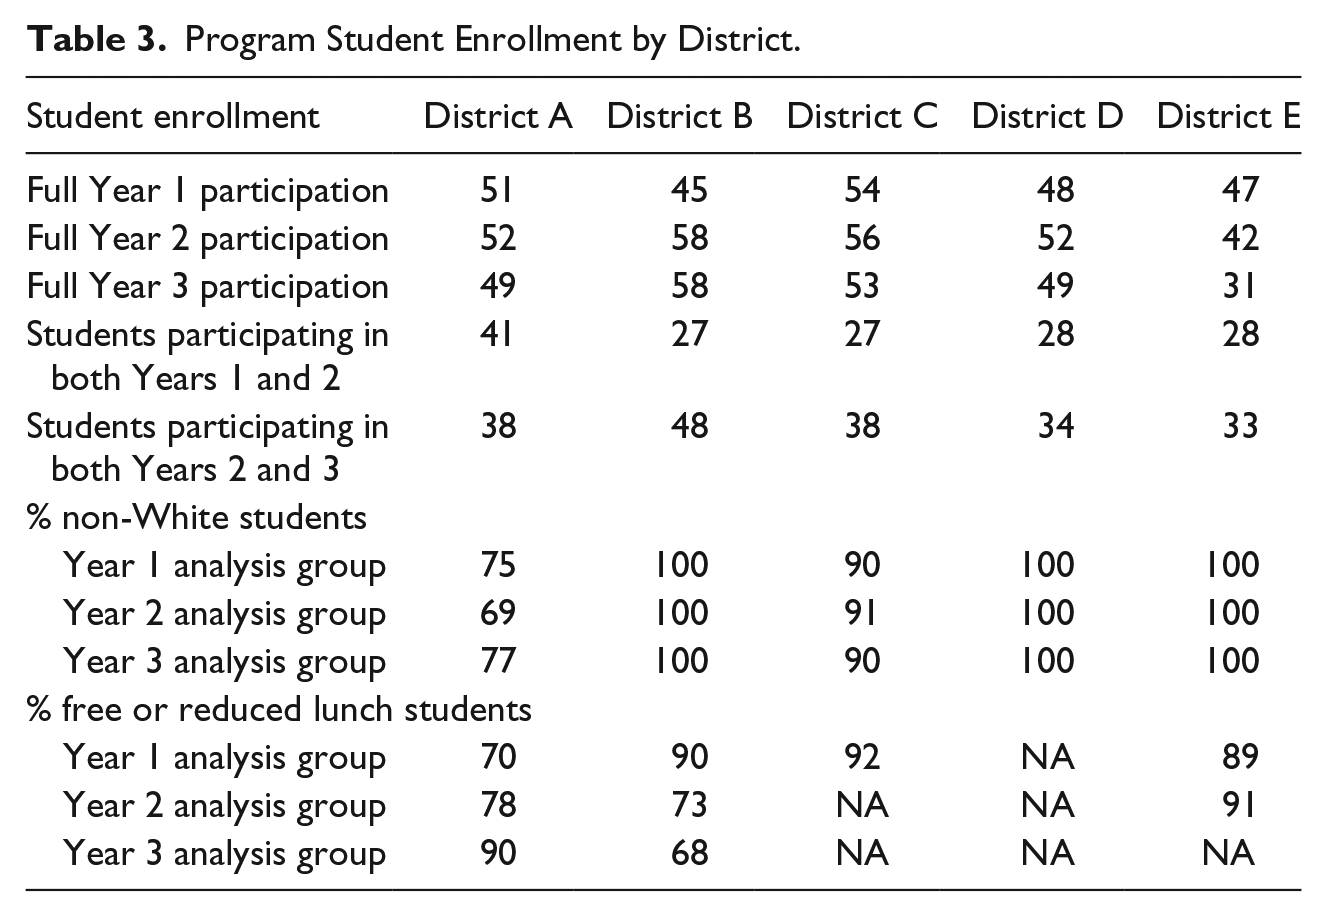
Table 3 summarizes program enrollment figures each year by site, as well as the number of students included in the analysis group for Year 2 analyses (participated in both Years 1 and 2) and Year 3 analyses (participated in both Years 2 and 3).
Program Student Enrollment by District.
To capture the students’ “dosage” of mentoring, the main program component, we used the sheets completed by mentors on their contact with students as a measure of program implementation. Table 4 summarizes the average number of mentor–student contacts (for full-year students) reported each year. The average number of mentor contacts per year ranged from 16 to 59. (To set the context, once a week for the entire school year would translate into 36 contacts). Data were missing for some students in most districts.
Average Number of Mentor–Mentee Contacts During School Year, by District.
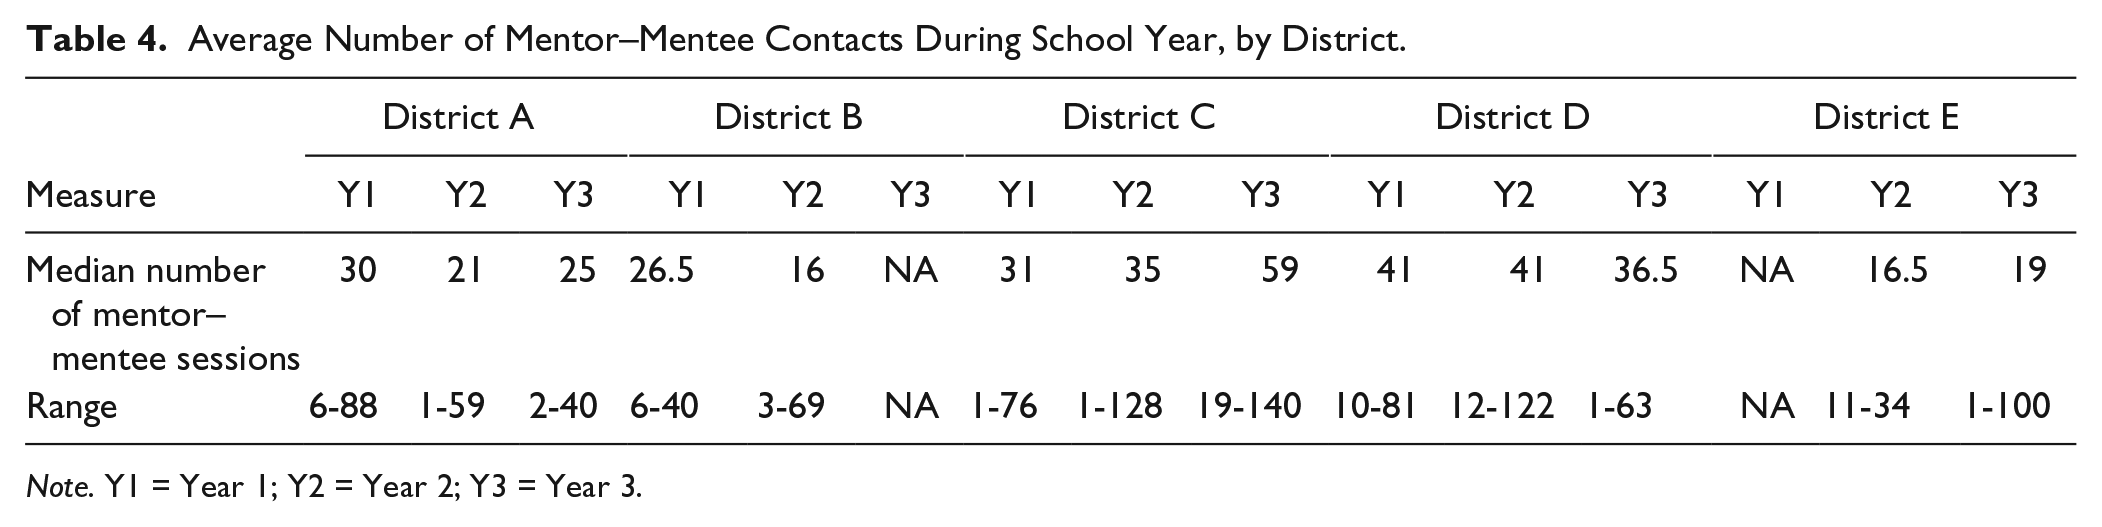
Note. Y1 = Year 1; Y2 = Year 2; Y3 = Year 3.
Student Outcomes
To analyze change in student engagement over the course of the program in its first year, mean scores (from all the answered subscale items) on the pre- and postengagement surveys were calculated for each type of engagement (emotional, behavioral, and cognitive). Only students with both a pre- and postscore were included in analyses. On average, student scores on each engagement subscale were as likely to decline as to increase (see Table 5). There was little, if any, evidence that participation in the program was associated with an overall increase in any type of student engagement, though average emotional engagement increased slightly in three of the five program sites.
Average Pre- and Postengagement Survey Scores in Year 1, by District.
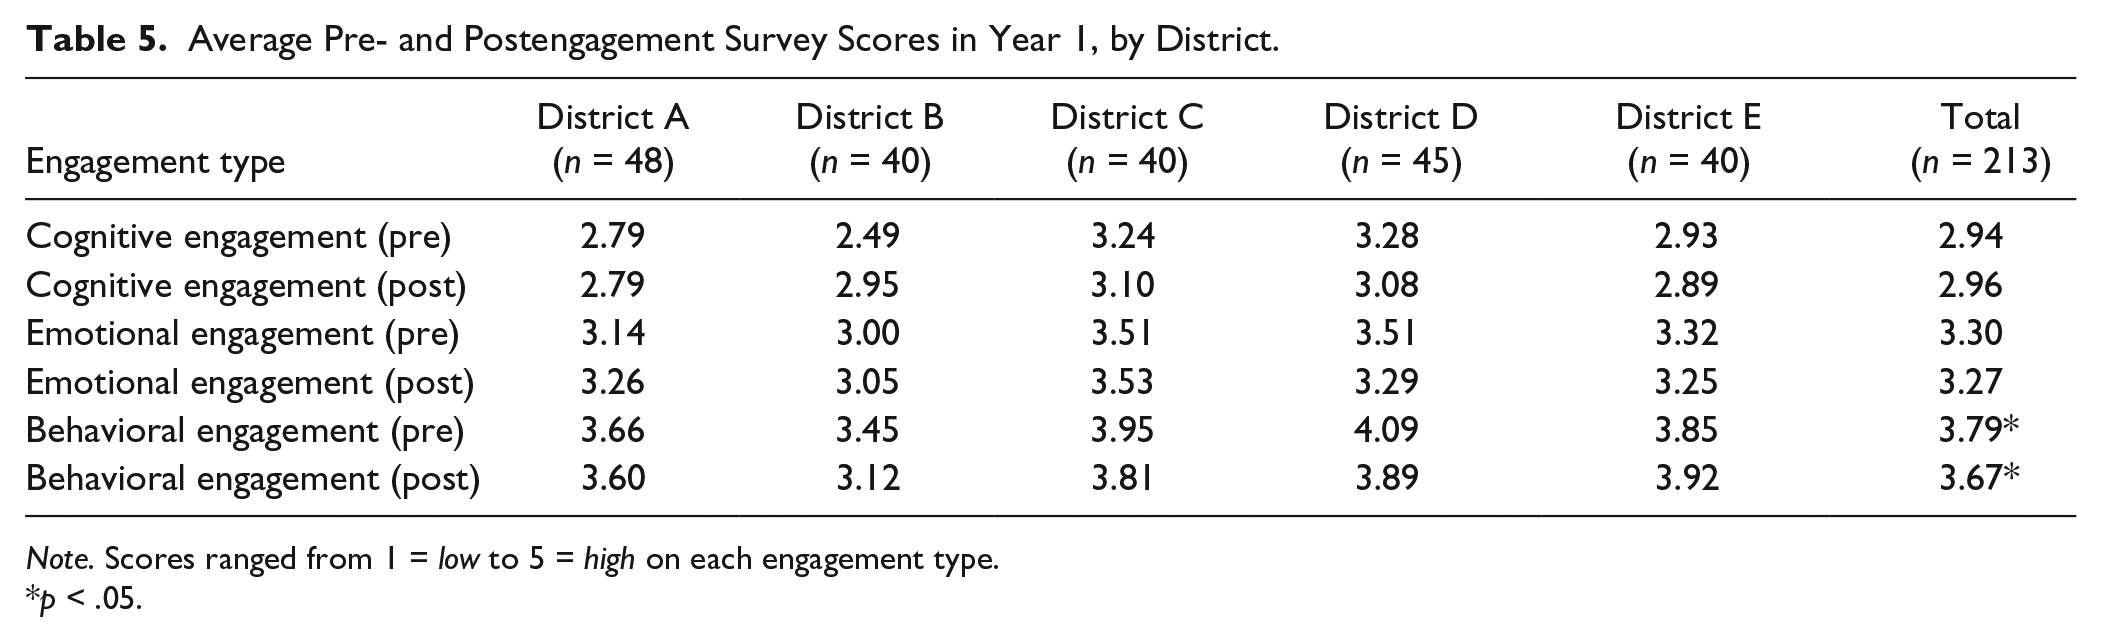
Note. Scores ranged from 1 = low to 5 = high on each engagement type.
p < .05.
Paired t tests were conducted for pre- and postmeasures of each type of engagement (emotional, cognitive, and behavioral) for the combined group of program students from all five sites. Gains over the year were not significant for measures of cognitive and emotional engagement. There was a significant decline in behavioral engagement across students in the five sites. Program staff did not have the opportunity to administer the survey to comparison students in the same schools as those attended by program students. It is possible that program students had a lower decline in scores than a comparison group might have shown, but there was no way within the context of this study to compare results with a control group. Gains in engagement were significantly correlated with number of mentor contacts in only one district. The engagement survey analyses were discontinued after Year 1 of the program.
The main impacts of interest were student outcomes on early warning indicators (attendance, behavior, and course failure) at the end of the year. Based on data provided by each district, the following end-of-year variables were created for each program and control group student: percent of school days attended (including a dichotomous measure of chronic absence, defined as attending less than 90% of school days), whether or not the student had been suspended, and whether or not the student had failed math, failed English/reading, had a poor math grade (D or F as final grade), and had a poor English/reading grade (D or F as final grade).
We focused on the extent to which the program was associated with lower rates of failure or poor grades, rather than on overall grade point average (GPA), as nongraduation outcomes are more closely associated with failure than with variation at the higher end of the grading scale (Balfanz et al., 2007).
Tables 6 to 8 summarize the differences in outcomes between the program group and the matched comparison group in each district for each of the 3 years, based on ANOVA results. Analyses are reported only for program students who were matched to a control group (some were not matched because of missing data for the prior school year). Additional analyses were conducted to determine whether inclusion of unmatched program students would yield different results (i.e., whether they had more positive results than the matched students whom the analyses might not be accounting for). We determined that the unmatched program students did not have significantly better results than matched program students and that exclusion of unmatched program students from analyses did not mask a potentially positive program effect. We also conducted additional regression analyses controlling for covariates when attrition had worsened the original balance between program and comparison students, but these analyses did not uncover any significant positive relationships between program participation and student outcomes.
Year 1 Outcomes for Program Students and Control Group, by District.
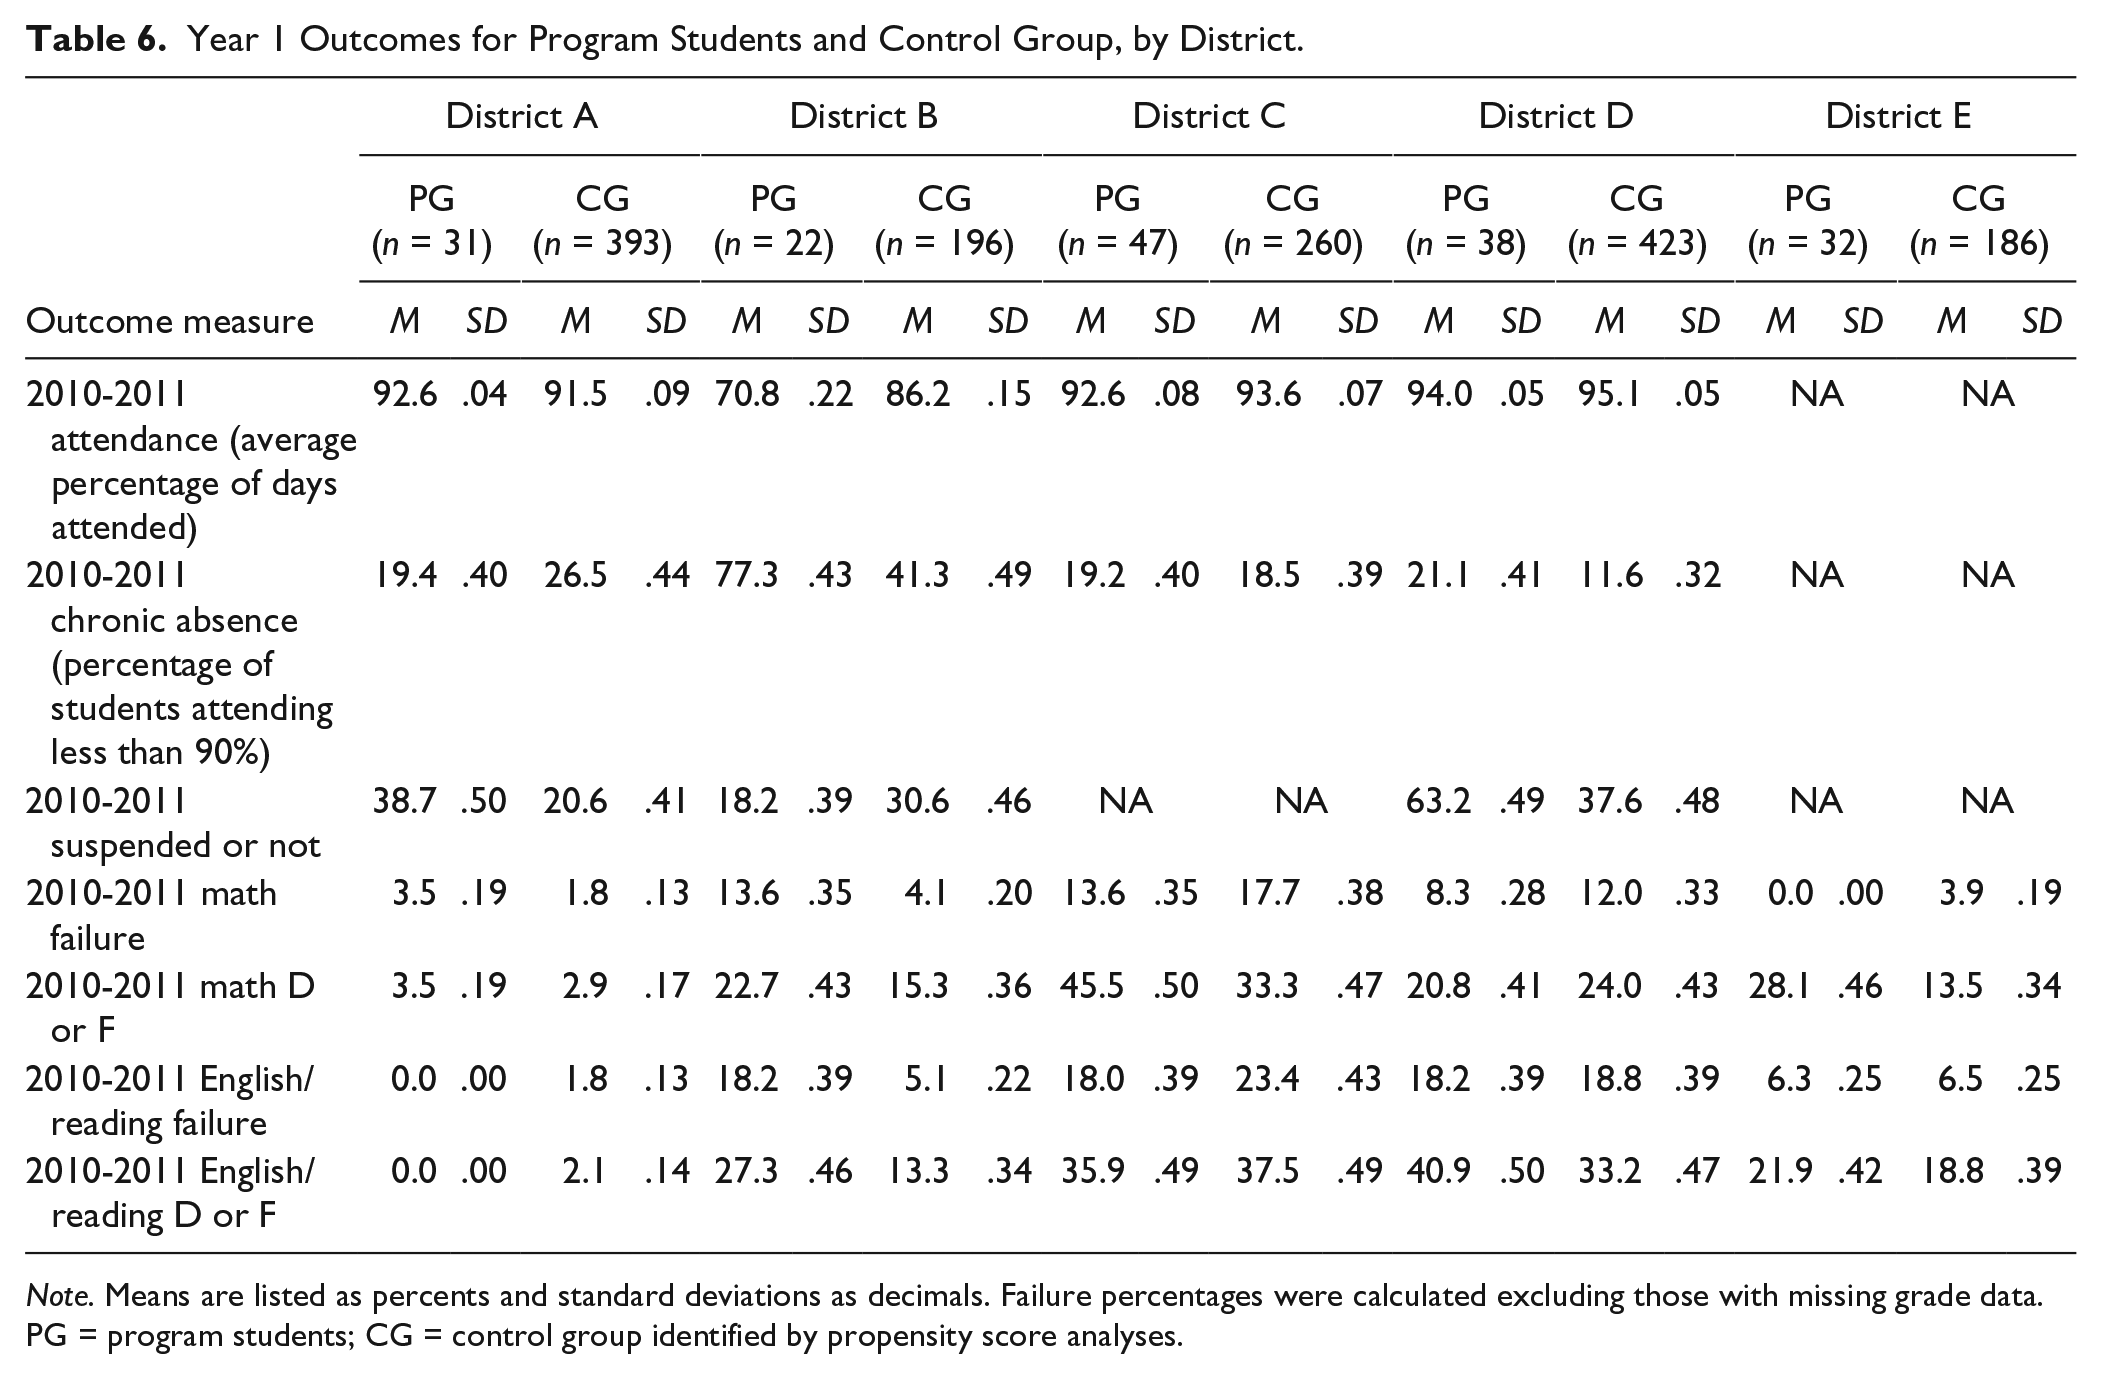
Note. Means are listed as percents and standard deviations as decimals. Failure percentages were calculated excluding those with missing grade data. PG = program students; CG = control group identified by propensity score analyses.
Year 2 Outcomes for Years 1 and 2 Program Students and Control Group, by District.
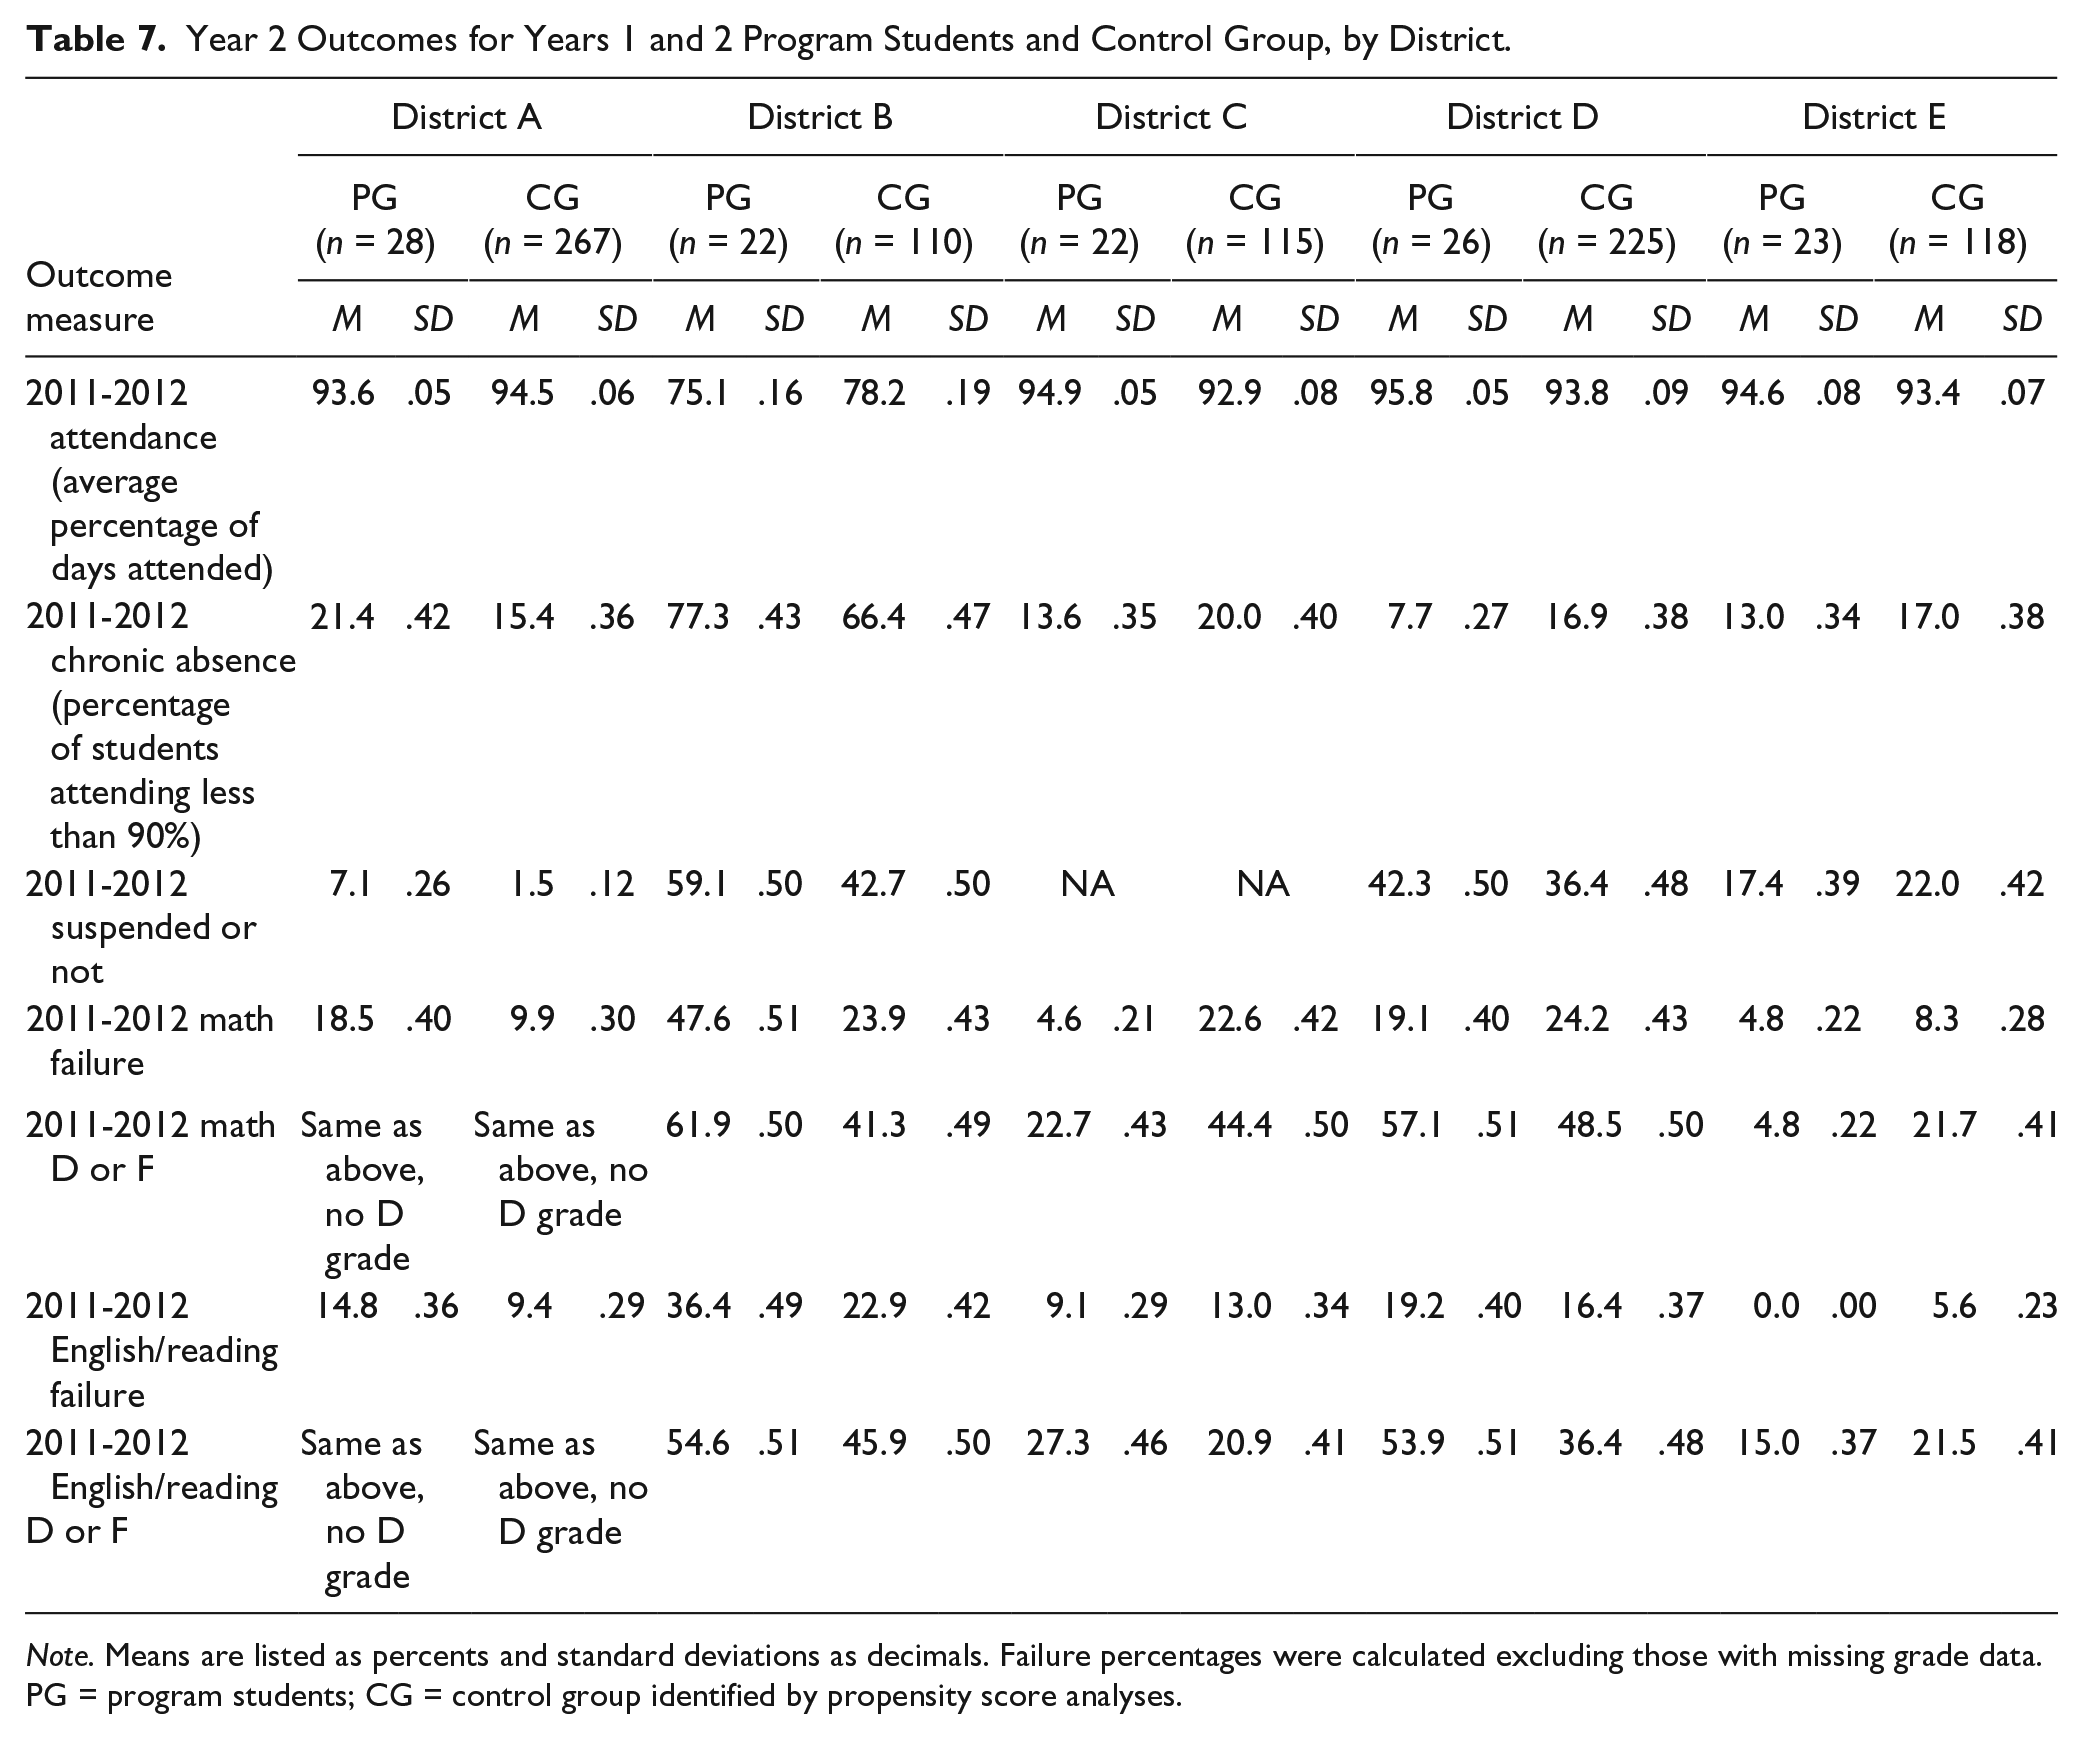
Note. Means are listed as percents and standard deviations as decimals. Failure percentages were calculated excluding those with missing grade data. PG = program students; CG = control group identified by propensity score analyses.
Year 3 Outcomes for Years 2 and 3 Program Students and Control Group by District.
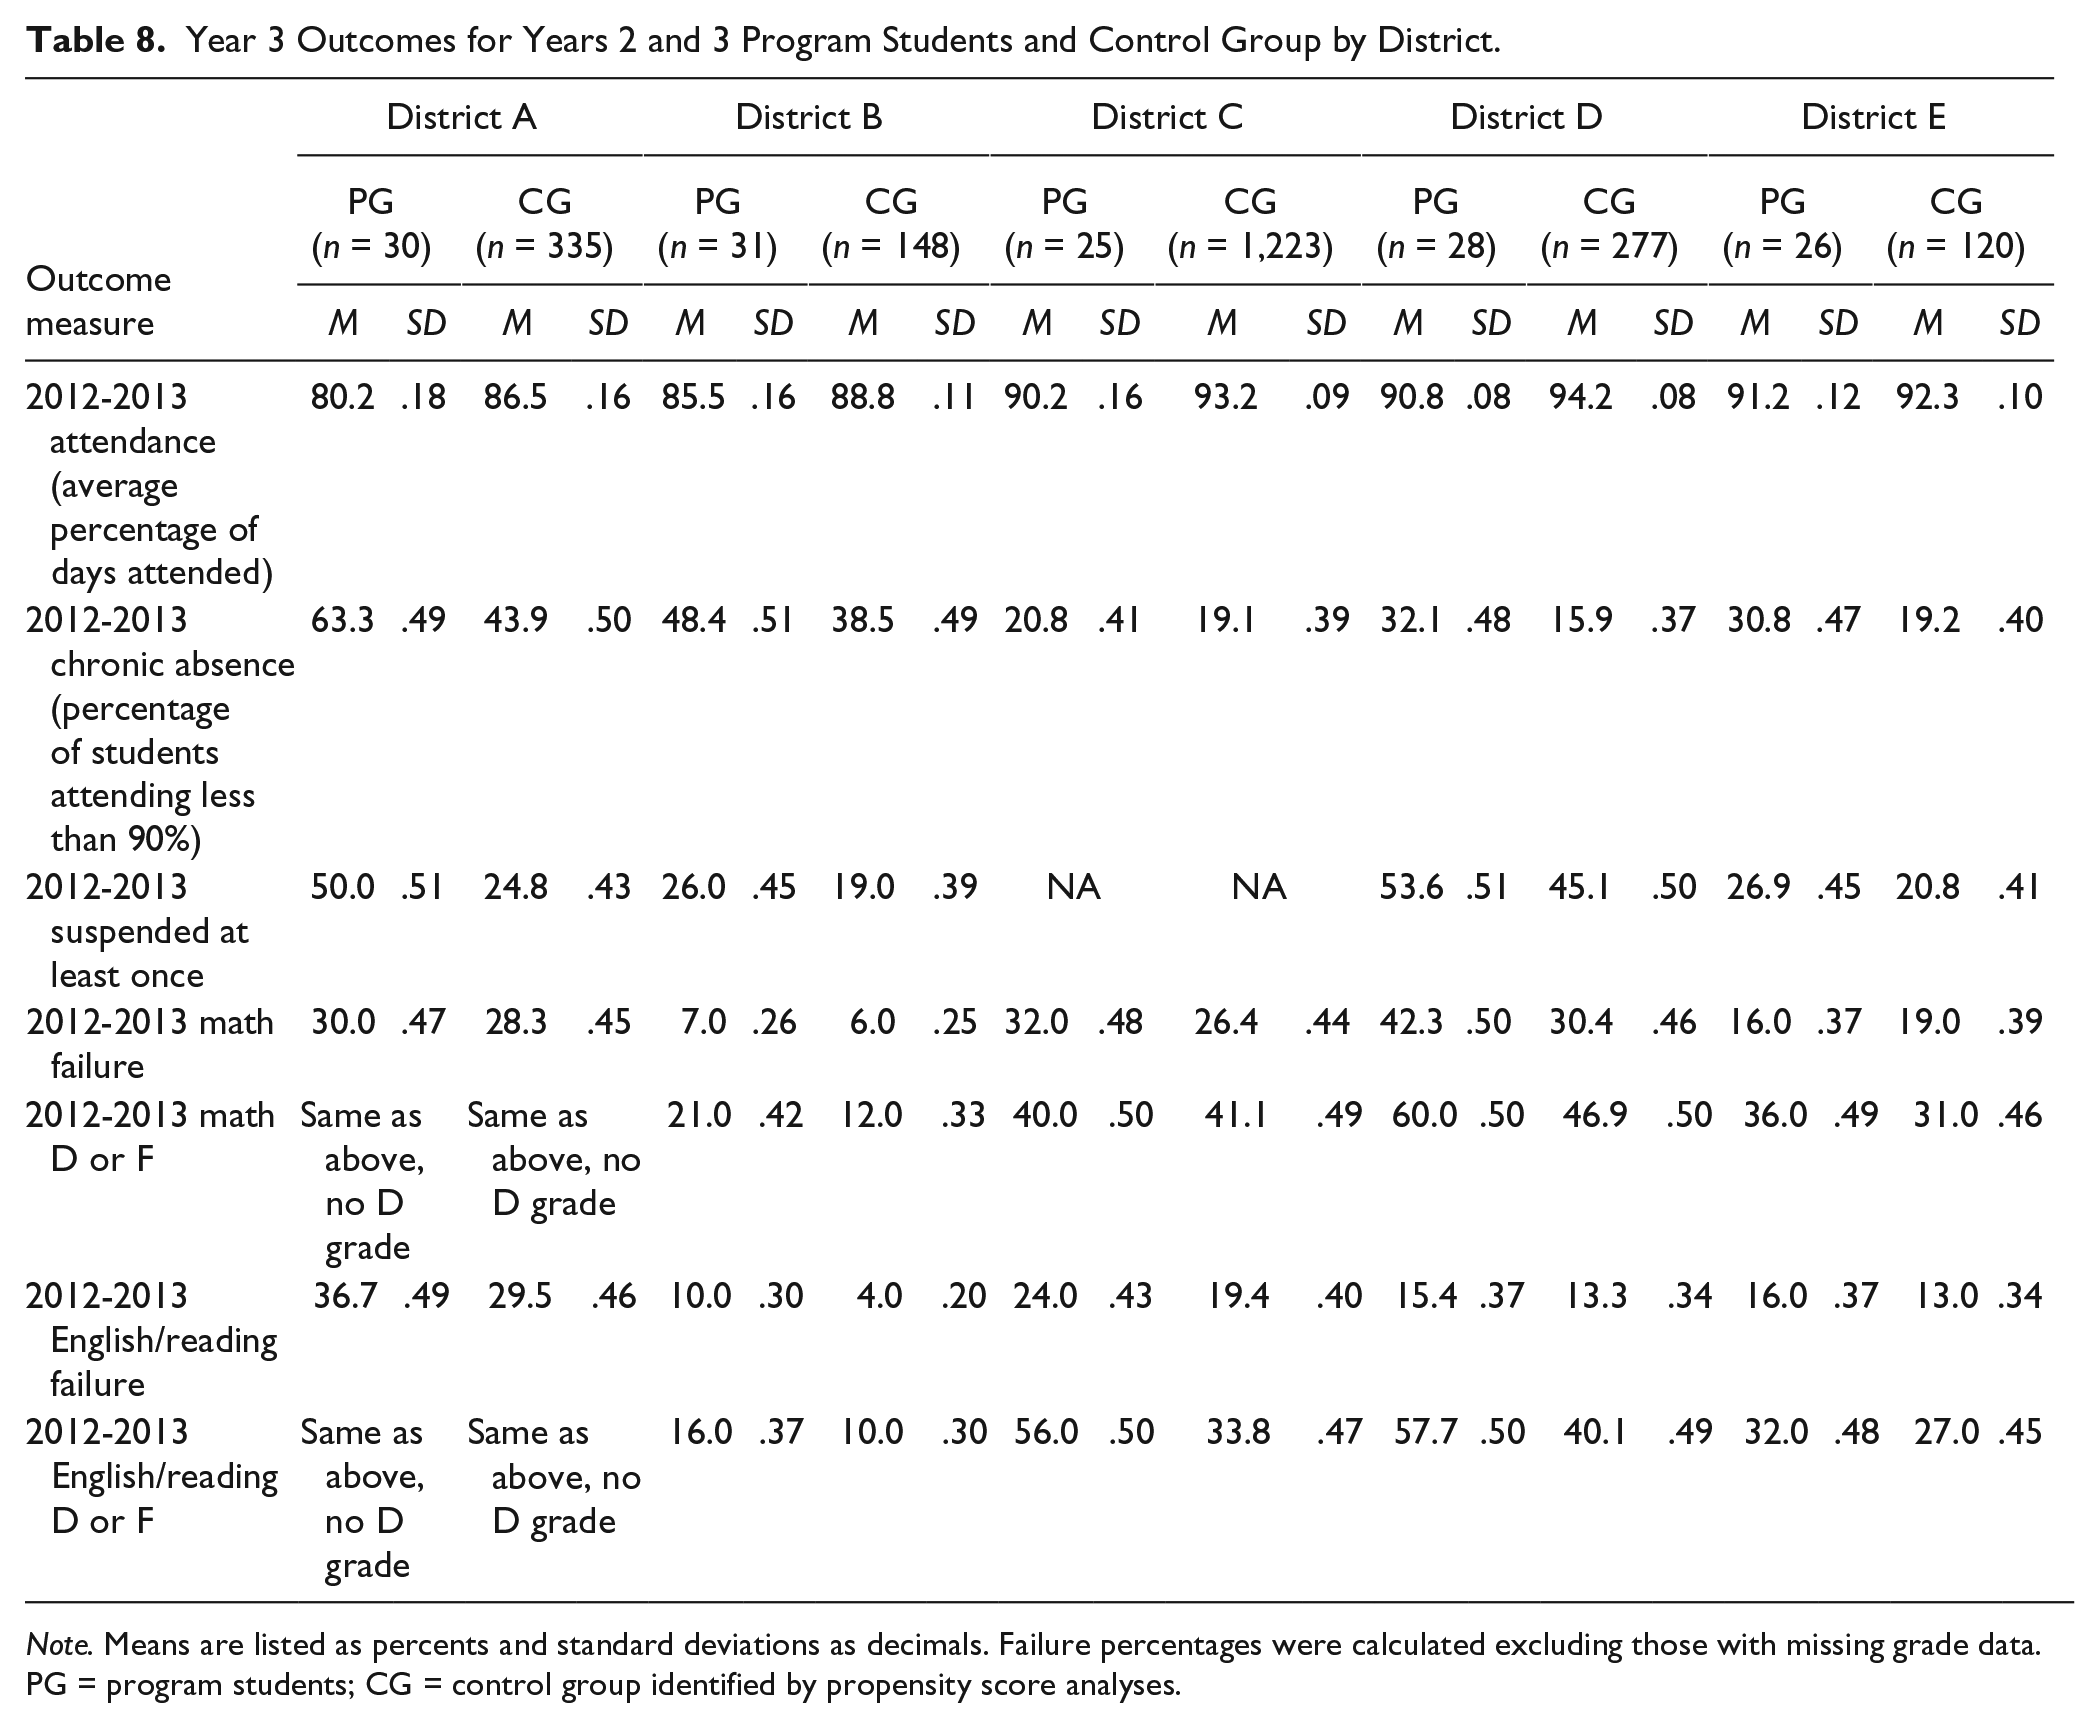
Note. Means are listed as percents and standard deviations as decimals. Failure percentages were calculated excluding those with missing grade data. PG = program students; CG = control group identified by propensity score analyses.
Analysis of the effects of program participation on mentored students at the end of Years 1 and 2 yielded some encouraging signs (particularly in course performance) but not sufficient evidence that the program had significantly better effect on student outcomes than the “business as usual” experienced by the comparison students at their schools and any other OST inputs they may be receiving. Comparison students did as well as or better than mentoring program students on nearly as many outcome measures. Analyses of outcomes at the end of Year 3 (for students who had participated in the program in both Years 2 and 3, together with their matched comparison group) also did not uncover any significantly positive effects of the program. Additional analyses were conducted on the pooled data sets for the Years 1 and 2 group and the Years 2 and 3 group to examine results for boys and girls separately, but there were no significant program effects for either gender. Controlling for demographic and prior attendance covariates in regression analyses also did not uncover any significant program effects. It is likely that students who had the same risk factors in attendance, behavior, and achievement as program students probably received other interventions from their schools that contributed to their school outcomes.
The number of contacts with the mentor during the school year was not found to be related to student outcomes in any systematic way. This is probably due to the large variation between sites in how mentoring was delivered (once a week vs. frequent short check-ins) and to the fact that students with more challenges may have received more frequent check-ins from their mentors.
Even though the program had no discernable effect on student outcomes available in district administrative data, program leaders related numerous stories of other positive impacts on students’ lives. Students also reported positive experiences in the surveys conducted in Years 2 and 3 (described below). Although student and mentor interviews would have provided richer data, particularly regarding ways the mentoring experience might have been improved or more information about why school outcomes may not have been improved as much as anticipated by program developers, resources available for the study did not permit the collection of sufficient quantities of interview data to draw reliable conclusions.
Student Survey Results
Table 9 summarizes response rates for student and mentor surveys in 2012 and 2013 (Years 2 and 3 of the study).
Survey Response Rates, by District and Year.
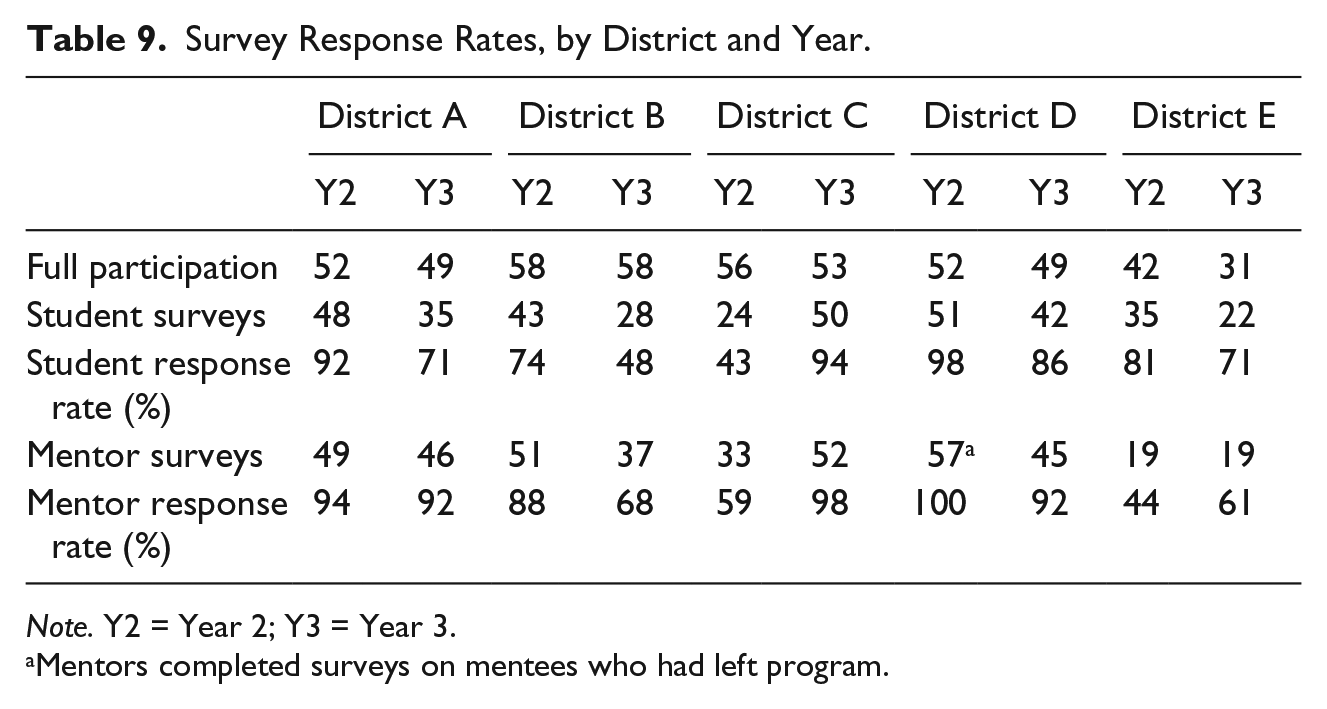
Note. Y2 = Year 2; Y3 = Year 3.
Mentors completed surveys on mentees who had left program.
Student surveys consistently indicated an overwhelmingly positive perception of the mentoring experience. Across both years, nine in 10 respondents in most sites reported a positive emotional connection with their mentors (feeling cared for, made happy, good match). Somewhat fewer, overall, but still large majorities reported that they “hit it off right away” with their mentor and that their mentor makes them “feel special.” In both years of the survey, about 90% of the student respondents felt that they could count on their mentor even though fewer reported they saw their mentor regularly. More than 80% said they talk to their mentor about problems, and about three in four reported that their mentor knows what is really going on in their life.
Asked about the outcomes of their mentoring experience, nearly all students said they have learned a lot from their mentor, and almost 90% believed their mentor was helping them make better decisions. In both years of the survey, more than three quarters reported their mentor has helped them with problems in life and thought that their mentor has helped them do better in school. Nearly all student respondents embraced the program’s goal, expressing the desire for their mentor to help them do better in school.
At both time points, two thirds of the students surveyed said they usually got to see their mentors at least once a week, and a total of roughly 90% reported contact with mentors at least twice a month. But the frequency of mentor contact reported by students varies considerably by site (and represents only those present to take the survey, who probably had higher rates of mentor contact). There is also considerable variability in the usual length of time that students spend with their mentors. In only one site did the majority of student survey respondents report generally spending more than 45 min at sessions with their mentors.
The student survey also captured information about what commonly took place during mentoring sessions through measures of perceived frequency of various activities. The items and mean responses from the Year 3 survey are displayed in Table 10. According to these surveys, on average, the most frequent activity during mentoring sessions was to “talk about how you are doing at school” (mean frequency of 4.2 on a 5-point scale from never to every time). Students also reported that they and their mentors would often “goof around and do things that make you laugh,” and talk about topics such as “how to behave well and stay out of trouble,” “good things that happen to you,” and “how to be a good person” (Ms = 3.9). Although slightly less frequent, students also reported that on average, at least half the time they and their mentors would talk about “problems you have or things that worry you,” “your family,” and “the things you care about the most” (Ms = 3.6). In terms of activities more directly related to academic achievement, students reported that approximately half the time, they and their mentors would “do activities that teach you something or make you think,” or “work on school assignments or projects together” (Ms = 3.3 and 2.9). Of the activities included in the student survey, by far the least frequently reported was to “do things that are boring or that you do not like” (M = 1.9).
Students’ Reported Frequency of Mentoring Activities.
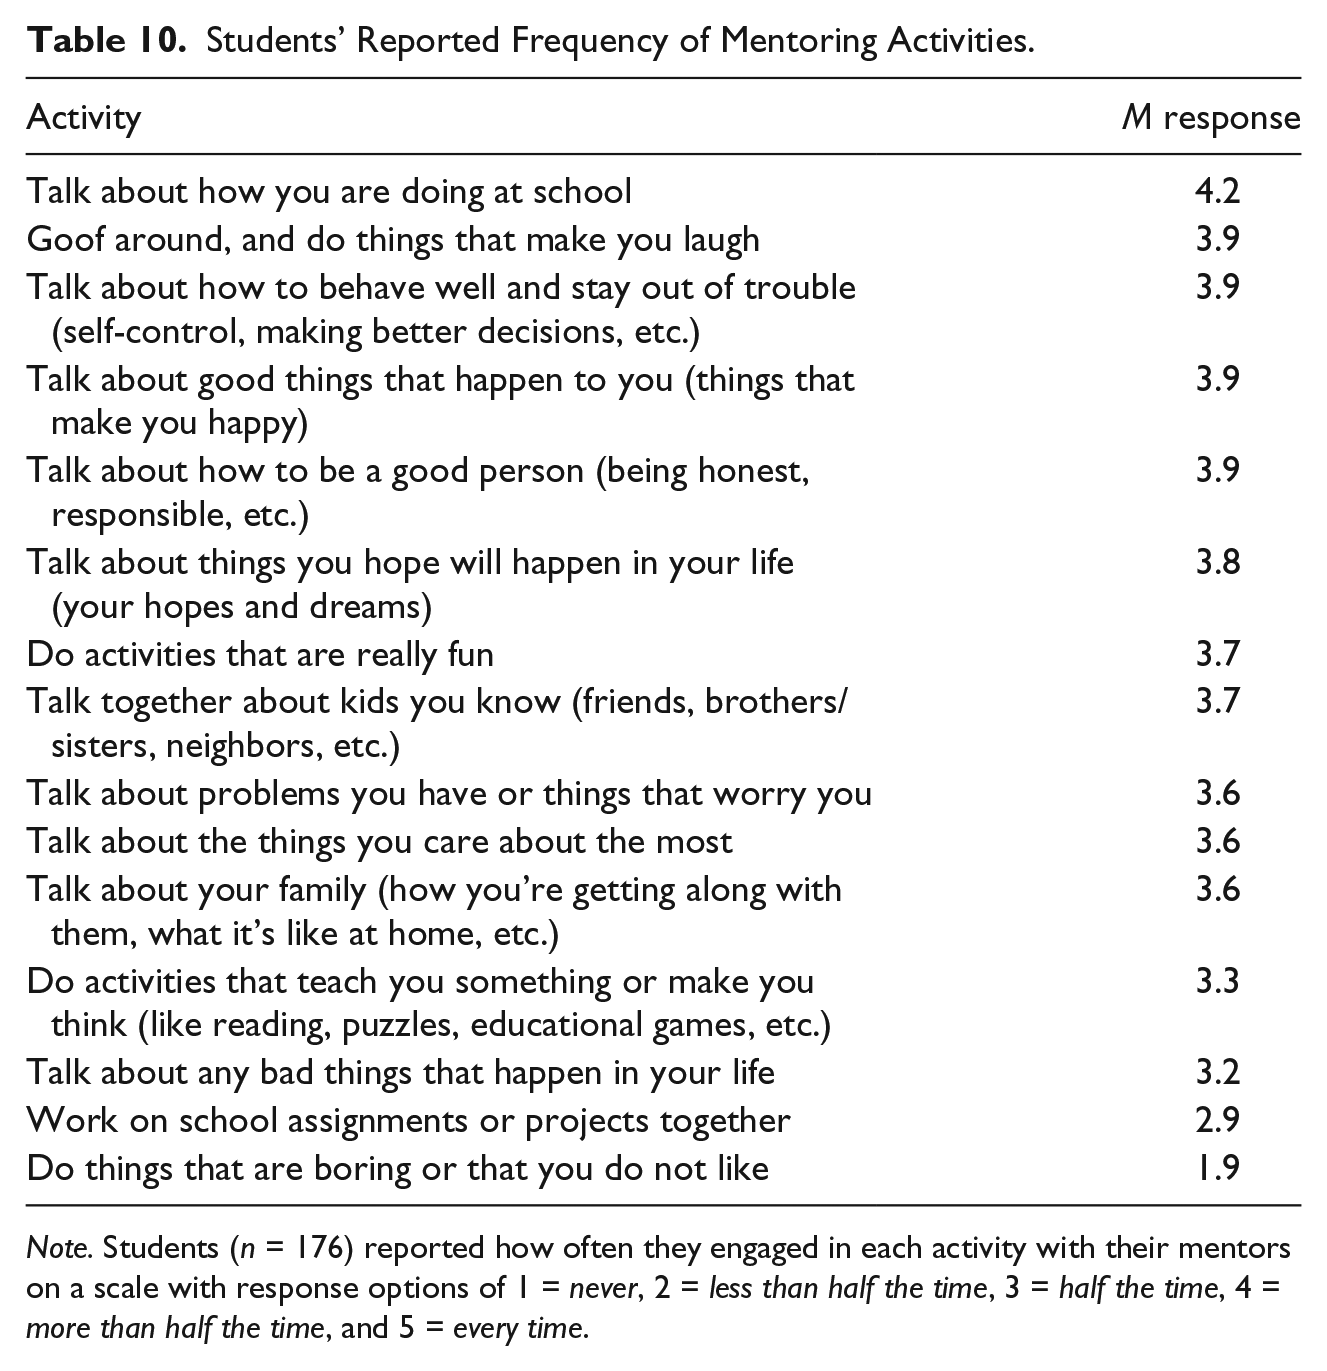
Note. Students (n = 176) reported how often they engaged in each activity with their mentors on a scale with response options of 1 = never, 2 = less than half the time, 3 = half the time, 4 = more than half the time, and 5 = every time.
Particularly in Year 3, boys were somewhat less likely than girls to say “my mentor knows what is going on in my life” and “has helped me with problems in my life.” Boys were also more likely than girls to “wish my mentor would not try so hard to get me to talk about things I don’t want to talk about.” Girls were more likely than boys to report contact with mentors on Facebook or through email/phone/text.
Mentor Survey Results
The matching of students to mentors also appears to have succeeded well according to mentor surveys. Approximately nine in 10 mentors each year reported feeling well matched with their student, and many reported thinking they “hit it off right away” with their mentee and have similar interests, especially in the Year 3 survey. In particular, eight in 10 or more of the mentors surveyed believed that they “have had experiences that help me understand the important challenges and issues in my mentee’s life” or that “my background makes it easy for me to relate with my mentee.” At the same time, one in five consistently reported that “my mentee needs more from me than I can give.”
Overall, a large majority (85%-86%) of the mentors surveyed each year felt like they were making a difference in their student’s life and that the relationship had gotten stronger over the year (87%). Few (15%) reported feeling frustrated with how things were going in either year of the survey. At the same time, roughly a third of the mentors in three sites confessed that they were “so busy that it is hard to see their student regularly.”
Mentors consistently reported relatively high levels of students seeking nonacademic support from them. Most mentors (86% in Year 2 and 91% in Year 3) characterized their student as “willing to learn from me,” and roughly three quarters each year reported that their student “asks for my opinion or advice” and “makes me aware of his or her problems or concerns.” Mentor survey responses indicated a somewhat lower level of student openness to academic support, with considerable variation across sites. Still, majorities said that their mentee “seems to want my help with his or her academics” (62% in Year 2 and 60% in Year 3) and “asks me for help when he or she has difficult schoolwork or a major project to do” (up slightly from 54% in Year 2 to 59% in Year 3).
Discussion
Documenting evidence of promising interventions to help keep students on-track to graduation is crucial for policymakers and practitioners who are seeking to address the drop-out problem in the United States. Although this study provides evidence of positive student reactions to a mentoring program organized by an out-of-school youth development organization and some encouraging student outcomes, there was no definitive evidence of a positive program effect on student attendance, behavior, or course passing rates, even over a 2-year period. 2 Before addressing possible reasons why the program had no discernable effect on these outcomes (below), we first address the limitations of the study design.
It is possible that the study design was not able to uncover a truly positive effect. Although the propensity score matching yielded a comparison group with baseline equivalence on the matching variables, the study’s quasi-experimental design, like all such designs, was subject to potential unmeasured bias in the selection of program participants. Issues with data availability from school districts did not permit matching on all the variables potentially related to program selection and program impact. Even though matched comparison group students were equivalent to program students on the matching variables, they could have differed in some unmeasured way that would explain why their performance (without receiving program mentoring) was not significantly less positive than the performance of program students.
Although random assignment of students to the program or control condition would have been a stronger design, such a design would have been subject to noncompliance among the students assigned to program treatment and to differential attrition that could undermine internal validity. Program participation could not be compelled. The program was not oversubscribed, and recruitment goals (not to mention a doubling of recruitment goals) were not always met. Noncompliance in participation in a randomized study would have been a high probability.
Within the framework of the study’s quasi-experimental design, it is possible that program effects will take longer than 2 years to be evident. The attendance effects of Check and Connect (Sinclair, Christenson, & Thurlow, 2005) emerged in Year 3 and later, and the most salient effects reported were found in the fact that students were “still in school” after 4 and 5 years since ninth grade, rather than having dropped out. The program’s implementation challenges may have affected the impact that could be expected on participating students. Many students had changes in their mentor, which could have attenuated the impact of the intervention (Grossman, Chan, Schwartz, & Rhodes, 2012). The duration of the mentoring relationship, as well as the typical length of mentoring sessions, was also considerably shorter than in mentoring interventions that have been associated with positive effects on academic outcomes (Herrera et al., 2011; Rhodes, Grossman, & Resch, 2000).
Alternatively, it is possible that comparison students received other school-based interventions that helped them to perform at about the same level as program students overall. Anecdotal evidence from one of the districts suggests this was the case for a number of comparison students, and this could be the case in other districts as well. It may be that programs directed and implemented by organizations external from the school are not as well positioned to have an impact on academic outcomes as programs integrated within the fabric of the school itself.
The findings of this study correspond with other recent findings. Although there have been some positive findings regarding the impact of mentoring (e.g., Dubois et al., 2011; Gordon, Downey, & Bangert, 2013), other recent rigorous studies of mentoring (e.g., Bernstein et al., 2009; Herrera et al., 2011) did not find sustained impact on academic outcomes. Recent studies are probing the mediating variables through which mentoring may exert effects and have greater effects for some groups than others (e.g., Chan et al., 2013). Grossman et al. (2012) pointed out the shorter average length of school-based mentoring relationships, compared with community-based mentoring relationships. More rigorous research on how the costs and effects of group mentoring compare with those of one-to-one mentoring would be a useful extension of the current study, particularly given the implementation variation that emerged (but could not be systematically or rigorously studied) during the course of the current study (see Huizing, 2012, for a review of research on group mentoring, which emphasizes this need for additional research).
It may be that the mentoring received by students in this program is having other effects, not measured in this study, which will yield other positive outcomes for students in years to come. It is possible that there was an undetected program effect on student attitudes or socioemotional outcomes such as trust in adults, more positive peer relationships, more positive relationships with parents, and so on. Study resources did not allow for a broader investigation of student attitudes in both the program and control groups that could have detected such an effect (though, as noted earlier, the engagement survey conducted in Year 1 did not yield findings of increased engagement for program students from baseline, and randomized studies [e.g., Bernstein et al., 2009] have not detected significant effects on pro-social behaviors or measures of school engagement).
Our study findings emphasize that even a carefully designed and relatively well-implemented mentoring program may not have the expected impact on student academic outcomes in the short run. Ironically, the “goal-directed focus” of improving the behaviors that identified the students for recruitment into the program, even if not the explicit focus of mentoring interactions, may have framed the mentoring in the “prescriptive” direction that Karcher and Nakkula (2010, pp. 17, 29) characterized as generally less effective. This, together with the fact that intervention was provided by actors from outside the school context who had little influence on family- and school-related factors associated with the academic outcomes, could help explain why such a positive thing as regular mentoring may not have been able to achieve the intended goal.
It may be the case that mentoring interventions such as this one, delivered largely outside of school time by individuals from external organizations, do not sufficiently address the broader school-related factors associated with student success. Even though they provide a caring mentor who encourages good behaviors like attendance and homework completion, they do not influence the quality of teacher–student relationships, the classroom climate, or the relevance and rigor of classroom instruction. Mentoring does not influence the school environment, which is so critical to student outcomes. Weekly or biweekly interactions with a mentor do not provide the daily interactions with encouraging parents and teachers that may be vital to student success.
The results of this study and others with similar findings should not be interpreted to discourage mentoring interventions for struggling students who need positive interactions with caring adults. They should instead push youth development and educational practitioners to potentially consider more integrated approaches that involve school-based administrators and families working together with external human resources to meet the needs of struggling adolescents through mentoring and other interventions that will keep them positively engaged in school to ensure a successful transition into high school and from high school to postsecondary education and/or the workplace.
Footnotes
Declaration of Conflicting Interests
The author(s) declared no potential conflicts of interest with respect to the research, authorship, and/or publication of this article.
Funding
The author(s) disclosed receipt of the following financial support for the research, authorship, and/or publication of this article: The authors received financial support for the research, authorship, and/or publication of this article from a source that prefers not to be identified.