



Abstract
This study examines whether community-level social disorganization and community engagement initiatives are associated with public high school performance. Analyzing data from the National Center for Education Statistics (NCES) School Attendance Boundary Survey (SABS), a latent variable measuring community-level social disorganization is examined within a structural equation model for 302 traditional public high schools in Florida. The study finds a statistically significant and large negative association between community-level social disorganization and a latent variable representing Florida Department of Education performance metrics. Correspondingly, the recognition of receiving the Florida Five Star School award for satisfying recommended community engagement criteria is positively associated with high school performance with social disorganization factors simultaneously considered. This research hopes to further provide an emphasis for recognizing and engaging community within the context of addressing disparities in public education performance.
Introduction
Since the introduction of No Child Left Behind (NCLB), states have been obligated to reward or punish public schools based on standardized performance measures despite the expressed intent of helping the most vulnerable populations (NCLB, 2002). Through this process, low-income neighborhood schools increasingly struggle (Bogin & Nguyen-Hoang, 2014; Rosiek & Kinslow, 2015). Recognizing inadequacies with NCLB, its replacement Every Student Succeeds Act (ESSA, 2015) returned substantial discretion to states but kept much of the standardized testing accountability framework (Mathis & Trujillo, 2016).
Adopted in criminal justice research, social disorganization theory attributes variations in crime and delinquency to a breakdown in communal structure and relationships. Relatedly, community-level social disorganization has been associated with lower student academic achievement (Baker et al., 2001; Bowen et al., 2002; Madyun, 2011). A primary question of this study is whether community-level social disorganization impacted Florida public high school academic performance for the 2010 to 2011 school year. This research examines aggregate data at the high school attendance boundary catchment area-level for each unit of analysis, a traditional Florida public high school. To assess if any impact of social disorganization may be offset by community engagement, the research tests whether the satisfaction of the Florida Five Star School award, recognizing community engagement activity for an individual school, is positively associated with public high school performance with community-level social disorganization simultaneously considered. Data is analyzed through structural equation modeling (SEM) as it combines confirmatory factor analysis and path analysis to measure associations between theoretically-based constructs. Measurement models within the SEM framework also diagnose which observed variables may be stronger indicators within each latent construct (Hancock, 2003; Wan, 2002).
Social Disorganization
Social disorganization theory suggests community-level low socioeconomic status combined with higher rates of family disruption factors, ethnic heterogeneity, and urban proximity lead to increases in neighborhood dysfunction and criminal behavior (Law & Quick, 2013; Lowenkamp et al., 2003; Patterson, 1991; Sampson & Groves, 1989; Steenbeek & Hipp, 2011). Unfortunately, many if not all of these community-level factors are outside the scope of a public school district’s control. Even within the same district, students from more affluent neighborhood schools are more likely to outperform their low-income neighborhood peers (Schnellenberg, 1998). The greater privilege and access afforded children within a greater educated and affluent community is consistently associated with higher academic scores (Davis-Kean, 2005; Johnson, 2012; Reardon, 2016; Sirin, 2005; White, 1982).
White’s (1982) meta-analysis examining 200 studies found that socioeconomic status (SES) is only weakly correlated with academic performance at the individual-level, however when aggregated to the community-level the relationship accounted for approximately 75% of variance. Similarly, Davis-Kean (2005) examined parental socioeconomic status and child educational outcomes using SEM and found that SES factors are positively associated with children’s academic achievement with the parent’s years of schooling the prominent factor. Sirin (2005) replicated White’s (1982) meta-analysis on the relationship between SES and education outcomes, and also reported a significant positive correlation. Finally, examining 83 studies on the relationship between neighborhoods and schools, Johnson (2012) concludes that while there is an important relationship between a child’s neighborhood and education outcomes, better conceptualization between neighborhood and school processes is needed. This study hopes to address some of those concerns.
Family disruption factors such as single-parent households, divorce or separation rates, as well as residential mobility have been correlated with challenges to community well-being (Baker et al., 2001; Bowen et al., 2002; Law & Quick, 2013; Madyun, 2011; Sampson & Groves, 1989). Astone and McLanahan (1991) found that children living in a single-parent household or with step-parents are less likely to receive encouragement and help with school work than those living with two natural or adopted parents. Divorce and separation of parents has been associated with significantly lower reading scores as well as a propensity for behavioral problems in the immediate years following the disruption (Amato & Keith, 1991; Arkes, 2015). Understandably, studies analyzing several social disorganization indicators often find correlations between the factors themselves. For example, Astone and McLanahan (1994) later found that children in single-parent households were more likely to have moved or changed schools than children living with both original parents.
While initially excluding an education application, many researchers have recognized the contextual utility of social disorganization theory applied to other societal dysfunctions including academic performance (Baker, 2000; Bowen et al., 2002; Madyun, 2011). Broadly applied as societal constraints or influences within a specified geographical area, studies have validated the theoretical model (Law & Quick, 2013; Lowenkamp et al., 2003; Patterson, 1991; Sampson & Groves, 1989; Steenbeek & Hipp, 2011). For example, Lowenkamp et al. (2003) replicated earlier Sampson and Grove theoretical tests and found similar results that “illuminated an underlying empirical pattern that has persisted over time” (p. 351). Notably, Steenbeek and Hipp’s (2011) 10-year longitudinal study in the Netherlands suggests that not only is social disorganization associated with higher levels of crime from a causal perspective, but past concentrations of social disorganization may lead to increased future disorder.
With considerable research on social disorganization theory existing in the urban setting, findings of generalizability to the rural environment are inconsistent. Cited as partial validation in a rural context, Osgood and Chambers (2003) suggest rural effect does not differ widely from the urban setting. However, Kaylen and Pridemore (2013) found that among Missouri youth, only one factor—single-mother head of households—is significantly related to crime. Despite representing over 16 million Florida residents, a limitation of the School Attendance Boundary Survey (SABS) data used in this analysis is the absence of data for 39 of the smallest Florida counties, amounting to over 2.4 million residents with a median county population of 34,846 (National Center for Education Statistics, 2013). It is important to note that a future examination of social disorganization effect in a rural setting is advised and the results contained herein do not adequately address associations within a rural context.
Social disorganization factors may disproportionally affect certain ethnic, racial, and social class groups, generally resulting from a persistent lack of access to necessary resources, with higher social classes, more likely white families, showing an historical aversion to majority minority schools, and moving their children elsewhere (Lareau, 2002, 2011; Lareau & Goyette, 2014; Olivos & Mendoza, 2009). Decades of local-level public school funding based largely on property taxes compounded this inequity, providing for structural or means-based ethnic and class segregation (Greenwald et al., 1996; Lareau & Weininger, 2003; Moser & Rubenstein, 2002; Owens & Maiden, 1999). Addressing this concern, the State of Florida implemented a formula to calculate a more equivalent funding system on a per pupil basis by integrating state-level tax revenue with local taxes. The system has been in place since 1973 with only minor changes (Florida Department of Education, 2015a). While Florida should be applauded for undertaking a comparatively early attempt to provide more equitable school funding (not long after institutional segregation), at least one study found potential inequity at the elementary school-level relating to schools with higher concentrations of low socioeconomic status students (Owens & Maiden, 1999); however, greater equity is found in states like Florida integrating state-level per pupil funding within expansive school districts (Moser & Rubenstein, 2002).
Based on the relative per pupil funding equity in Florida and the potential for the socioeconomic discrepancy to be captured within the social disorganization model itself, a school funding variable was not used in this analysis. That being said, this researcher suggests inequity in school funding, historically and current, presents an essential variable for consideration in future research, especially in states with a less equitable funding structure than Florida, as past meta-analyses have shown that even a moderate increase in spending is associated with significant increases in achievement (Greenwald et al., 1996).
Performance Measurement
The No Child Left Behind (NCLB) Act of 2001 provided a new paradigm of centralized public education performance accountability in the United States. In response to the federal mandate, states were forced to implement accountability mechanisms with the power to dictate educational parameters, restructure organizations, or ultimately take over or close failing schools and/or school districts (NCLB, 2002). Unfortunately, an NCLB-related “failing” designation created unintended consequences for the community. Originally envisioned to help schools in struggling communities through a market-based accountability perspective, a failing or negative designation has been empirically linked to lowering property values (Bogin & Nguyen-Hoang, 2014). Similarly, school choice initiatives or scholarships allowing higher performing students to transfer from low performing schools, exacerbates the difficulty for districts to meet improvement requirements in the long-term (Chakrabarti & Schwartz, 2013; Lavery & Carlson, 2015; Sirer et al., 2015). Compounding the dilemma, Chakrabarti and Schwartz (2013) found that the Florida Opportunity Scholarship, which allows higher performing students to transfer from low scoring schools, may be indirectly associated with tactics on the part of educators and administrators to game the system whereby struggling students are reclassified in order to improve overall school scores. Similarly, Heilig and Darling-Hammond (2008) found NCLB inspired measures in Texas created an environment where schools game the system by excluding certain students from testing—or school itself—disproportionally reducing educational opportunity for Black and Latinx students. Perhaps with the intention of protecting the students or their jobs, teachers and administrators employ gaming strategies out of desperation, such as those previously mentioned, specifically to prevent NCLB inspired punishments (Amrein-Beardsley, 2009).
Despite some research showing minor NCLB-related improvements for minority and disadvantaged middle school students (Lauen & Gaddis, 2012), Wei (2012) concludes there is an inconsistent pattern of relationships between strict state-enforced NCLB inspired accountability systems and student achievement, with NCLB-related policy creating inequitable outcomes across diverse academic subjects and minority groups. Correspondingly, Weinbaum et al. (2012) argue that whether high or low achieving, a school or district’s methods to improve academic performance may not vary considerably. They suggest school performance is not directly related to strategy selection and “teaching to the test is a rational response to current policy” (Weinbaum et al., 2012, p. 10).
Despite its intentions, the NCLB replacement Every Student Succeeds Act (ESSA, 2015), which was created to address struggling communities more distinctly and return power to the states, is also centered around a standardized testing accountability matrix and may not offer the comprehensive resources necessary to offset at-risk challenges (Mathis & Trujillo, 2016). This is not to say that performance measurement in public education does not improve outcomes. Examining New York City public schools, Sun and Van Ryzin (2014) found that schools practicing more precise and comprehensive performance management practices have better standardized test outcomes while controlling for student, staffing, and other school-level characteristics.
Florida High School Performance Metrics for the 2010 to 2011 School Year
In 2010 to 2011, all traditional public schools in Florida were held to the same NCLB-based criteria for eligible students (Florida Department of Education, 2011a, 2011b; NCLB, 2002). In addition, eight subgroups’ results were measured, those being White, Black, Hispanic, Asian, American Indian, economically disadvantaged, English language learners (ELLs), and students with disabilities (SWDs). FCAT-based performance measures were based on meeting thresholds in standardized state test score averages (the FCAT tests) in reading, mathematics, science, and writing (see Table 1) as well as improvements in reading and math score averages among the lowest performing quartile of students (Florida Department of Education, 2011a, 2011b).
Florida High School Grading Criteria, 2010 to 2011 School Year.

Note. 10 Bonus Points if at least 50% of students retaking the 10th grade FCAT in reading and math attain scores required for graduation. Subtractions or additions of points based on growth or decline from previous year. Based on a 1,600-point scale, 1,050 points or more are necessary for an “A” grade.
The second component of the Florida public high school performance metric for 2010 to 2011 measured Non-FCAT related factors (see Table 1) such as graduation rates for all students as well as a subgroup of at-risk students (denoted by an individual level 2 or below FCAT score), participation and completion of accelerated coursework (whether advanced placement courses, International Baccalaureate programs, or others) and postsecondary readiness in math and reading per aggregate national and state standardized test scores. Finally, Adequate Yearly Progress (AYP) was measured as a percentage of criterion satisfied up to 100%. Table 2 lists the criteria considered in calculating the AYP percentage score in Florida for the 2010 to 2011 school year (Florida Department of Education, 2011b).
Adequate Yearly Progress (AYP) Criteria, 2010 to 2011 School Year.

Source. Florida Department of Education (2011b) and NCLB (2002).
Community Engagement
Meta-analyses suggest a positive relationship between community engagement endeavors and student success, especially in the urban setting (Castro et al., 2015; Henderson & Mapp, 2002; Jeynes, 2007, 2012, 2017). Analyzing 31 studies testing the relationship between family engagement and student academic achievement, Henderson and Mapp’s (2002) systematic analysis found four significant outcome groups. First, interventions that allowed families to support their children’s learning at home are linked to higher student achievement. Second, the continuity of family involvement in the home has a positive influence on children doing well in school and continuing their education. Third, families from a variety of educational, cultural, and economic backgrounds have a similar positive influence on their child’s education. Finally, family and community engagement that is directly associated with specific knowledge and skills has a stronger association with academic achievement than undefined general involvement activities (Henderson & Mapp, 2002).
Jeynes (2007) first parental involvement meta-analysis examined 51 studies and found positive relationships between family engagement and student achievement, regardless of socioeconomic status or race, in urban secondary school children. Jeynes (2012) later found similar results including a significant positive association between four types of intervention techniques: shared reading, partnership emphasis, checking homework, and communication between parents and teachers (Jeynes, 2012, p. 728). In a more recent meta-analysis, Jeynes (2017) again found comparable outcomes, this time among Latinx students, with family engagement significantly associated with higher academic outcomes.
Education researchers Epstein et al. (2019), suggest three important factors in adolescent education. First, parent involvement usually declines as students get older, suggesting that schools develop involvement programs that evolve and increase over the course of the student’s education. Second, higher socioeconomic status families tend to be more involved in positive school activities and this discrepancy should be considered in implementing a universally effective program. Lastly, single-parent households or families with intense working schedules need to have programs that fit their needs amicably (Epstein et al., 2019).
Based on their research, Epstein et al. (2019) propose a School-Family-Community partnership framework that suggests six factors of involvement are necessary in creating a comprehensive and effectual program: parenting, communicating, volunteering, learning at home, decision making, and collaborating with the community. While some aspects of the framework are supported independently by evidence, few studies are found that test the entirety of the model. Bower and Griffin (2011) suggest the implementation of an Epstein School-Family-Community partnership model in high-minority, low-income schools is effective, but one must also account for variance based on socioeconomic status and cultural differences.
Lareau (2002, 2011) suggests social class pointedly influences family involvement in public education, manifesting in divergent approaches to relationships with the school, and that racial or ethnic characteristics are not strong indicators of disparity alone. Testing Lareau’s qualitative studies on social class and engagement, Cheadle and Amato (2011) also found that SES was highly correlated with what Lareau termed “concerted cultivation,” or the culmination of school engagement activities, participation in extracurricular activities, and the presence of education materials in the home; however, some racial and ethnic differences still exist even when controlling for SES factors.
While Black and Latinx students are found to achieve significant gains from family engagement polices (Marschall & Shah, 2020), the policy measures are often formed through a predominantly white middle-class perspective, and therefore may not be as effectual with other groups (de Carvalho, 2000; Olivos & Mendoza, 2009). It is important to note that scholars suggest much of the benefits proclaimed from community engagement to academic achievement occur within a lack of focus on Black, immigrant, or Latinx families who are often viewed from a deficit-perspective (de Carvalho, 2000; Olivos & Mendoza, 2009). Despite this perception, LeFevre and Shaw (2012) found that Latinx secondary students benefit from both formal and informal community engagement, rejecting the deficit-based perception bias.
Florida Five Star School Award
The Florida Department of Education Five Star School award was created by the Commissioner’s Community Involvement Council and designed to recognize exemplary community engagement practices by individual schools (Florida Department of Education, 2015b). To receive the Five Star School award designation, each school must provide documentation showing it successfully achieved all criteria in five categories: business partnerships; family involvement; volunteerism; student community service; and operating satisfactory school advisory councils. While not a direct duplication, the Five Star Award criteria overlaps with the Epstein et al. (2019) School-Family-Community partnership factors of parenting, communicating, volunteering, decision-making, and collaborating with the community. That being the case, an opportunity for a community engagement analysis exists and is examined—but limitations with the Five Star School award metric must be noted.
To receive the Five Star School award, a public school must fully meet all criteria with the decision to grant satisfaction at the sole discretion of a Florida Department of Education administrator. At the time of this research, no public data existed measuring partial completion of any or all criteria. For this reason, creating a more robust variable or measurement model examining community engagement, and the nuance therein, is not possible. However, the creation of a dichotomous variable measuring satisfaction of the Five Star School Award criteria is possible and therefore useful in this study—however far from ideal—as a measure of a state-level reward for implementing recommended community engagement activities. As important, the lack of prescriptive measures pertaining to addressing contextual differences regarding race, social class, and diverse cultural engagement strategies as well as a possible white middle-class bias is noted. Finally, the decision of a school district or individual public high school to pursue the Five Star School award may rest on many factors, with the perception of the capacity to achieve the award, preference for alternative community engagement techniques, or prioritizing resources elsewhere all influencing participation and completion. That being the case, differences between schools receiving the award and those that do not are noted.
Conceptual Development
The exclusive utility of the SABS in measuring respective neighborhood data for each public high school catchment area, rather than at an aggregated city or county-level, provides for a more explicit community-level analysis. However, only a 2010–2011 school year timeframe is possible as comprehensive data for later years is limited and the SABS was discontinued in 2016, thereby denying robust longitudinal analysis opportunities (National Center for Education Statistics, 2013). That being said, a cross-sectional analysis using the unique dataset is worth pursuing. In addition, the ability to measure whether a state-level community engagement recognition initiative is effectual is prudent, especially within a timeframe prior to more robust school choice initiatives in the state.
A community-level social disorganization latent variable is created with six statistically significant observable indicators measuring residential mobility, single-parent households, divorced or separated families, median family income, education attainment, and urbanization. The socioeconomic indicators median family income and education attainment are inverted to maintain proper theoretical directionality. It is important to note the seventh social disorganization indicator per the Sampson and Groves (1989) model could not be included: Ethnic heterogeneity, or the probability that two persons chosen randomly from a population will not be from the same ethnic group. The inclusion of ethnic heterogeneity as a component of social disorganization is validated by other researchers (Law & Quick, 2013; Lowenkamp et al., 2003; Patterson, 1991; Sampson & Groves, 1989; Steenbeek & Hipp, 2011). That being said, within the context of this analysis the ethnic heterogeneity variable is not statistically significant in the social disorganization measurement model using the SABS data, and therefore not included in the SEM analysis. This could be for a variety of reasons that are addressed later.
A high school performance latent variable is measured by indicators representing the three primary performance metrics issued by the state of Florida for the 2010-2011 school year: FCAT score, non-FCAT score, and the Adequate Yearly Progress ratio. Finally, a dichotomous variable measuring whether a school received the Five Star School award is added to the conceptual structural equation model (see Figure 1).
H1: Social disorganization is negatively associated with Florida public high school performance at the community-level with any effect from the successful satisfaction of the Florida Five Star School award criteria simultaneously considered.
H2: Satisfaction of the Florida Five Star School award criteria is positively associated with Florida public high school performance at the community-level with social disorganization simultaneously considered.
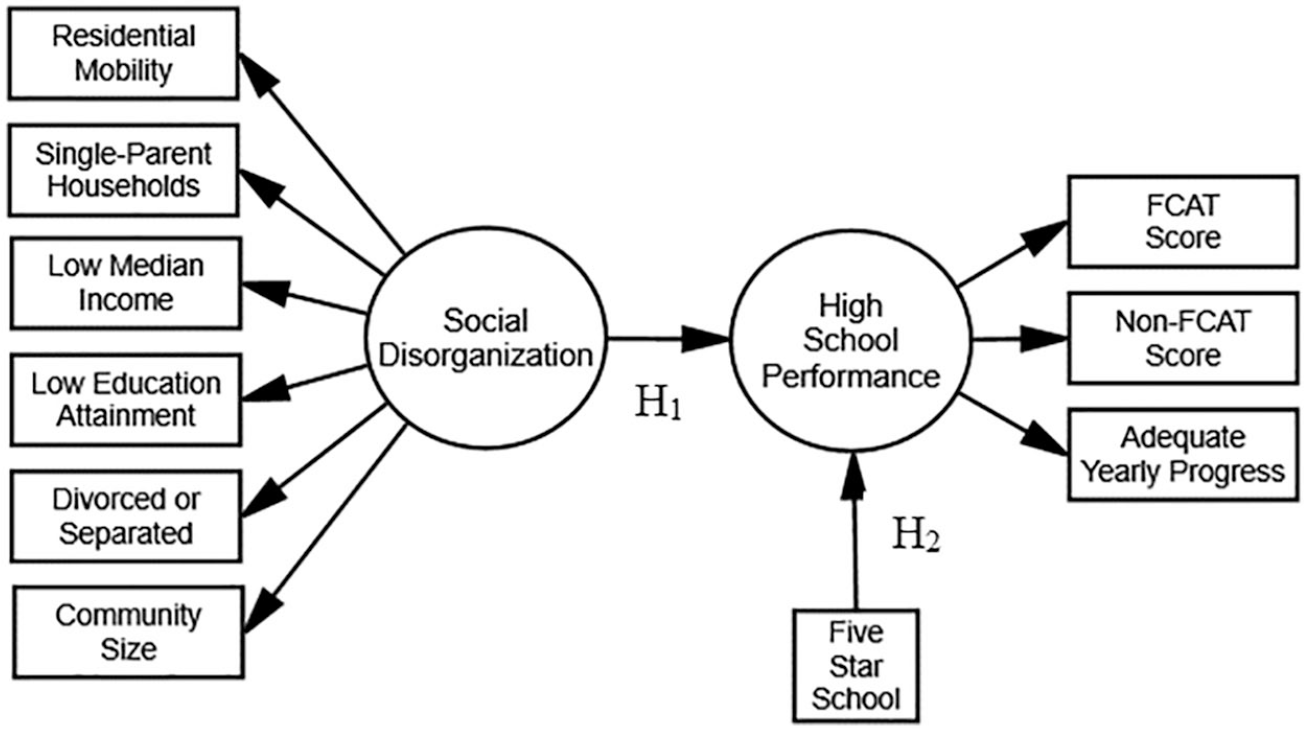
Conceptual model.
Design, Data, and Measurement Models
This study hopes to provide an analysis that is generalizable beyond public high school communities in Florida. Table 3 lists demographic data compiled by the National Center for Education Statistics (2013) aggregated from the 2006 to 2010 U.S. Census Bureau American Community Survey (ACS) into the 2006 to 2010 School Attendance Boundary Survey (SABS) as well as other U.S. Census Bureau (2011, 2016) data . Three groups are compared: the 2006 to 2010 SABS data used in this research, the State of Florida for 2010, and the United States for 2010.
SABS Sample Data Generalizability.

Source. National Center for Education Statistics (2013) and U.S. Census Bureau (2011, 2016).
As noted, the State of Florida and SABS data are quite similar despite the limited number of counties (28) in the sample. The 39 counties not included in the SABS data are primarily the least populated of the 67 counties, containing only a fraction of the entire population, thereby changing the overall demographics slightly. The only exception being Lee county whereupon open enrollment measures were already present which disqualified its high schools from consideration. While a true rural versus urban social disorganization effect is negated by the exclusion, many demographic factors of the SABS are comparable with the 2010 United States data. Overall, the similarity between the demographic data is ample; however, generalizability concerns must be noted, especially the lack of a rural application.
For the 2010 to 2011 school year, there were 507 public high schools in the State of Florida distributed into 67 county-based public school districts. The majority of Florida public schools qualified as Title I schools (71.2%) with over half of the students receiving free or reduced lunches (53.5%). In addition, almost one in 10 students (8.8%) were enrolled in limited-English proficiency programs. Less than half of the students were non-Hispanic White (45.9%) with Black (23.9%) and Hispanic (27.2%) students representing the largest minority groups. The 2011 graduation rate was 71%. Florida students scored slightly below the national average in eighth grade NEAP assessment scores in both math and reading and 58.8% attended some sort of higher education training after high school (Meador, 2014).
SABS community-level data allowed for the study of 302 public high schools with traditional school attendance boundary catchment areas from 28 school districts in Florida (where school district and county boundaries are synonymous). The sample high schools each serve as a unit of analysis enmeshed within their respective school attendance boundary catchment area community (see Table 4). Open enrollment, magnet, and charter high schools were not considered in the analysis. The variable representing state-level satisfaction of community engagement activities, Florida Five Star school award, is dichotomous. An adequate number of units of analysis is recommended in order for SEM to ensure a meaningful investigation. In this case, the 302 traditional public high schools surpass a threshold of 200 units most often found acceptable (Wolf et al., 2013).
Definition of Observed Variables.
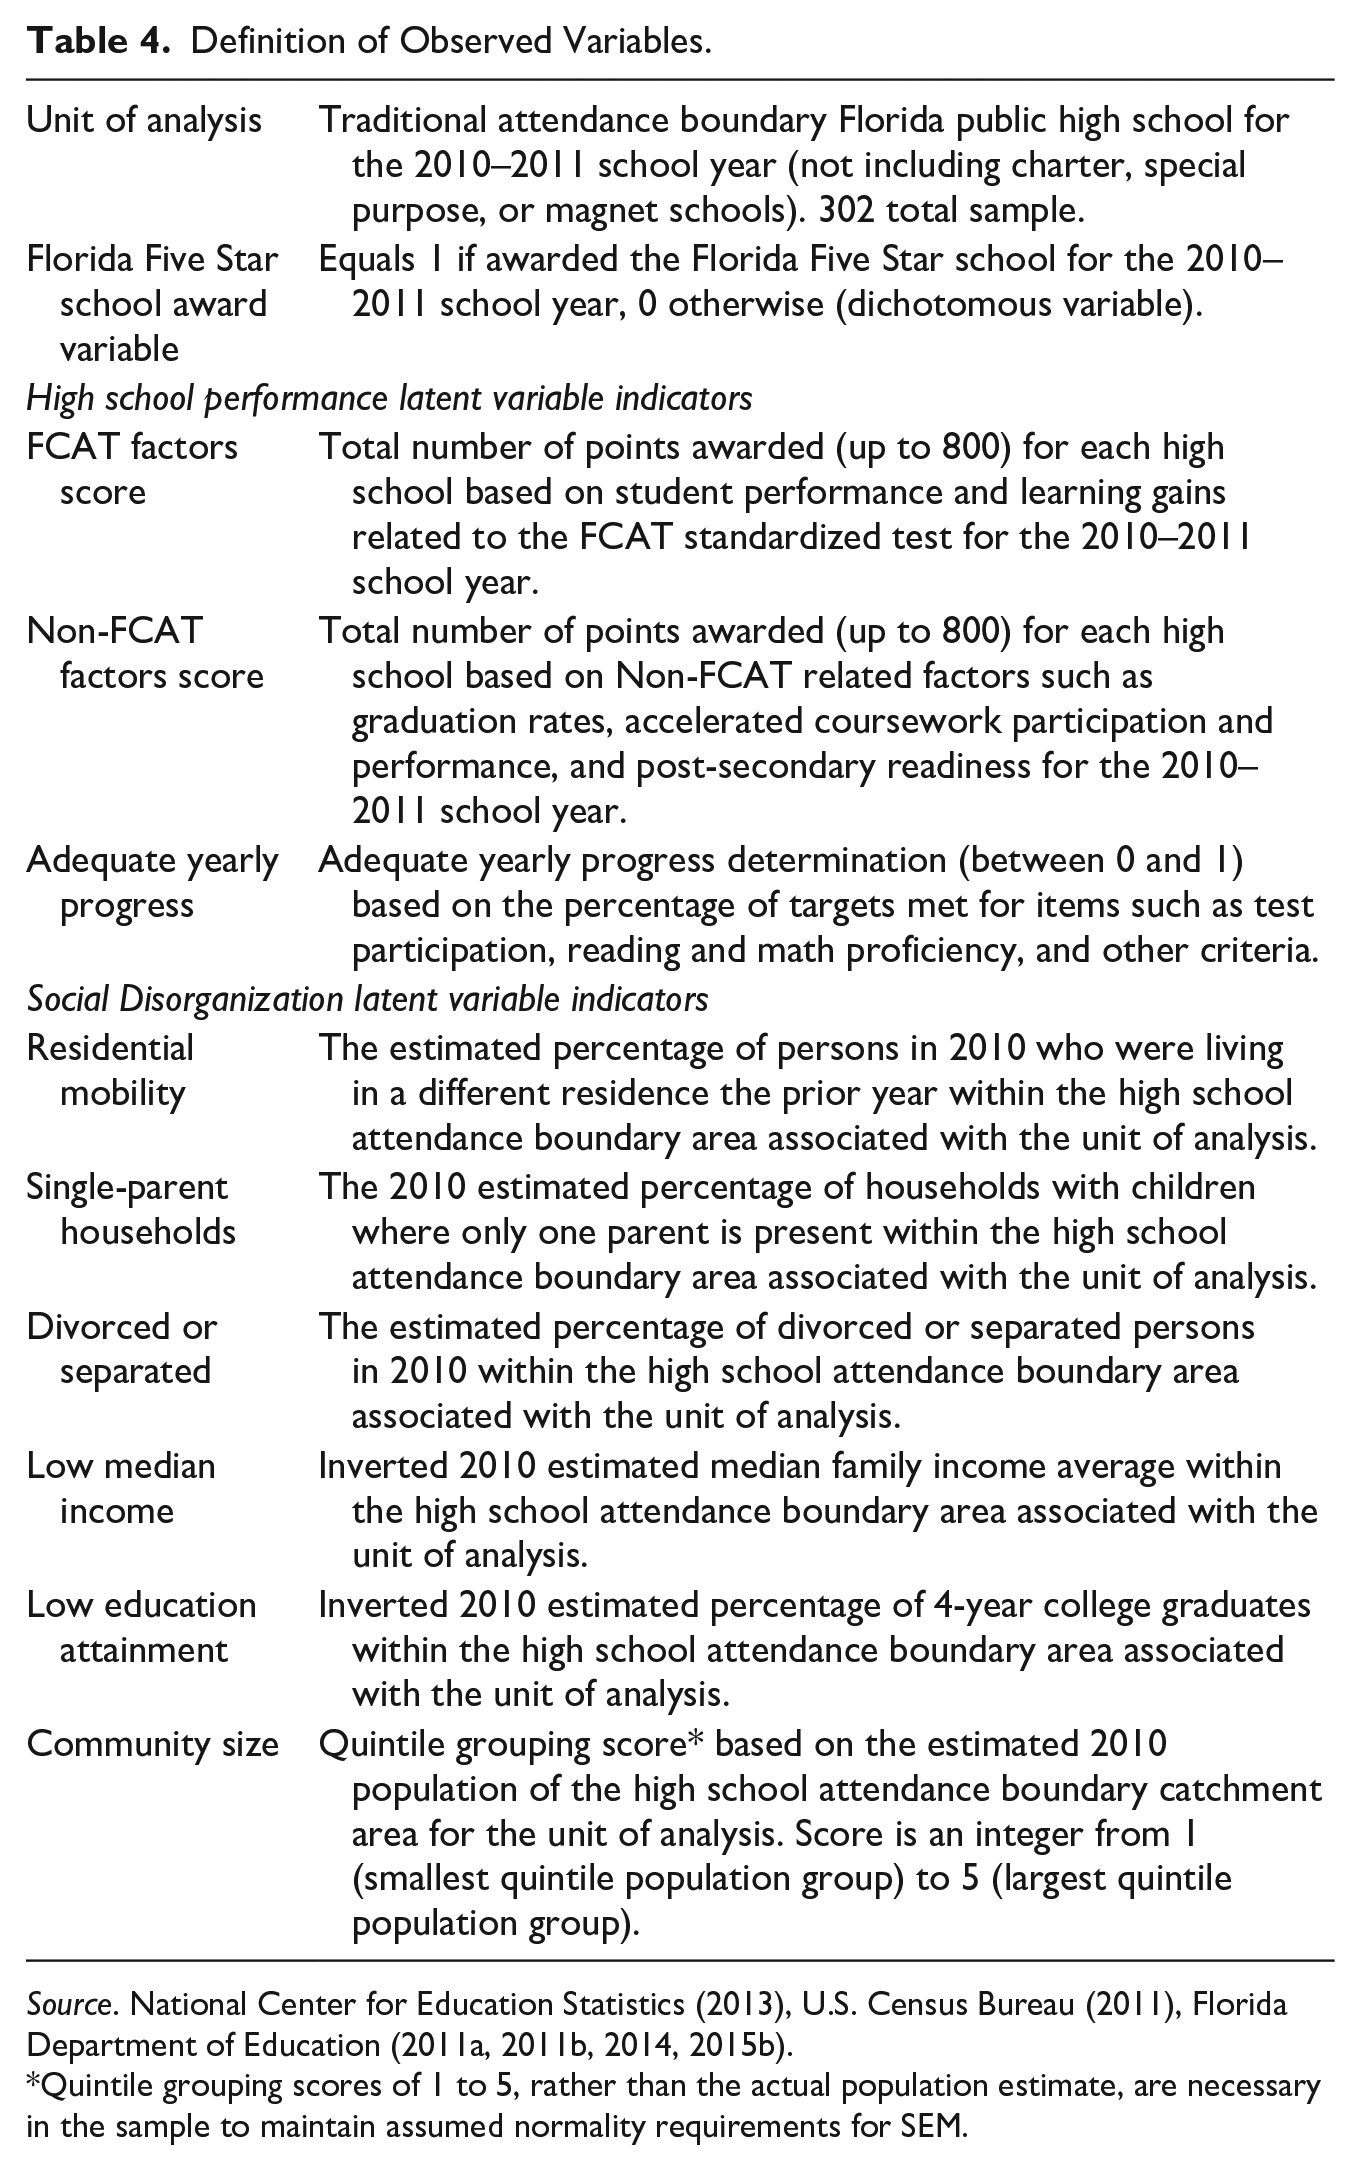
Source. National Center for Education Statistics (2013), U.S. Census Bureau (2011), Florida Department of Education (2011a, 2011b, 2014, 2015b).
Quintile grouping scores of 1 to 5, rather than the actual population estimate, are necessary in the sample to maintain assumed normality requirements for SEM.
Conceptualizing the dependent latent variable, High School Performance, indicator variables representing the FCAT, Non-FCAT, and AYP high school scores for the 2010 to 2011 school year are tabulated using Florida Department of Education (2011a, 2011b, 2014) data . Conceptualizing the independent variable, Social Disorganization, (see Table 4) indicators are created using SABS data representing community-level residential mobility, single-parent households, divorced or separated persons, median family income, education attainment, and community size (National Center for Education Statistics, 2013). Both socioeconomic indicators are inverted to maintain proper directionality within the theoretically-based measurement model. The ACS data, despite the 5-year estimate calculation, is limited in that the margin of error parameters greatly increase for very small populations, hence the reason for the limited number of rural school districts considered (National Center for Education Statistics, 2013; U.S. Census Bureau, 2011).
As structural equation modeling (SEM) assumes normality, some data is transformed either through common logarithm (Lg10) or square root (Finney & DiStefano, 2013; Kline, 2010; Wan, 2002). In the case of community size, the variability in the raw data required a grouping score, in this case progressing quintiles 1 through 5, rather than the actual population estimate, to produce adequate normality (Table 5).
Descriptive Statistics.
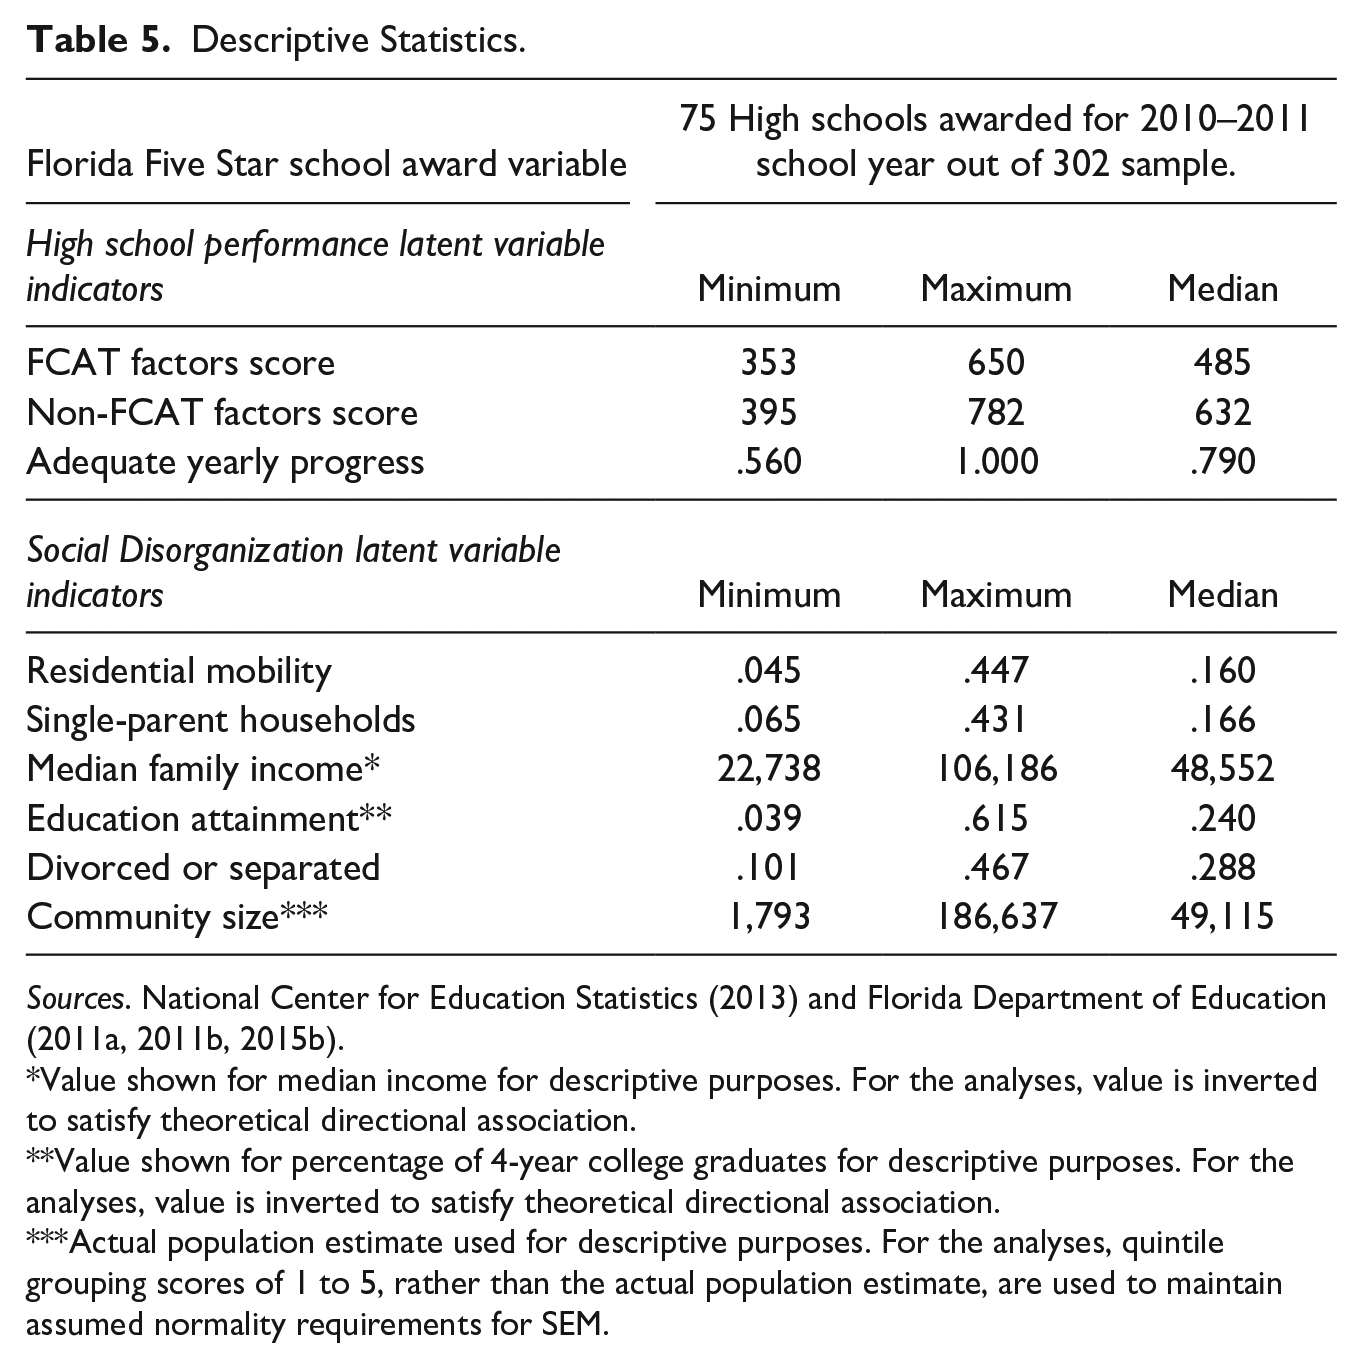
Sources. National Center for Education Statistics (2013) and Florida Department of Education (2011a, 2011b, 2015b).
Value shown for median income for descriptive purposes. For the analyses, value is inverted to satisfy theoretical directional association.
Value shown for percentage of 4-year college graduates for descriptive purposes. For the analyses, value is inverted to satisfy theoretical directional association.
Actual population estimate used for descriptive purposes. For the analyses, quintile grouping scores of 1 to 5, rather than the actual population estimate, are used to maintain assumed normality requirements for SEM.
About one quarter, 75 of the 302 sample, achieved the Five Star School award for the 2010 to 2011 school year from a diverse SES range of communities. It is important to examine differences in the subgroup of high schools that were awarded the Florida Five Star School award and those that either chose not to participate or did not satisfy all requirements. Despite any variance of social disorganization being captured within the SEM model, the decision whether to participate or not, as well as the capacity to accomplish satisfaction must be noted. For example, a high performing district, such as Palm Beach County, may forgo the application to be a Five Star School by believing their own community engagement policy initiatives and/or culture are superior to the state recognition efforts. Finally, a district or high school may feel they do not have the capacity to address the state-level policy, and/or the policy does not address their specific community needs, and refuse to participate.
While the variance between the Five Star School award recipients and non-awardee population are generally minor (see Table 6), some are worth noting. Median family income is somewhat higher for the awardee sample but the most significant difference is educational achievement. The Five Star School awardee sample has a median of 30.3% of adults in the community holding a 4-year college degree versus 23% among the non-awardee communities. Both of these differences might indicate a preference for undertaking a comprehensive community engagement endeavor (and perhaps the success therein), however, given the limitations of the data available for this study, this researcher cannot make that conclusion.
Five Star School Awardee Versus Non-Awardee High School Communities.

Sources. National Center for Education Statistics (2013) and Florida Department of Education (2011a, 2011b, 2015b).
Value shown for median family income for descriptive purposes. For the analyses, value is inverted to satisfy theoretical directional association.
Value shown for percentage of 4-year college graduates for descriptive purposes. For the analyses, value is inverted to satisfy theoretical directional association.
Actual population estimate used for descriptive purposes. For the analyses, quintile grouping scores of 1 to 5, rather than the actual population estimate, are used to maintain assumed normality requirements for SEM.
Model Revision and Results
Prior to constructing an SEM covariance structure model as the comprehensive framework for the analysis, latent variable measurement models of social disorganization and high school performance are examined for internal consistency using Cronbach’s Alpha as a measure of reliability. Generally considered optimal between .700 and .950, the social disorganization latent variable score of .689 is adequate for the analysis with the high school performance latent variable score of .818 being optimal (Tavakol & Dennick, 2011). To optimize each measurement model, any insignificant variable is removed. In this case, the ethnic heterogeneity indicator variable is removed from the social disorganization model prior to the reliability analysis as it is not statistically significant. Once the covariance structure model is created (see Figure 2), significant correlations between measurement errors of indicator factor weights are correlated to best achieve optimal goodness of fit.
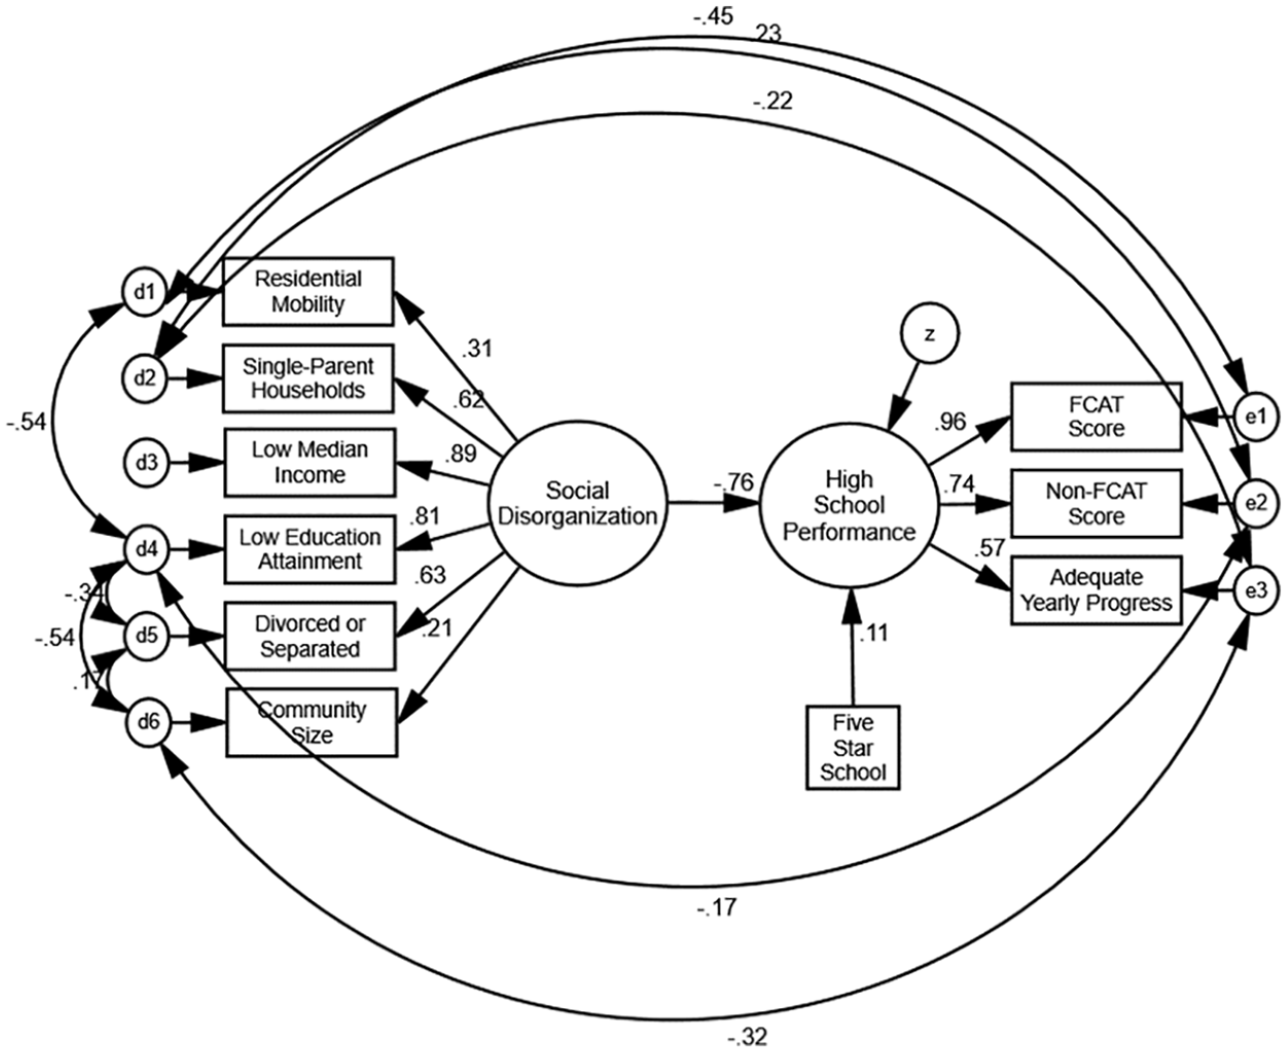
Revised covariance structure model with standardized estimates.
For this analysis, adequate goodness of fit was achieved (see Table 7). The likelihood ratio is less than 4 (2.570), the root mean square error of approximation is below .080 (.072), the goodness of fit index is over .900 (.960), the relative goodness of fit statistics are all greater than .900 (IFI, NFI, and CFI), and the parsimonious goodness of fit index (AGFI) is over .900 (.913). The preponderance of acceptable goodness of fit index values suggest the data sufficiently fits the model (Kline, 2010; Wan, 2002).
Goodness of Fit Statistics, Reliability and Standardized Path Coefficients.
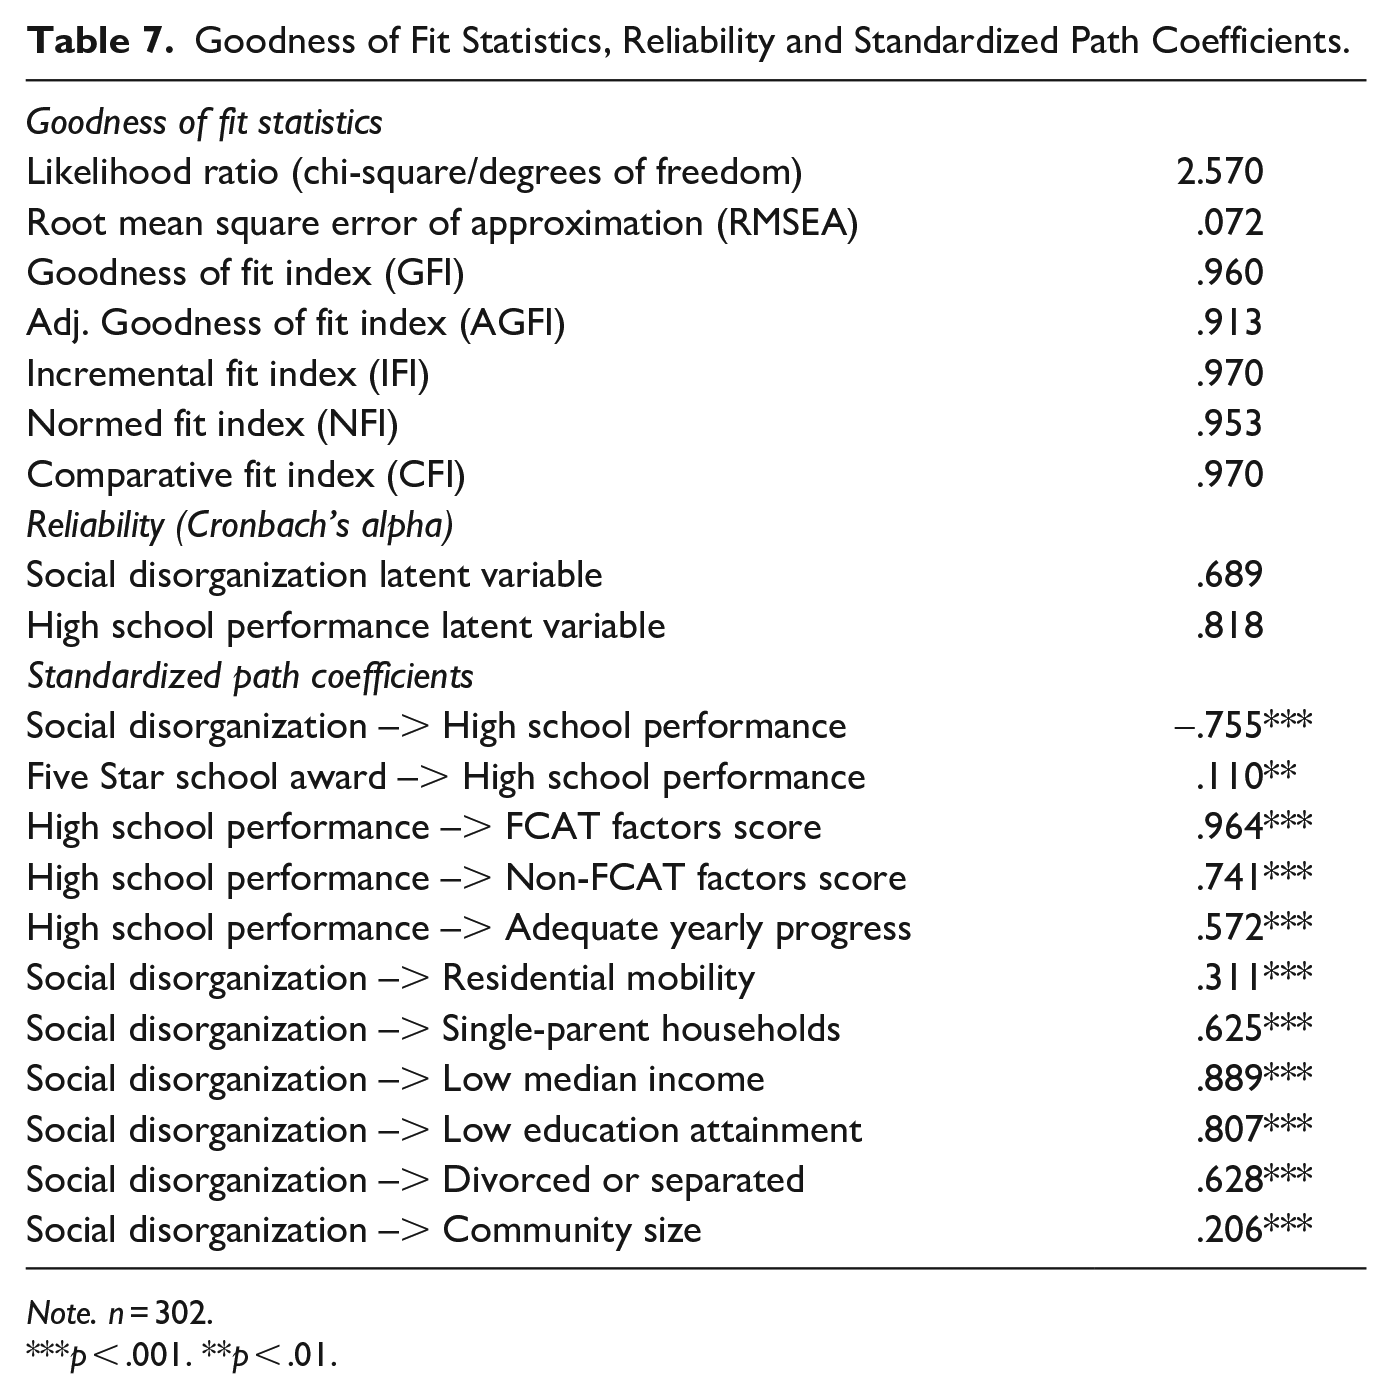
Note. n = 302.
p < .001. **p < .01.
Findings
Supporting the first hypothesis, the results indicate a strong negative association between community-level social disorganization and traditional public high school academic performance (see Figure 2 and Table 7), with any effect from activities associated with the satisfaction of the Florida Five Star School award criteria simultaneously considered. This is represented by a −.755 standardized regression coefficient that is statistically significant at the .000 level. A significant negative association between the social disorganization latent measurement model and school-level academic performance, as measured in the high school performance latent measurement model, supports the literature (Baker et al., 2000; Bowen et al., 2002; Johnson, 2012; Madyun, 2011).
Supporting the second hypothesis, receiving the Florida Five Star School award (recognizing the successful completion of community engagement criteria) had a small but significant association with the latent variable measurement model representing Florida public high school academic performance with social disorganization simultaneously considered. Based on the covariance structure model results, there is a statistically significant positive association (.110 standardized regression weight) between the Five Star School Award variable and traditional Florida high school academic performance at the community-level. This study suggests that state-level community engagement recognition or promotion—specifically satisfying the Florida Five Star School award criteria—may be beneficial in improving school-level academic performance. The findings support literature suggesting a positive relationship between community engagement and academic achievement (Castro et al., 2015; Epstein et al., 2019; Henderson & Mapp, 2002; Jeynes, 2007, 2012, 2017; LeFevre & Shaw, 2012; Spera, 2005).
Some limitations must be addressed regarding the community size indicator variable. First, sample limits exist with regard to the exclusion of low population counties in the SABS data as adequate significance thresholds could not be met based on the ACS samples. While the vast majority of the state population is represented (see Table 1), detection of any rural effect is greatly diluted. This coupled with the lack of density calculations available at the school attendance boundary catchment area-level may also diminish measurement of urbanization. Finally, the potential of a parabolic or threshold effect relating to a preferential range of population should be addressed in future research.
Conclusion and Limitations
As the academic achievement gap grows between low-income communities and more affluent areas, the community-level perspective incorporated in this analysis is opportune (Coley & Baker, 2013). In tandem, the results suggest the potential utility of a community-based strategy within a public school performance measurement framework (Green, 2018). The importance of community well-being as exemplified in this research reinforces the urgency for addressing the unintended consequences of state and national education policy that exacerbates social disorganization factors within the community through open enrollment and school choice initiatives (Amrein-Beardsley, 2009; Bogin & Nguyen-Hoang, 2014; Chakrabarti & Schwartz, 2013; Wei, 2012; Weinbaum et al., 2012). Simply, if community comprises prominent factors in the challenges to or improvement of high school academic performance, the neglect of a community-based approach within a school choice policy environment may be highly counterproductive and at worst the ultimate engine of a struggling school’s failure. Per the results herein, if current school choice options are associated with increases in social disorganization within communities, the negative impact (increasing academic achievement disparity) must be recognized and addressed. Compounding the above negative relationship, whether intended or not, is the potential to accelerate a disparate impact on low income and minority communities, further exacerbating societal inequity.
Limitations exist with regard to measuring partial or nuanced satisfaction of the community engagement criteria, thereby constraining comprehensive conclusions on the policy initiative. Further limitations exist with regard to measuring partial involvement, implementation or completion of the Five Star School award criteria, or other community engagement criteria existing in the school district separate from the state award. Future research should address these concerns as well as investigate whether these findings correlate within a rural application. The absence of an ethnic heterogeneity variable in the social disorganization measurement model does not mean the factor is not a relevant social disorganization indicator more generally. Issues with the data itself, perhaps a rural versus urban discrepancy, or other factors exclusive to goodness-of-fit parameters within an SEM model prohibited its inclusion. Future research should investigate whether ethnic heterogeneity, perhaps in a more specific dependent variable analysis, is associated with any of a diverse field of school-level academic performance metrics.
In conclusion, a state-wide policy effort to encourage community engagement practices similar (but not identical) to the Epstein et al. (2019) School-Family-Community framework is now empirically associated with positive school-level academic outcomes while controlling for contextual factors. Future research is now able to expand from a strictly theoretical focus exemplified through the SEM framework to a more nuanced series of regression analyses. This complementary approach to the subject matter is suggested to isolate and identify a more varied array of associations between community engagement policy satisfaction, individual community disparity factors, and a diversity of public high school performance metrics.
Footnotes
Declaration of Conflicting Interests
The author declared no potential conflicts of interest with respect to the research, authorship, and/or publication of this article.
Funding
The author received no financial support for the research, authorship, and/or publication of this article.
