



Abstract
Nontraditional public schools (e.g., charter schools) are a growing portion of the educational landscape, and charter schools, in particular, are synonymous with the school choice movement. Research on charter schools is increasing and is providing insight into charter school educational processes (Arsen & Ni, 2012; Garn, 2001; Lubienski, 2003), social and segregating effects (Frankenburg & Lee, 2003; Orfield & Edley, 2011), and the processes of charter school openings (Renzulli, 2005). While the current trends of research are important, there is a paucity of peer-reviewed research on charter school closures, closure being one of the most unique capabilities of a charter school.
The rhetoric surrounding the charter school movement implies that charter schools are accountable, possibly more so than their traditional counterparts, because they can close their doors if they are not functioning in the ways they promised the community. Accountability comes in multiple forms, and we define accountability in four distinct ways for this article. First, charter schools must prove accountability through academic scores. Second, as nontraditional public schools, they must also demonstrate accountability to the market by providing a distinct service to the communities they serve. Third, they must be accountable to bureaucratic rules and regulations, such as state laws regarding racial balance. Finally, charter schools must demonstrate financial compliance with proper usage of public tax dollars.
We use a combination of quantitative and qualitative research to investigate the process of charter school closure in North Carolina from 1997 to 2005. We specifically ask the question: How do accountability mechanisms contribute to charter school failure? We conclude that using two different methods to study charter schools provides a much better understanding of the micro and macro processes of school closure than one method alone. Understanding how accountability is expressed through charter school closures is important because a better understanding of this process will allow school leaders to take steps to better enable their schools to survive.
The Context: Charter Schools in North Carolina
Charter schools are nontraditional public schools that educate over a million children each year and provide an educational choice for parents. Charter schools are not managed by state and local government boards, but instead by individuals, teachers, parents, community members, or organizations. To recruit parents, students, teachers, and administrators, charter schools must create an atmosphere that conveys a legitimate educational environment. If the schools are unsuccessful at creating such an environment, charter schools can fail. In the paragraphs below, we describe how charter schools in North Carolina are regulated, what they must do to maintain legitimacy, and in what ways they are accountable to their constituents.
North Carolina, the site of this study, passed its charter law in 1996 allowing charter schools applications to be approved by the local district, a state university, or the State Board of Education. Up until the summer of 2011, North Carolina had a cap on the number of charter schools permitted in the entire state—no more than 100 charter schools could exist at the same time. We should note that the 100 school cap was lifted in the summer of 2011, and the state now allows an unlimited number of charter schools. District growth, however, is still restricted to no more than five charter school additions per year. The combination of these state rules and regulations has historically allowed the state of North Carolina to exercise more control over charter school openings than other states in the United States.
Most charter schools in North Carolina were opened as new schools and not converted from private or traditional public schools, although conversions are permitted. The charter schools have a wide variety of thematic missions and goals, which assist them in serving diverse sectors of the population. Currently, North Carolina charter schools serve 3% of K-12 students in the state of North Carolina, which is similar to the national average. Previous findings indicate that charter schools in North Carolina tend to serve a larger percentage of African American students than traditional public schools (Bifulco & Ladd, 2007). But, charter schools in North Carolina also appear to cater to more families who have parents with college degrees and fewer families with parents who dropped out of high school (Bifulco & Ladd, 2007). Based on reports that charter schools were not racially diverse, policy makers feared that charter schools would begin to segregate the student population through “white flight,” and they established a racial compliance law in the state. This law states that, “within one year after a charter school begins operation, the population of the school shall reasonably reflect the racial and ethnic composition of the general population within the district or of the special population the school seeks to serve residing in the district” (see charter school legislation NSCSG 115C-238, 29F(g)(5) or the state board of education policy EEO-U-003 for more information on this policy).
In North Carolina, as in most states, charter schools are given the freedom to establish their own goals and curriculums and are exempt from most government regulations, but are formally accountable to their charter school mission and federal standards of achievement. Additionally, North Carolina law requires charter school to submit annual reviews to maintain their charters. In terms of accountability requirements, the law states,
Accountability–
The school is subject to the financial audits, the audit procedures, and the audit requirements adopted by the State Board of Education for charter schools. These audit requirements may include the requirements of the School Budget and Fiscal Control Act.
The school shall comply with the reporting requirements established by the State Board of Education in the Uniform Education Reporting System.
The school shall report at least annually to the chartering entity and the State Board of Education the information required by the chartering entity or the State Board. (North Carolina, 1995)
In addition, this legislation puts forth six grounds for the termination or nonrenewal of a charter; these include
Failure to meet the requirements for student performance contained in the charter.
Failure to meet generally accepted standards of fiscal management.
Violations of law.
Material violation of any of the conditions, standards, or procedures set forth in the charter.
Two thirds of the faculty and instructional support personnel at the school request that the charter be terminated or not renewed.
Other good cause identified. (North Carolina, 1995)
Taken together, these two parts of the same charter law statute suggest contradictory or at least vague approaches to accountability. First, in the six reasons for termination, failure to meet academic standards is of primary importance, but the accountability section of the law only directly discusses financial accounting. Second, the sixth reason that a charter school can be closed is purposefully elusive. This vagueness allows the Board of Education a great deal of flexibility in the reasons they cite for closing a school, thus ostensibly giving the Board a lot of power in the closure process. In our study, we examine charter school closure in North Carolina since this legislation was passed, in order to better understand how accountability is being interpreted and enacted in this school system.
Failure of Charter Schools
Assessing the meaning of charter school closure rates is difficult because there is not an “optimal level” of charter school closures. A low or declining percentage of closures may signal that schools are not being held accountable, but it may also signal that charter schools are improving or that only high quality charters are being approved initially. However, the general consensus among charter school researchers is that charter school closures have been relatively rare (Hess, 2001; Rotherham, 2005; Vergari, 2000).
In their 2011 survey of charter school authorizers, the National Association of Charter School Authorizers examined the rates of charter school closures. The survey finds that for the 2010-2011 school year, 6.2% of charter schools in renewal were closed. This is a smaller percentage of closures than was seen in previous years, with 8.8% closed in the 2009-2010 school year, and 12.6% closed in the 2008-2009 school year. In contrast, rate of closure for charter schools not in renewal remained consistently small, ranging from 1.6% to 1.5% across these 3 years (National Association of Charter School Authorizers [NACSA], 2011). With only 3 years of data, it is difficult to judge if the percent of schools in renewal represent a declining trend in closures; however, the report makes it clear that schools facing the renewal of their charter are much more likely to be closed by their authorizers than those in the midst of their charter.
Another 2011 report put out by the procharter group, the Center for Education Reform (CER) finds that of the approximately 6,700 charter schools that ever opened, 1,036 or about 15% have closed since 1992 (CER, 2011). Notably, these data report only on schools that actually opened and then closed and do not include schools that were granted charters but never operated or charter schools that were later consolidated back into the traditional public school system. The CER (2001) report also analyzes the reasons charter schools closed and finds that 41.7% of schools close for financial reasons, 24% close for reasons related to mismanagement, 18.6% close for reasons related to academic performance, and 15.1% close for reasons related to district obstacles, facilities, or other or unknown reasons. This finding echoes that of Finn, Manno, and Vanourek (2000) in an earlier analysis, in which the authors find that the majority of charter schools closed for reasons relating to “organizational chaos, management meltdown, and fiscal shenanigans” (Finn et al., 2000). The CER (2011) report suggests that the high number of closures related to finances may be because financial issues often become clear far before issues with performance are apparent.
Much of the research literature on charter school closures and accountability focuses on the role of charter schools authorizers (CSAs) and the factors that both promote and constrain their efforts to hold charter schools accountable (Bulkley, 2001; Vergari, 2000). Charter school authorizers are the entities that approve charters, monitor the schools’ performance, and are ultimately responsible for closing charter schools that fail to live up to their stated goals and requirements (Vergari, 2000). A variety of factors affecting charter school authorizers may limit the accountability of charter schools as seen through the number of closures. For some authorizers, closures may be rare because of the limited contact and oversight that the chartering authority actually provides. A lack of funds or staff to adequately monitor schools under their charge may necessitate a hands-off approach among CSAs (Rotherham, 2005). This can be a particularly potent problem in states that allow statewide authorization in which a charter school may be hundreds of miles away from the location of the authorizing body (Rotherham, 2005). In contrast, intense involvement of the CSA with the charter school may also discourage school closure. CSAs who support the school choice movement may be closely involved with the schools they manage, perhaps even offering up solutions for problems they encounter. This investment may make them reluctant to close the schools (Vergari, 2000). Additionally, the closing of any school causes a disruption in the lives of families and students, and places a burden on the other local schools that must absorb the displaced students. Moreover, even poorly performing charter schools are often popular with parents who would not like to see them closed. CSAs, therefore, may be reluctant to close schools both because of the disruption it would entail and because they fear the ire of parents (Hess, 2001; Rotherham, 2005).
There is often no clear understanding between the schools and the authorizing authority regarding exactly what charter schools are responsible for and when they will be held accountable (Manno, Finn, & Vanourek, 2000; Vergari, 2000). Similarly, the renewal process varies widely from state to state, and in some states it is a source of confusion with unclear procedures and guidelines (Bulkley, 2001). CSAs are able to work with a wide degree of discretion, a factor that may limit the closure of schools (CER, 2011; NACSA, 2011). Research on charter school closures acknowledges a multitude of reasons that promote or constrain charter school failures; our research addresses how charter school closures are a demonstration of specific types of accountability.
School leadership is important to consider in connection to charter schools and accountability mechanisms, because while accountability measures are mandated from above by the authorizing agencies or the state, these mandates are then interpreted and enacted within the schools by the administrators and teachers (Gawlik, 2012). The organizational actors are the ones who carry out finance decisions and administer standardized tests. Their actions may have a significant effect on whether a school meets its accountability targets and ultimately whether the school remains open.
School leadership is widely recognized as crucial to school improvement and success (Leithwood & Sun, 2012). Leadership at the level of the school has been shown to influence student achievement and school organizational factors, including the learning climate of the school and the professional capacity of staff (Leithwood, Louis, Anderson, & Wahlstrom, 2004; Sebastian & Allensworth, 2012). Creating a deeper understanding of macro accountability pressures is important for educational scholars, and the first step for connecting macro structures to micro processes.
Accountability
School accountability has been a central part of the public discourse about education for several decades now (Balfanz, Legters, West, & Weber, 2007; Gersti-Pepin & Woodside-Jiron, 2005; Hursh, 2007; Jimerson, 2005; National Opinion Reseach Center, 1983). This does not mean, however, that accountability structures are without conflict. For example, the sanctions schools face for failure to achieve proscribed goals is a highly contested issue (Finnigan & Gross, 2007; Mintrop, 2004). In this article, we examine the ways that accountability is achieved within charter schools, but more important, we recognize a growing and important body of literature that suggests accountability comes in a variety of forms (Chubb & Moe, 1990; Cuban, 1988; Darling-Hammond, 1988; Garn, 2001; Kirst, 1990; Levin, 1974).
In fact, there is a distinct lack of agreement on the various definitions of accountability, and educational researchers argue that accountability can be measured in many different ways (Chubb & Moe, 1988; Darling-Hammond, 1989; Garn, 2001). Many of the identified forms of accountability differ faintly, but appear to largely overlap in definition and practice. In the case of charter school closures, we borrow from Garn (2001), who evaluated and synthesized the literature on accountability to create his own typologies of accountability. We consider and examine four key forms of accountability: performance, market, bureaucratic, and financial.
Performance Accountability
Possibly the most understood form of accountability is performance-based accountability. That is, schools must be accountable for their academic performance (Levin, 1974). Test scores generally provide the measuring stick by which educators can evaluate the success of a school. In this type of accountability, charter schools would be more likely to close if they do not produce academic scores demonstrating sufficient performance in the classroom (Garn, 2001). If performance-based accountability is at work in North Carolina, then we should see low academic scores having a strong influence on charter school closures. If charter schools are not meeting academic standards we would expect to see those underperforming schools to close.
Market Accountability
Schools may also be accountable for meeting community needs, thus making them reflect market forces (Preston, Goldring, Berends, & Cannata, 2012). In the market for education, students and their families create the demand for schools, and charter schools try to supply a service that satisfies that demand. To be successful, charter schools must convince students and their families that they provide a legitimate and desirable service. They must also be able to complete with other educational options (Bulkley & Wohlstetter, 2003).
Charter schools gain legitimacy to the extent that they can discern the educational needs of their communities and offer services that attract a student body. In an effort to do this, charter schools create and publish mission statements that identify the population of students they plan to serve, populations that may have particular needs, talents, or skills. If schools with innovative missions are systematically more likely to close, this may suggest that there is not a demand for the services they offer. High enrollments, in contrast, may signal that a charter school is successfully competing with other schools in convincing parents that it can meet their educational needs (Lacireno-Paquet, Holyoke, Moser, & Henig, 2002). As suggested by organizational theory (Hannan & Carroll, 1992; Hannan & Freeman, 1977), the proliferation of charter schools in a school district may also signal that they are gaining legitimacy.
There is a limit, however, to the number of charter schools a school district can support, and as the number of charter schools increases, competition among charter schools may weed out schools in lower demand. Market forces thus not only hold charter schools accountable by promoting and legitimizing the subset of schools that meet community demands, but they also hold charter schools accountable by limiting their expansion in areas where the demand has been met. Generally, we expect an increase in the number of charter schools to decrease the likelihood of charter school closure, but as the market becomes too saturated to support new schools, the likelihood of charter school closures will rise and schools that do not meet market demands will fail. Thus, we employ the commonly used metric in population ecology—density and density-squared to examine market accountability in charter schools (Hannan & Carroll, 1992).
Bureaucratic Accountability
Charter schools are required to comply with laws and rules or face negative sanctions (Cuban, 1988; Darling-Hammond, 1988; Kirst, 1990). In North Carolina, charter schools must reflect the racial and ethnic composition of the district. Given this law, we expect North Carolina charter schools to comply with laws of racial balance or experience closure as a result of bureaucratic accountability. Empirical research on racial balance in North Carolina charter schools in the 2000-2001 academic year, finds that only 8 of 97 charter schools had higher percentages of White students than traditional public schools located in the same district (Manuel, 2002). But Manuel (2002) finds that 20 of the 97 charter schools had a lower percentage of White students than the traditional public schools within the district. Thus, charter schools have the potential to racially isolate students either by creating all White or all Black schooling options (Bifulco & Ladd, 2006).
Financial Accountability
The final form of accountability we examine here is that of finances. Measures of finances are often included under the auspices of bureaucratic accountability (see, e.g., Darling-Hammond, 1988), but because charter schools have relative flexibility with their finances, have funding formulas different from public schools, and often rely on grants, we argue it is important to separate financial measures from other types of accountability in this study. Charter schools receive per-pupil financial assistance from the state, federal, and local government in the North Carolina system. Charter schools are subjected to periodic financial evaluations and audits, and charter school administrators must effectively negotiate their financial flexibility in order to stay in operation (Bifulco & Ladd, 2006). We expect that charter schools receiving more per-pupil aid from the local, state, and federal government are less likely to close, because an increase in per-pupil aid may ease the burden of financial management.
Data and Method
For the quantitative component of our analysis, we compiled a data set from multiple publicly available data sources, each of which provides different information on individual charter schools and their geographic districts. We drew from three primary sources. First, the Common Core of Data (CCD), collected by the National Center for Education Statistics (NCES), provides information regarding school districts across the United States, including financial information. Second, two CER databases separately list open and closed charter schools. Finally, the test score data and financial measures are provided by the North Carolina’s Department for Public Instruction for each charter school.
Linking the information on charter school openings and closings to the CCD information creates a larger data set that shows both charter school and district information. In order to do this, we used the NCES agency identification numbers for each charter school and pinpointed the district identification number from the online locator. In the case of missing data, we independently collected data from alternate sources (e.g., district or charter school websites).
The qualitative data also comes from numerous sources. We gathered information from newspaper articles, the minutes from charter school board meetings, minutes from court hearings or appeals, and communication with a member of the now nonoperational charter school advisory board. In selecting the cases for the qualitative portion of our analysis, we considered a number of factors. We chose schools that were of similar size and opened and closed within the same general time period, thus falling under the same body of charter school legislation and subject to the same requirements and regulations. These schools have different mission statements.
In order to systematically analyze the qualitative data, we used an inductive approach where we allowed emergent themes to arise. For instance, we coded words that fit into important categories for our analysis (i.e., finance, accountability, test scores). We coded responses and ideas that reflected one of the positions in one of the types of accountability. Our analysis below depicts how the financial category emerged the most in our qualitative data. We found that financial malfeasance developed as an important and reoccurring category, although it was not one of our original categories. We used our informant to help provide background and insight to our various categories, particularly when our categories were ambiguous. His interview helped us elucidate the data. More details of the data collection process are included below.
Variables
Dependent Variables
Charter School Operating Status
We code a charter school 1 if it is closed and 0 if it is open in a given year. Our definition of a closure is a school that was operating (i.e., educating students) and then closed its doors forcing students into different schools. We do not include schools that received a charter from North Carolina but then could not find facilities to begin operations or relinquished their own charter before opening. There have been approximately 11 of these charters in North Carolina. Our measure of closure is more conservative and includes only the schools that served students in a brick and mortar school and then ceased to do so.
Independent Variables
Performance Accountability
Academics
We include the school reading and math score averages, using scores from the ABCs of Public Education Tests (North Carolina Public Schools, 2012). We choose to use reading and math scores in our analyses because these are the most widely tested subjects across the United States and are mandated by No Child Left Behind Act (NCLB). We take an average of the reported grade-level scores to create a school-level measure of both math and reading performance. For instance, if a charter school serves Grades K-8 and we have data for Grades 3, 5, and 8, we compute a mean score from these three data points to use as our independent variable. In the event that we only have data from two grades (e.g., Grades 5 and 8), we create a mean score from these two data points. Similarly, if a charter school serves Grades 6-12, and we have data for Grades 8 and 10, then we create a mean from those data points. 1
Market Accountability
Mission statements
The data on mission statements is provided in charter school descriptions, which are listed in multiple places (e.g., CER’s website of open charter schools, charter school web pages). We coded mission statements into two distinct categories: innovative mission statements and noninnovative mission statements. Innovative mission statements are those that possess any goal other than traditional academics. For instance, thematic missions (e.g., fine arts, vocational, leadership, at risk) are coded as “innovative,” and mission statements geared toward achieving traditional public school goals (e.g. academic, noninnovative) are coded as “noninnovative.” An example of an innovative mission statement reads, “Focus on student service projects, partnerships with the community, character development and reinforcing values learned at home.” A noninnovative example reads, “Uses direct instruction. Goal is to help students develop to their fullest potential.”
Density
We include two variables to measure the competition of the district—number of charter schools in the district and density-squared. These measures are common in studies of population ecology (Hannan & Carroll, 1992). In this instance, density is used to measure legitimacy (i.e., as more schools enter the market, the organizational form gains legitimacy) and density-squared measures competition (i.e., as schools enter and saturate the market, they must compete in order to survive; (for other charter school research using these measures and a more in-depth discussion, see Renzulli, 2005).
School enrollment
The school enrollment variable is the average daily membership (ADM) for each charter school, as reported by the North Carolina’s Department of Public Instruction (North Carolina Public Schools, 2012). The ADM is the average number of students present each day of the school year.
Bureaucratic Accountability
Racial balance/compliance
We include a measure of racial balance/compliance as a test for bureaucratic accountability. In North Carolina, charter schools are required to enroll a student body with a racial demographic that reflects that of the district by their second year of operation. We create this variable in two steps. First, we calculate the difference of the racial composition between the district and school for each demographic group by subtracting the school demographic information from the district demographic information (racial demographic information comes from the CCD). Second, we dummy code a new variable as “compliant” if the difference is within 10% of zero. 2 We choose to use the “White compliance” variable for our measure of racial balance in our analysis because the law makers’ intention was to avoid White segregation (Bifulco & Ladd, 2007; Merton, 1957). Please see Table 1 for more information on each variable.
Variables of Interest: Definitions, Sources, and Descriptives.

Note. N = 604 organization-years.
Financial Accountability
We include three levels of finance variables which reflect the state, federal, and local government contributions to each school. The data are provided by the North Carolina Department of Instruction (North Carolina Public Schools, 2012).
State funds
The state funding variable reports the total state funding that each charter school received in a given year. The amount of state funds awarded to each school is primarily dependent on the schools’ average daily attendance. In addition, schools receive more state funding based on the number of students who have documented disabilities and/or who have limited English proficiency.
Federal funds
The amount of federal funding that a school receives depends on the enrollment of students with disabilities, in poverty or in vocational education. These funds may also reflect additional grants that the charter school has applied for and been awarded from the federal government designed to support focused programs (i.e., Reading First Grant, Safe and Drug-Free Schools, and Communities Grant, etc.) While state allotments do not carry over year to year for charter schools, some federal funds will carry over for 15 months. Our measure indicates the amount of federal funding per ADM.
Local funds
The North Carolina, Department of Public Instruction (North Carolina Public Schools, 2012) states that the charter school will receive allocations per child based on local funding that is equal to the per-pupil expense appropriation amount transferred from each student’s Local Education Agency (LEA).
Control Variables
Other Variables of Interest
We control for organizational factors within the school and at the district level. This is consistent with other research that uses organizational-level data (Powers, 2004). We include school age and school age–squared. We control for district enrollment and district expenditures (taken from the CCD); these variables are proxies for the relative size and wealth of the district. We also include a proxy for the schools’ relative socioeconomic status, by using a per-pupil expenditure on child nutrition. 3 Finally, we control for the percent of each racial group present at the school level (White is the reference group).
A Note on Missing Data
Before running any analyses, we examined the rates of missing data for all independent and control variables. While most of these data were complete, we did find that approximately one third of the academic data (i.e., math test or reading test scores) was missing. In order to run analyses, we imputed the missing data using a multiple imputation method ICE (imputed by chained equations) in STATA. This method uses regression techniques to fill in the gaps using other variables in the data set (Royston, 2004; van Buuren, Boshuizen, & Knook, 1999).
Analytic Strategy
In order to answer our question about how accountability mechanisms affect failure, we begin our analysis with a quantitative assessment of charter school failure to test the multiple ways charter schools are accountable in NC. We use an event history analysis (EHA) to examine the effects of performance-based, market-based, and bureaucratic-based accountability measures on closure rates. An EHA is consistent with studies of organizations, interested in foundings or closures (see, e.g., Petersen & Koput, 1991).
Population ecologists suggest that individual organizations have trouble transforming themselves to fit their environment and that populations of organizations change primarily through the formation and death of individual organizations (Aldrich & Reuf, 2006; Hannan & Freeman, 1977; Renzulli & Roscigno, 2005). This methodology is thus well-suited for examining mortality rates of organizations (Hannan & Freeman, 1989). Population ecology would suggest that it is not the market (e.g., through active parental choice per se) that influences the rate of charter schools closings, but that closure is instead the effect of environmental conditions.
In our EHA, we notice particularly interesting findings with regard to financial accountability and thus present two extreme case studies of charter school closure, taken from our initial sample of North Carolina charter schools to help explain our results. This mixed method approach is useful because it allows us to study a research question from various perspectives (Lieberson, 1992; Pearce, 2002) and to achieve an enhanced understanding of the relationship between accountability and charter school closure. While the event history analysis provides a macro-level examination of closure within the state, the case study portion of our analysis provides a more nuanced picture of the process of charter school closure.
First, EHA allows us to examine the amount of time that passes from the time a charter school opened until it closed (Allison, 1984). Our interest is in the probability of a charter school closing in any given year, and although closure can occur at any time, most schools do not close during the school year because the reauthorization processes occurs at the conclusion of academic years. Thus, we constrain closing to once in a year and use a discrete time model.
The conceptual dependent variable is the hazard rate of failure and is defined as the probability that a school will close during a particular period, given that the school is “at risk” of closing at that time. The hazard rate is then determined by a set of independent variables included in the model based on theoretically driven ideas of accountability. Though the hazard rate is a probability and thus an unobserved variable, the observed dependent variable for estimating effects in EHA is a dummy variable that is scored 1 for each case when a school experiences closure, 0 otherwise. The dichotomous nature of this variable makes a logit model the correct estimation technique.
Left and right censoring are typically serious issues in organizational EHA analyses. Censoring occurs when the population of schools is only partially observed. An advantage to our data is that left censoring is not a problem because we obtained information on all charter schools in North Carolina. That is, we observe the entire population of charter schools from when they first became legal educational options in North Carolina. We do have right censoring, however. The most accurate and complete data for charter schools is available through 2005; thus our analysis ends at 2005 and charter schools that are open in 2005 are still at risk for closure after our observation window. Right censoring is a common problem in survival analyses because observation windows must eventually close, but discrete time modeling accounts for both censoring and time-varying independent variables, which is not possible in standard logistic or ordinary least squares regression (Mills, 2011).
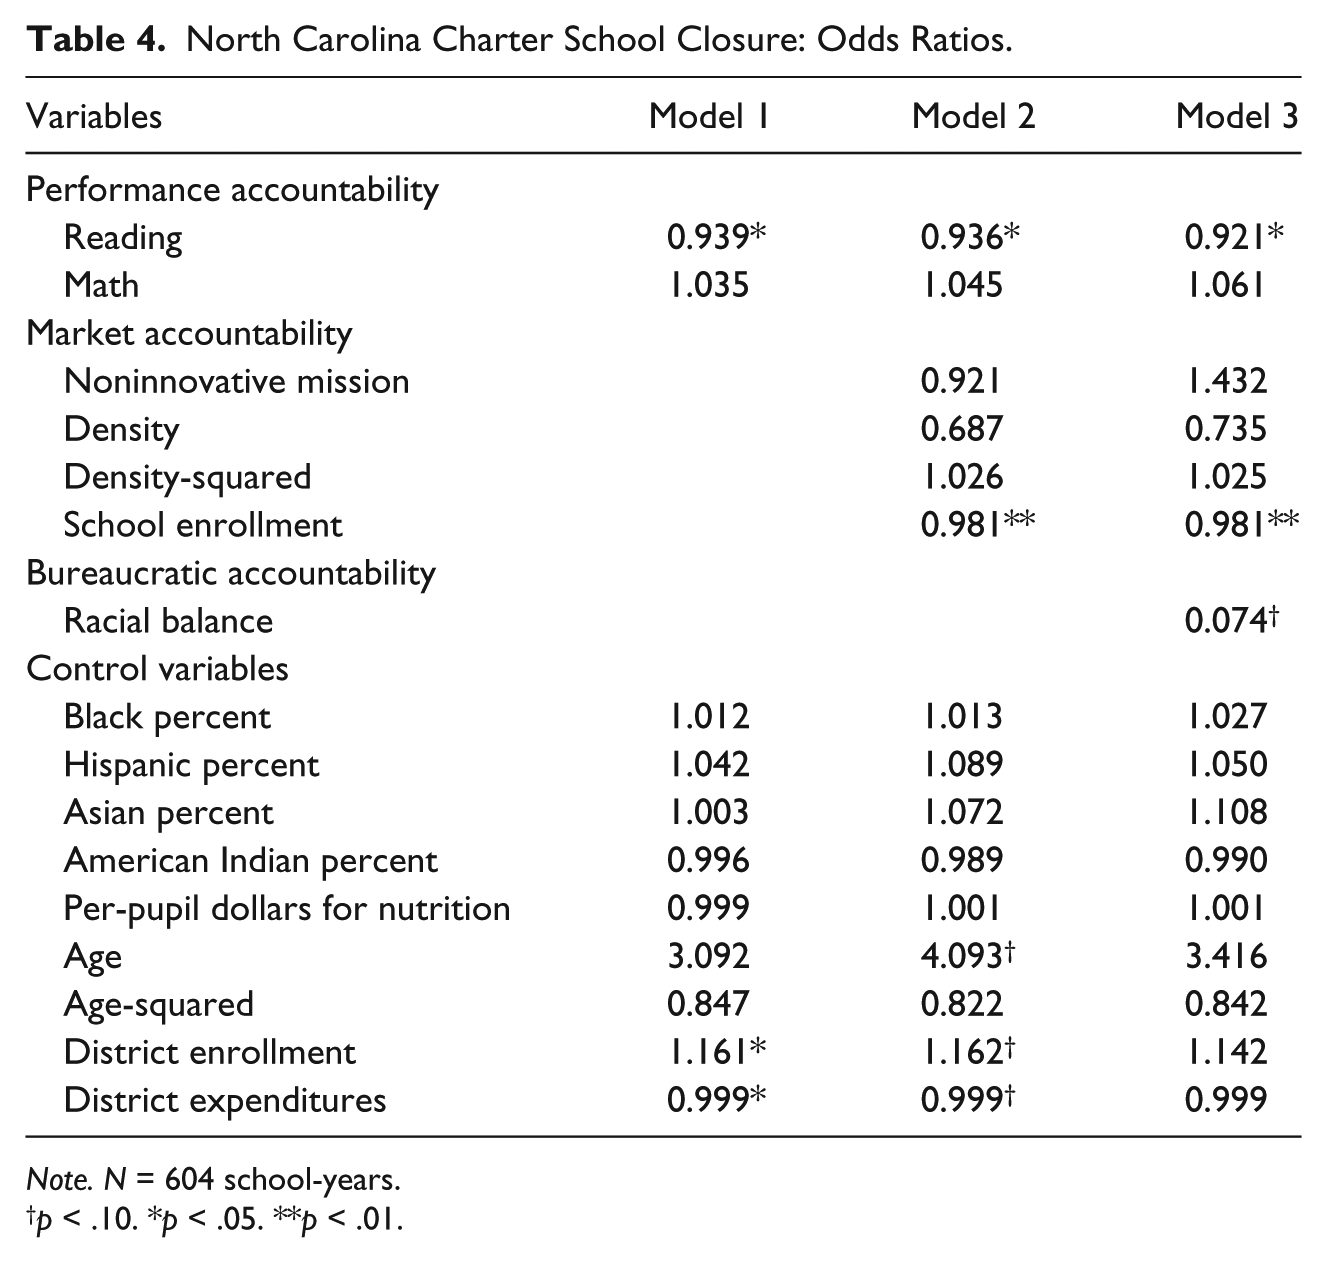
The quantitative analysis is presented in two tables, each with three models. The first table (Table 4) includes measures of academic performance, market accountability, and bureaucratic accountability. Model 1 shows the likelihood of closures based only on academic performance measures and control variables. This model allows us to test the academic performance-based accountability perspective, before considering the other two types of accountability. Model 2 introduces variables that reflect market accountability, while still considering the academic measures and control variables from the previous model. Finally, in Model 3, we include our bureaucratic accountability measure, before we include financial accountability in the following table.
The second step in our analytic strategy is to examine case studies of failed charter schools. The cases provide an examination of procedure and offer insight into what “accountability” means for the state of North Carolina charter schools. After summarizing the cases, we compare the stories of the schools and illustrate how the qualitative analyses provide a valuable addition to the event history analysis.
Findings and Results
Over the course of 8 years (1997-2005), 119 charter schools appeared within the North Carolina educational market. Based on the 2005 data, only 95 of those charter schools remained in operation. The estimated hazard rate (our dependent variable) represents the percent of charter schools in the population that are at risk for failure and is a dynamic characteristic of the distribution of the North Carolina charter school population. Table 2 indicates the landscape of charter schools and the estimated hazard rate for the probability of failure in North Carolina. We calculate the estimated hazard rate at each time point by dividing the number of charter schools closed by the number of charter schools at risk in the population, using the following formula:

Distribution of Charter School Openings and Closures in North Carolina.

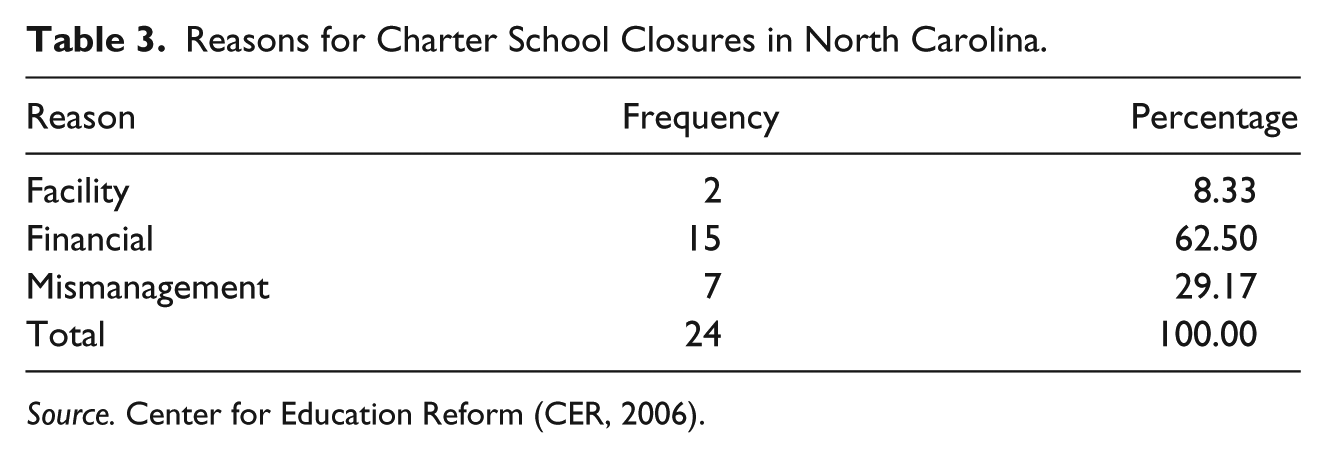
Before examining charter school closures using an EHA, we first look at the frequency of reasons given for charter school closures for the state of North Carolina in order to understand the landscape of charter school closures (Table 3). We find that charter schools in North Carolina report closing for only three reasons: Facility, Financial, and Mismanagement, with the majority of schools closing for financial reasons. None of the charter schools report closing for academic reasons. Nevertheless, we still hypothesize that performance accountability is relevant, particularly in light of the discourse of performance accountability that surrounds charter school and school choice discussions (Harris & Herrington, 2006).
Reasons for Charter School Closures in North Carolina.
Source. Center for Education Reform (CER, 2006).
Our EHA analysis in Tables 4 and 5 produce interesting and important findings regarding the accountability mechanisms and charter school failure that would not be fully understood by looking at the cross-section and descriptive data. In Table 4, Model 1, we find reading scores are significant predictors of closures, indicating that academics have an influence on charter school closures. While this model only shows performance accountability measures and control variables, it does partially support the performance-based accountability perspective, which would predict that as reading (but not math) scores increase, a charter school will be less likely to close. We also see that the size of the district (i.e., district enrollment) is positively correlated with school closures and the district’s expenditures are negatively associated with school closure.
North Carolina Charter School Closure: Odds Ratios.
Note. N = 604 school-years.
p < .10. *p < .05. **p < .01.
North Carolina Charter School Closure: Odds Ratios.
Note. N = 604 School years.
p < .10. *p < .05. **p < .01.
Table 4, Model 2 introduces the market accountability variables into the model. In this model, we find school enrollment is a significant predictor of charter school closures, indicating that as the school enrollment increases, the charter school is less likely to close. Reading scores remain significant; thus, we have support for both performance-based accountability and market accountability. The mission statement of the charter school and the district density are not significant predictors of charter school closure. At the time of this study, however, North Carolina still had a cap on the number of charter schools (limit of 100 in the state), which could contribute to the findings in these models. If the charter school population does not grow enough to meet what population ecologists (Hannan & Freeman, 1977) refer to as the “carrying capacity,” or saturation of the market, then the number of charter schools will not have a significant effect on individual charter school closures.
In Table 4, Model 3, we introduce a bureaucratic accountability measure of racial balance. Racial balance is significant at the .1 level and indicates that charter schools that represent the general racial composition of the district are less likely to close compared with the noncompliant schools. 4 Under the North Carolina law, this should not surprise us. Model 3 also shows reading scores are a persistent predictor of organizational success. As schools experience a unit (i.e., a 1 percentage point) increase in reading scores, they are 8% less likely to close.
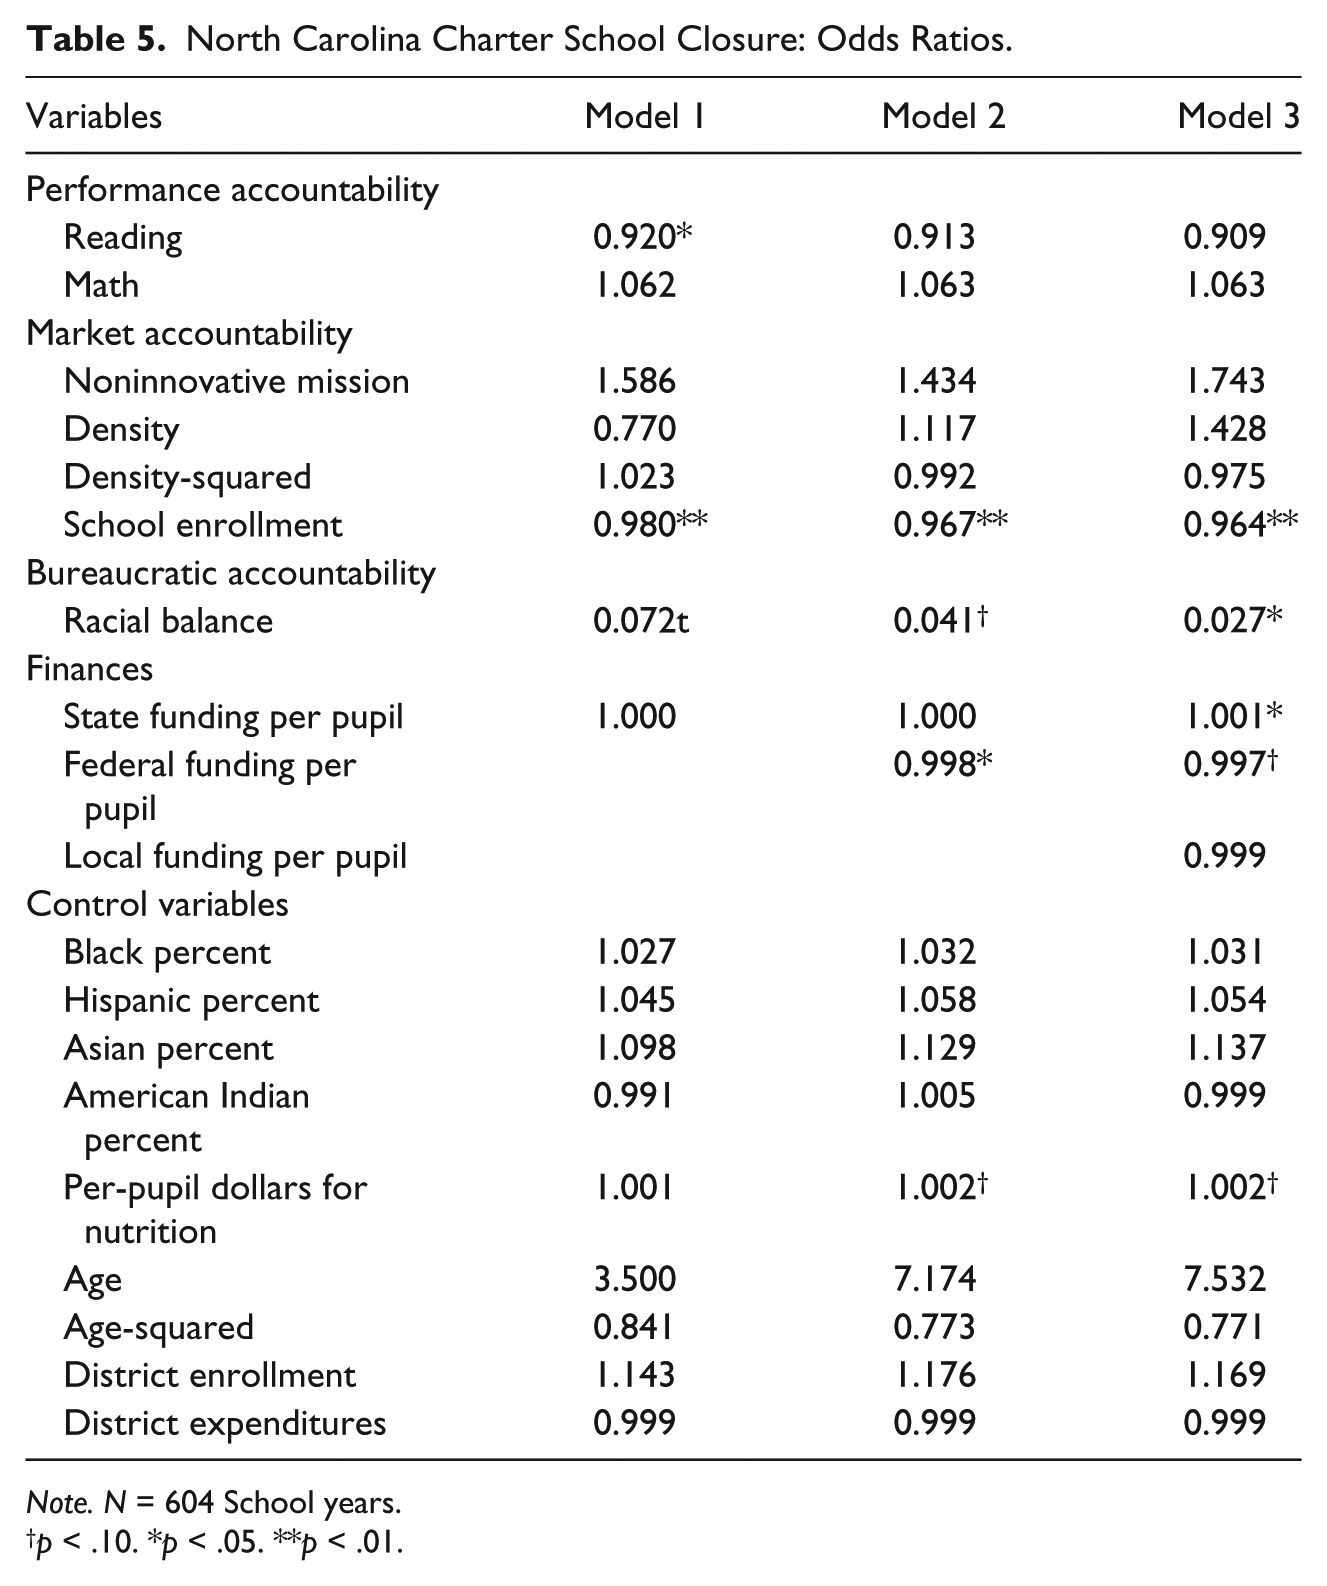
Table 5 introduces measures to capture the effects of financial accountability, using the per-pupil finances available to the charter school, net of other variables included in Table 4. We step each type of financial assistance into the model based on the relative difference from school to school. Model 1 includes state-level financial contributions and it is not a significant predictor of closure. We also see that reading achievement, school enrollment, and racial balance remain significant.
The second model in Table 5 adds financial accountability from the federal level. Not all charter schools receive funds from the federal government, and federal-level funds are significantly associated with charter school closures. As per-pupil federal funding increases, a charter school is less likely to close. With the addition of financial funds at the federal level, we see that reading achievement is no longer a significant predictor of charter school closures, although it is significant at the .103 two-tailed level in this model. Finally, we include the local measure of finances, which creates our full model. We find that both federal and state funding are significant predictors (.1, two-tailed test) in the final model but local is not. Furthermore, racial balance, school enrollment, and per-pupil spending on nutrition are significant in our final model.
After including the financial measures, specifically the federal finances, in our quantitative models we learned that the school’s financial condition is an important dimension in predicting school failure. However, it appears that it is not the only accountability mechanism at work—market and bureaucratic accountability still play a role in charter school closures. Recall Table 3, where we see that charter schools report closing for only three reasons: Facility, Financial, and Mismanagement. None of the charter schools report closing for racial imbalance or low enrollment, even though we saw these were predictors of closure in our quantitative models. In addition, academic scores for reading seem to predict failure until we consider federal finances. We considered that academics may only predict failure when financial conditions are poor. We tested for this possibility by creating an interaction between finances and reading achievement. The results were not significant and therefore are not shown here. The relationship between academic scores and finances may be more complex, however. Quantitative measures can only examine the financial condition in dollar amounts and cannot capture the various aspects of financial management. The relationship between finances and academics may stem more from financial management than from per-pupil values. We suspect that knowing about poor financial management, however, would only occur once a school has failed and thus measures of poor financial management are difficult to quantitatively model. Thus, we move to our qualitative case studies to gain insight into the micro processes of closure and further explain how the different mechanisms of accountability operate for charter school failures.
Case Study Analysis
We analyze two cases of charter school closure that occur during our observation window—LIFT and PHASE Academy—in order to explore how accountability mechanisms are nuanced and affect the process of closure. Both LIFT and PHASE lost their charter and closed due to financial problems, and these case studies offer insight into closure practices due to financial accountability but in slightly different ways than the quantitative analysis might reveal. Table 6 illustrates summaries of our two case studies.
Case Study Descriptions and Summaries.

During the time that our case study schools were operational, North Carolina had the Charter School Advisory Committee, which provided opinions to the state board on issues regarding opening and operating charter schools. This advisory committee disbanded in 2007 but we were able to interview a member of the committee, Steven Smith, 5 who served during the entire lifespan of both our case schools and was intimately involved with the charter revocation processes. He therefore possessed a wealth of firsthand knowledge about the factors leading to the closure of each school and the political intricacies of each revocation. Furthermore, his interview provided clarification of how charter school policy was enacted and occurred within the system of North Carolina during the time period in question.
In addition to our key informant and his interviews, we secured records from multiple sources. First, we obtained and analyzed minutes of the North Carolina Board of Education meetings whenever our case schools were on the agenda. Second, we examined all reports on these two schools published in the local newspapers of each city. In order to provide a comprehensive search of these records, we secured access to the entire archives of the main local newspaper of each city and completed searches of these archives for anything relating to each school. We also searched the archives for any articles relating to charter schools in general published within 1 year of the opening and up to 1 year after the closing of each school. Each local paper published over 10 articles relating to the failure of the charter school in each respective city, and thus provided a comprehensive picture of the information about each closure that was easily publically available. Third, we cross checked information from organizations such as the CER and National Alliance for Public Charter Schools (NAPCS). Fourth, using state records, we carefully reviewed the laws of North Carolina that reference the authorization, attainment, maintenance, and revocation of a charter during the time period in which both of the schools were active. Finally, we read all the court reports—filings and decisions—related to the closure of both cases. These reports provided further information on the stated reasons for the loss of the charter and the response by the school to this decision. Together, our informant and detailed collection and content analysis of written records and reports on these cases provide us with a comprehensive history of the factors that led to the closure of each charter school. We are able to better understand the micro-political processes that influenced each revocation process, in the formal sphere as well as “behind the scenes.”
The Case of LIFT Academy
LIFT Academy is an interesting example of a failing and racially imbalanced school that was closed for financial reasons. LIFT Academy opened in 1997 with a mission of providing a strong academic program with a technology focus to students who were having trouble succeeding in public schools and were classified as “at-risk” (CER, 2006; Giunca, 1998). Despite this goal, real outcomes for LIFT’s students came into question soon after the charter was granted. Test scores did not demonstrate overwhelming academic improvement among LIFT’s students; in fact, test scores from the Year 2000 showed that less than 10% of students were achieving at grade level (see Figure 1 for more detail on the academic achievement of LIFT; (Ziegenbalg, 2000c). In addition to student achievement, it was clear that the school was out of compliance with a state regulation regarding racial balance. LIFT served a student body that was approximately 99% Black in district that was 79% Black. While this was considered a problem by the Charter School Board, according to Steven Smith, neither the racial composition issues nor the low academic performance of LIFT’s students was the precipitating factor in the loss of the charter. Instead, our research shows that these factors were almost never discussed in any public forums, and all proceedings to close the school cited financial mismanagement as the formal cause of the decision to revoke the charter (CER, 2006; Ziegenbalg, 1999b, 2000a).
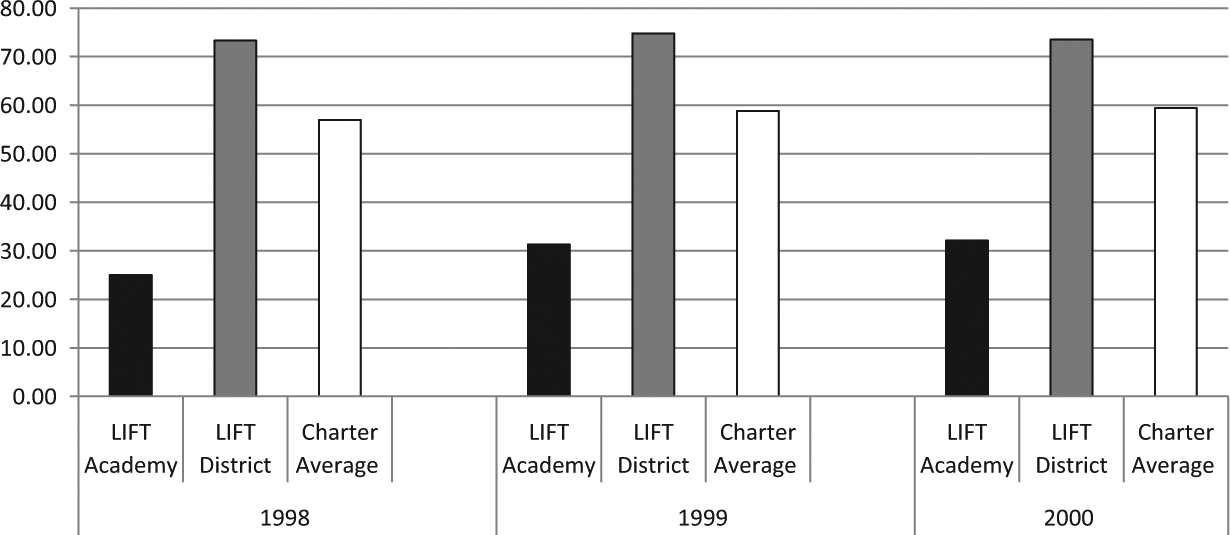
Academic outcomes for LIFT Academy, charter schools, and district, by year.
In 1999, the North Carolina Charter School Advisory Committee began its investigation of LIFT on the basis of financial instability and mismanagement. They found that LIFT owed the Internal Revenue Service $33,000 in payroll taxes from 1997, the last year that LIFT operated as a private school, and these unpaid taxes were not reported in the charter application. While the tax debt had since been settled, LIFT administrators could not prove that the debt was not paid off using state funds provided to the school since it became a charter (Rice, 1999; Zerwick, 1999). Additionally, LIFT was known to have operated at a deficit during the 1998-1999 school year, but the amount was contested: the Advisory Committee claimed that LIFT owed over $90,000, but LIFT contended that the deficit was far less (Ziegenbalg, 2000b). Finally, the Committee stated that LIFT had not been able to keep proper financial records, and the true financial difficulties of the school were hard to ascertain. The board also claimed that LIFT had engaged in a number of questionable financial practices, such as misusing money earmarked for other purposes and paying the cell phone bills of employees (Perez, 1999), accusations that school administrators contested. Based on this evidence, the recommendation was made to the State Board of Education that LIFT’s charter be immediately revoked.
After filing a failed appeal, LIFT’s administrators filed a lawsuit with the Superior Court of North Carolina, claiming that LIFT was denied due process (Ziegenbalg, 1999a). Over the next 8 months, while the lawsuit remained in courts, LIFT was able to remain open long past the State Board’s vote for revocation. Both sides continued to present new and conflicting evidence about the financial stability of the academy as well as legal arguments that addressed whether or not LIFT had in fact been given due process by the State School Board. In all these debates, however, the academic achievement of the students and the racial composition of the school was absent from both discourse and all legal filings. According to an attorney for LIFT, other North Carolina charter schools had similar financial difficulties, but the state had not moved to revoke their charters. During the trial, the attorney commented that an analysis of schools that had their charters revoked “may show a pattern” (Ziegenbalg, 2000a) as three of the four schools that had lost their charters served majority Black student populations. According to the state, however, all of the charters were revoked for good reason, and the decisions were not influenced by racial demographics. Instead, the state continued to focus on financial issues as the cause of the revocation; and after 2 long years, the Superior Court of North Carolina ruled that the State Board of Education had followed proper procedures and could proceed with closing the charter school (Ziegenbalg, 2001) based on financial insolvency.
The Case of PHASE Academy
PHASE Academy opened in 1998 and educated K-8 students until its charter revocation in 2000 and official closure in January of 2001. According to documentation from numerous sources, PHASE Academy closed due to financial noncompliance (CER, 2006; North Carolina State Board of Certified Public Accountant Examiners, 2001; North Carolina State Board of Education, 2000; Office Of Administrative Hearings, 2001). Schools that close under the category of financial noncompliance may be closed for many different types of financial issues. For PHASE Academy, financial noncompliance referred to a number of instances where mismanagement was deliberately occurring.
Poor academic scores—that is, scores far behind other charter schools and its own district academics—did not prompt investigation that led to the demise of PHASE (see Figure 2). Neither did their racial incompliance. Instead, the school had failed to make proper payments to teachers, lacked employee health insurance, and lacked documentation regarding salaries. According to Steven Smith, teachers were openly complaining about PHASE Academy’s financial situation and the state of the bankrupt school. This information began leaking to the community and led to the formal investigation of PHASE’s budgetary situation. The investigation began in April of 2000, when PHASE was placed on “Financial Cautionary Status” after failing to comply with North Carolina General Statutes that require a charter school to provide an audit at the conclusion of the fiscal year (ended June 30, 1999; North Carolina State Board of Certified Public Accountant Examiners, 2001).
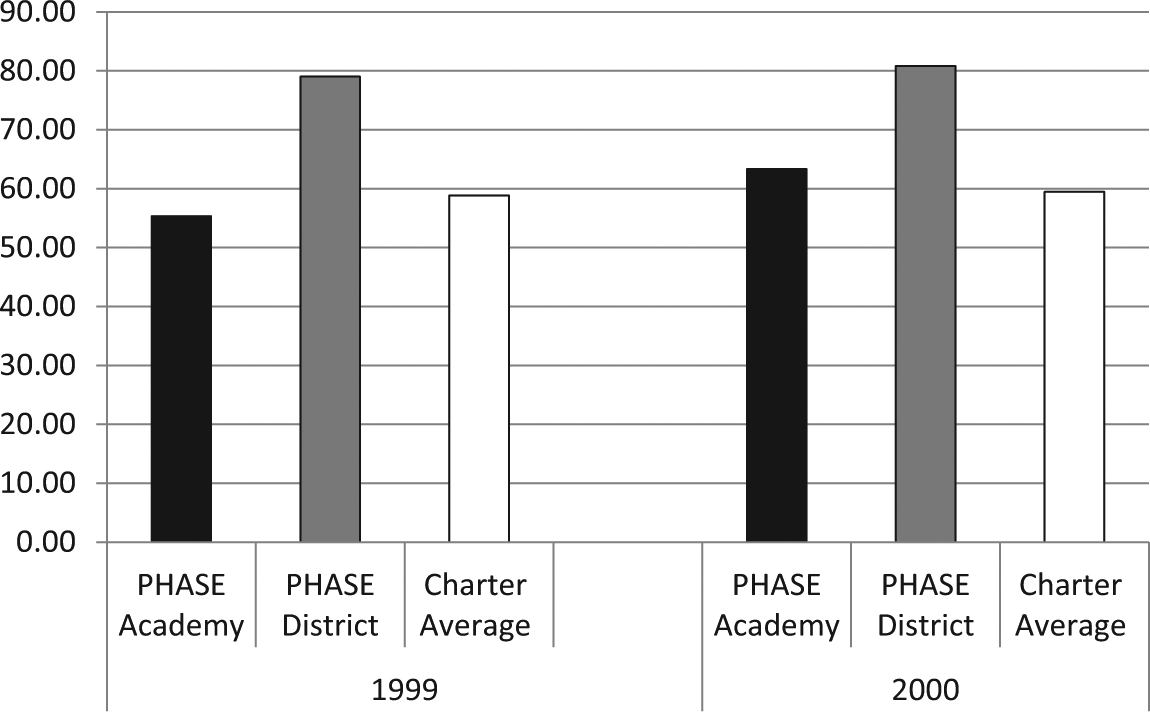
Academic outcomes for PHASE Academy, charter schools, and districts, by year.
By September, PHASE Academy had been placed on “Financial Probationary Status” because of the use of an invalid budget code in their revised reports. According to the Department of Public Instruction, “PHASE Academy was operating with a deficit of $124,003 and that it was delinquent in remitting payroll taxes to state and federal governments” (Office Of Administrative Hearings, 2001), and finally in 2000, the school was recategorized as “Financial Disciplinary Status” (Office Of Administrative Hearings, 2001). The failures cited in this review include, “failure to make required payments to the State Health Plan for PHASE employee health insurance premiums, missing checks, absence of receipts or invoices for funds paid out, absence of documentation for salary payments, failure to balance bank accounts for several months, and failure to provide an accurate list of outstanding debts/accounts payable” (Office of Administrative Hearings, 2001).
The investigation showed that the school had been operating with approximately 100 students, but the principal was paying herself a salary of $100,000. The salary was not directly proportional to the number of students the school educated, creating a financial problem for the entire school. Furthermore, the teachers who were friends with the principal received bonuses and had a 13-month paycheck cycle. Other teachers did not receive any pay, and according to the CER, some teachers left the charter school unpaid after its official closure (CER, 2006).
After being placed on severe disciplinary status, PHASE Academy sent representatives to a Charter School Advisory Committee meeting where the members of the committee recommended a revocation of PHASE Academy’s charter, largely based on the unabashed fiscal mismanagement of the school. The decision to terminate the charter was quickly made after the recommendation for revocation of the charter for PHASE Academy, and despite relatively poor academic performances (compared with the PHASE district), the charter school advisory committee remained silent on that issue. PHASE Academy was closed in January of 2001 and now operates as a private school under a different name (Smith, 2003).
Discussion
Our dual-method analysis provides a deep understanding of charter school closure processes in North Carolina. Here, we see that two schools that were in many ways academically failing did indeed close their doors. If one were to interpret just the quantitative analysis, the cases would fit the statistical explanation, such that charter schools are financially accountable, despite low academic scores, but the stories are more complicated and nuanced, with micro-politics playing a central role in the path to closure for both schools. Notably, the schools were in violation of other state-mandated requirements and reported poor educational achievement by students and a lack of racial diversity. However, the charter revocation process was only initiated by the North Carolina State Board of Education when the mismanagement of finances in each school became apparent; but, this could be an artifact of how the legal system functions in North Carolina.
The quantitative portion of this study points to reading academic achievement as an important factor in predicting charter school closures until we add measures of federal financial per-pupil funding, suggesting that the schools in North Carolina that did experience closure were also underperforming schools. Regardless of this finding, academics were neither listed as a formal reason for closure nor were they pursued during hearings, debates, or appeals despite concrete evidence that these charter schools were not performing at a level consistent with the district or statewide charter school average.
The cases of LIFT Academy and PHASE Academy are distinct in many ways, but both cases demonstrate the centrality of a particular type of accountability—financial accountability. Despite the stated purpose of charter school reform to improve academic outcomes for students (Henig, 2008), poor test scores did not lead to formal censure in the case of LIFT (Ziegenbalg, 2000c); nor was it even the first issue brought up for discussion. Similarly, PHASE Academy closed its doors when financial corruption eroded the credibility and functionality of the school; however, the extent of the financial dishonesty may have also hindered teaching and learning abilities within the school. Based on these examples, we contend that although academic accountability is part of the political rhetoric, financial instability provides the real impetus for revoking charters.
These two charter schools operated with a formal structure that specifies academic accountability as an important component for success. As these closures were both couched in the language of accountability, the tight coupling (Weick, 1976) of financial accountability can create an illusion that charter schools are accountable to the market, students, and parents. Despite the inferred interest in student outcomes, in both these cases, the oversight committees disregarded academic indicators in favor of holding the schools financially accountable. Thus, academic accountability standards are only loosely coupled with practice, and accountability is an institutional myth hidden beneath a story of schools that were “held accountable.” These cases reveal that the finances do lead to failure for these underperforming schools. Thus, this is evidence that the relationship between academics and failure may hold but predicated on financial mismanagement rather than just raw dollars.
To examine this yet further, if we look at the average test scores for charter schools that formally reported closure due to financial reasons and all other charter schools in the system, we see a general trend where, on average, all the other charter schools are academically outperforming those that closed due to financial reasons. In Figure 3, we depict reading scores and in Figure 4, math scores, on average. We show these scores by the age of the charter school. For instance, if one charter school opened in 1998, then “Year 1” for that charter school is the 1998 reported data; similarly, if another charter school opened in 2002 then, “Year 1” is 2002 for that charter school, and both those scores are on the same bar in our figure. These figures not only further support our findings from the quantitative analysis but also help us make sense of the very interesting picture we draw in the qualitative component of this article. In our quantitative models, we find that reading scores are correlated with the likelihood of a school closing, until we take federal-level finances into consideration; but, in our qualitative analysis, we find that the process of closure is formally one-dimensional. With regard to academic success, the charter school advisory boards are silent.
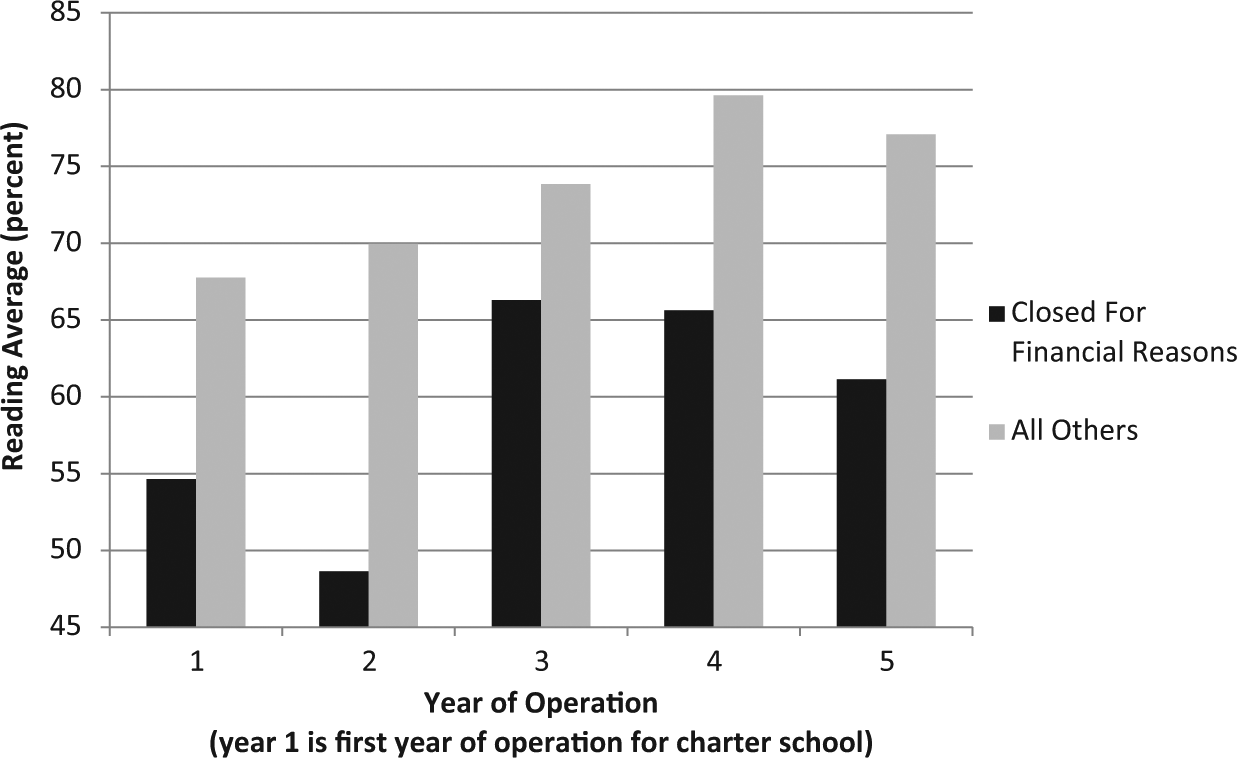
Reading averages by year for charter schools that closed for financial reasons and all other charter schools.
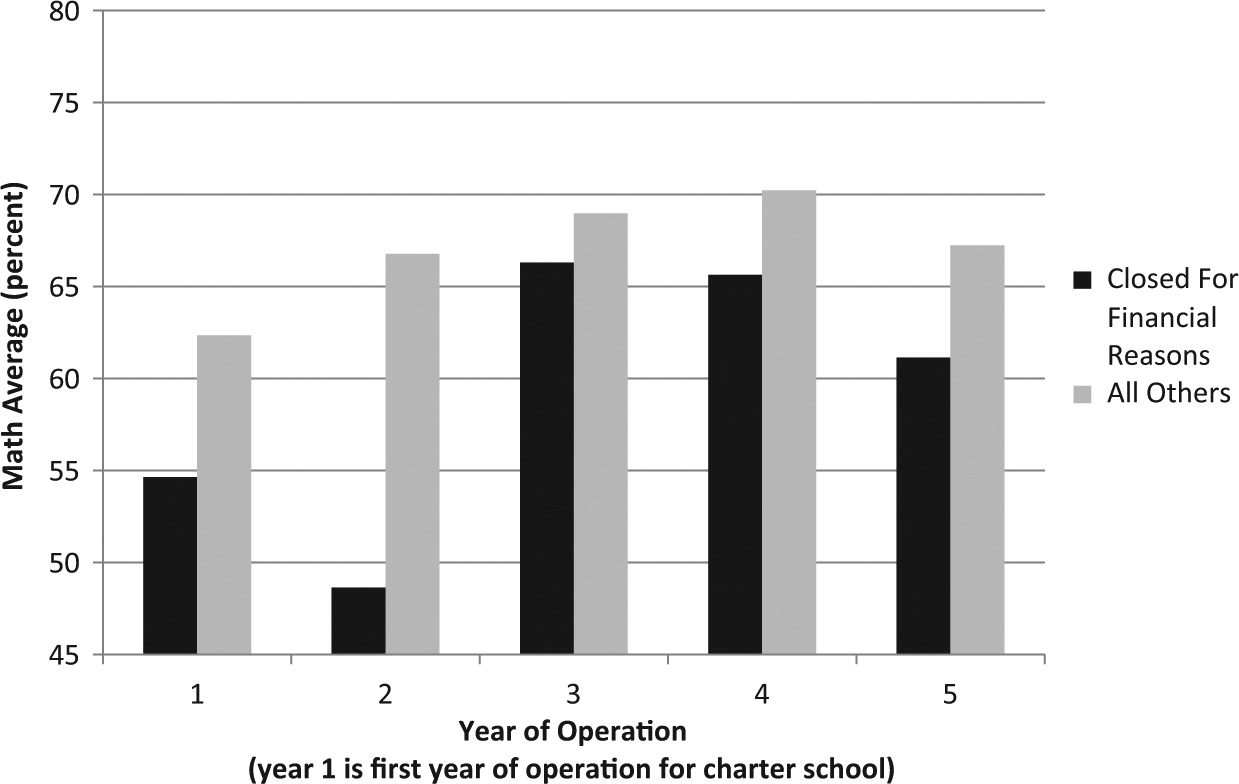
Math averages by year for charter schools that closed for financial reasons and all other charter schools.
In Figure 3, we show the reading scores for charter schools and the gap in scores is prominent in all 5 years for this bar chart. Charter schools that close due to financial reasons are considerably underperforming academically compared with all other charter schools in the same year. We see the biggest gap in Year 2 where schools that closed due to financial reasons report average reading scores just below 50% and all other charter schools report scores that are around 70%. Scores appear closest in Year 3, with those closing for financial reasons reporting just over 65% and all others reporting just under 75%. These figures also confirm our speculations about the relationship between financial accountability closure and academics.
In Figure 4, we show math scores, on average, between charter schools closing for financial reasons and all others. This bar chart for math scores also shows a difference in scores, although it is not as drastic as the reading scores for all 5 years shown. The most noticeable gap is again in Year 2. In Year 2, charter schools closing for financial reasons report math scores under 50% and all other charter schools report average scores over 65%. Similar to the reading scores, in Year 3, scores are quite close with those schools closing for financial reasons reporting average scores just over 65% and all others just under 70%. The contrast between reading and math achievement is interesting to note, and we wonder why reading achievement is more salient, relative to math. It is possible that reading scores are more disparate than math scores, and gaps are more sizeable in reading. For minority students in particular, empirical research demonstrates that reading gaps remain more prominent than math gaps, even when progress is made in both subjects (Galindo, 2009). North Carolina charter schools serve a relatively large minority population, and it is possible that reading scores lag further behind math scores, even when charter schools report improvement in both subjects.
These two figures are important because they bring together our two analyses and help explain how schools that close for financial reasons are also reporting poor scores in academics. Without any mention of academic scores in our charter school case study reports, the public may believe academics are not an issue for North Carolina charter schools that close. Indeed, Figures 1 through 4 show an extensive pattern of poor performance among charter schools closing for financial reasons. Taken together, these two analyses suggest that North Carolina investigates and revokes charters due to “finances” as a formal explanation, but perhaps tries to isolate academically poor charter schools in order to “weed out” those that are ineffectual. We do believe the charter school finances are also in disarray when those charter schools close and do not discount this finding in favor of academic, or performance-based, accountability. Rather, we contend that performance-based accountability, bureaucratic accountability, and financial accountability (e.g., financial mismanagement) coexist in charter school closures in the state of North Carolina.
Conclusion
In this study, we find that charter school closure is somewhat more complex than the popular performance model of academic accountability would suggest. Our two-pronged approach demonstrates that the process of charter school closure in North Carolina is loosely tied to academic indicators. Not one North Carolina charter school reported closing due to academic failure during our study window, and charter schools may report multiple reasons for closure, so this finding was not due to an inability to report several grounds for closure. In fact, our analyses demonstrate that charter school scores were continuously lower than district and overall charter averages for charter schools that closed in North Carolina. Yet in every case, closure was based on finances not on academics.
The examples of LIFT and PHASE Academies are cases in point. The process leading to closure was highly contested, but both schools were eventually closed because of the state and charter board’s concerns with their financial actions, despite other academic and bureaucratic problems. It is possible that financial mismanagement is a reason for closure that is more easily investigated, leading the State to proceed with the process of revocation for financial mismanagement more quickly or at a greater rate. In either situation, these cases demonstrate the importance of financial mismanagement to the charter revocation process, a finding that in some ways contradicts the general perception that the success and accountability of a charter school is primarily measured in terms of academic outcomes.
Our quantitative and qualitative analyses together reveal partial support for the four types of accountability. Both forms of analysis are important for revealing the process of charter school closure. By examining the population of charter schools in North Carolina, we learn that charter schools are accountable to their CSAs. By examining the qualitative case studies, we learn that closures play out through finances even though both schools were poor performing and racially imbalanced. Knowing how and why charter school failures are due to mechanisms of accountability allows policy makers to give better direction to current and future leaders of charter schools.
It is important for policy to consider how and why charter schools close, despite evidence of academic success. Leadership in schools may need to advocate for enhanced academic accountability in order to offset financial issues. Policy should encourage better finances for schools, because if we are going to invest in charter schools then we should invest in issues other than academic success (e.g., financial assistance or accountability). We should look to creating policy to improve financial assistance. Because policies for charter schools are woefully underfunded, it puts current and potential leaders at risk for failure, including those who may otherwise be exceptional at producing academic successes. Charter schools need assistance with financial resources to help good charter school leaders be successful. But, the push for accountability may run counter to the guiding philosophy of the charter school movement (i.e., more autonomy in return for more accountability).
This analysis is an important first step in examining charter school closures; but it only looks at the state of North Carolina and thus cannot examine variation by state law, region, or other state-level factors (e.g., state tests, state demographics). Future research on charter school closures should consider invoking state laws as possible predictors of accountability. Similarly, the next step in this research will examine charter school closures on a national level in order to address these empirical limitations. With our data, we are not able to examine micro-processes within the school; nor do we consider those at the parental level. Future research should fully investigate how financial accountability occurs internally and influences the success of a charter school. As educational researchers continue to analyze charter school accountability and closures from multiple perspectives, we move toward a more complete understanding of how charter schools are keeping the promises of accountability in the school choice movement and may begin to see how the role of charter school leaders encourage specific types of accountability.
Footnotes
Acknowledgements
We thank Elizabeth DeBray and Sheneka Williams for their comments on this article.
Declaration of Conflicting Interests
The authors declared no potential conflicts of interest with respect to the research, authorship, and/or publication of this article.
Funding
The authors disclosed receipt of the following financial support for the research, authorship, and/or publication of this article: Funding for this project is provided by the National Science Foundation (Grant No. 039310-01).