



Abstract
Introduction
Today’s school administrators by no means suffer from lack of data in their decision-making process. Since No Child Left Behind, educational leaders have been swimming in an abundance of performance data and instructional evaluations. And yet the question of how to most effectively use such data to design policies and target interventions remains elusive. Mandinach (2012) describes this phenomenon experienced by administrators at the school, district, and state levels as being “data rich but information poor” (p. 82). Numerous scholars have debated best practices for translating data into educational practice and policy (e.g., Bowers, Shoho, & Barnett, 2014; Halverson, Grigg, Prichett, & Thomas, 2007; Ingram, Seashore Louis, & Schroeder, 2004; Luo, 2008), and more generally the incorporation of performance information into performance management (Moynihan & Pandey, 2010), but significant work remains.
The current study tackles this question for a particular administrative problem: how to use more modern analytic techniques to identify students at high risk of dropping out from school, which could allow more effective steering of resources to those with the highest need. Increasing the rate at which students graduate from high school would greatly benefit both students’ long-term welfare and also societal welfare more broadly (Bureau of Labor Statistics, 2011; Wolfe & Haveman, 2002). The decision to quit school reflects not only academic achievement but also a host of personal, economic, and institutional factors (Eckstein & Wolpin, 1999). For this reason, teasing out the salience of different mechanisms contributing to high school success and completion could inform education administrators’ use of dropout prevention and support policies. In addition, building systems capable of accurately identifying students early on at higher risk of dropping out could allow for more refined targeting of school programs.
Researchers do know a fair amount already about which individual and institutional factors contribute to a student’s propensity to graduate from high school. In terms of demographic characteristics, female students are more likely to graduate than male students, White and Asian students are more likely to graduate than Black or Hispanic students, and students with limited English proficiency or free or reduced lunch eligibility are less likely to graduate than students without these designations (Silver, Saunders, & Zarate, 2008). Schools with more highly qualified teachers and fewer disadvantaged students tend to graduate a higher proportion of students. Other indicators, such as being old-for-grade and having poor grades and poor attendance, also strongly predict high school graduation (Allensworth, 2005; Balfanz, Herzog, & Mac Iver, 2007).
Two primary policy questions are intertwined here. First, what interventions and policies can effectively prevent dropping out? Second, how can administrators best target these interventions and policies to student populations at the highest risk of not graduating? Although the current study does not speak directly to the first question, it does provide insight into new methods for accurately identifying, early in their schooling, those students at high risk of quitting high school. 1 Traditionally, researchers have used analytical tools such as logistic regression to determine which individual factors contribute to propensity for dropping out. One of the best such attempts, by Allensworth (2005), constructed a system for classifying ninth-grade students in Chicago’s public school system as “on track” or “not on track” for graduation. A similar study, by Neild and Balfanz (2006), constructed a risk measure that correctly predicted high school graduation for eighth graders in 75% of instances. Such risk prediction analyses have resulted in the proliferation of “early warning” systems across school districts in the United States, despite system inaccuracies (Bowers, Sprott, & Taff, 2013).
This study uses machine-learning algorithms with longitudinal administrative data from North Carolina public schools to enhance knowledge of what factors predict high school graduation and dropout. These methods, which take advantage of flexible, nonparametric, and efficient data mining techniques, allow much greater precision in terms of accurately predicting high school graduation from large data sets of student records. In concrete terms, whereas earlier attempts for predicting high school graduation or dropping out for eighth grade students achieved only 75% success, the algorithms correctly predict graduation outcomes for up to 91% of students in recent cohorts. This is not to say that what happens in high school does not matter; but it does imply that academic trajectories are already highly stable on entrance to high school, and that early, intensive, targeted programs may be necessary to prevent dropout.
This study uses a rich administrative data set from the North Carolina Department of Public Instruction (NC DPI). The baseline training data set consists of all public school students in eighth grade in the 2007-2008 school year, and the testing data set consists of all students in eighth grade in the 2008-2009 school year. These student observations are then matched to graduation and dropout records available within the next 5 years. The rate at which these students graduate therefore corresponds roughly to the “5-year cohort graduation rate,” the likelihood that ninth graders graduate from high school at some point within a 5-year window. 2 This student sample is matched to 74 academic and behavioral indicators measured during earlier phases of their schooling from Grades 3 through 8. The predictor characteristics from these grades are chosen to reflect individual performance metrics across a number of domains, but do not emphasize institutional predictors such as school or district characteristics. (Given this study’s lack of a causal research design, it would be inappropriate to infer any conclusions about the effectiveness of different school- or district-level policies or practices.)
I first estimate logistic regression of the graduation outcome on the entire array of student predictor variables from Grades 3 through 8. This serves as a baseline method, similar to what already exists extensively in the literature. I then compare findings and predictions from logistic estimation with two types of statistical learning algorithms: (1) tree-based classification methods and (2) support vector machine (SVM) classification methods. Within each of these categories, I test a number of alternative specifications and “tune” or “prune” the models as necessary. 3 For each algorithm used, I perform cross-validation with separate cohorts for the training data set and testing data set so that I can state conclusively not only the in-sample validity but also the out-of-sample validity of each approach.
One contribution of this article is thus purely methodological. Empirical education research has benefitted greatly in recent decades from the development and improvement of quasi-experimental methods for policy evaluation (Murnane & Willett, 2010). However, the field has largely ignored or dismissed recent transformative developments in the areas of data science and computational methods (Varian, 2014). A small group of prior studies have used machine-learning algorithms to predict dropout in higher educational systems or in other countries (Lykourentzou, Giannoukos, Nikolopoulos, Mpardis, & Loumos, 2009; Marquez-Vera, Morales, & Soto, 2013; Sara, Halland, Igel, & Alstrup, 2015); however, only one study, to the author’s knowledge, has used such methods to predict high school dropout in a population of students within the United States (Aguiar et al., 2015). 4 This study by Aguiar and colleagues, a conference paper in the field of computer science, makes several important contributions including construction of a “time to off-track” measure. The current study stands apart through its use of a statewide population sample, instead of a single school district, and through its use of multiple cohorts and more extensive longitudinal set of predictors.
A second contribution of this study is to extend the existing research exploring the long-term value of nonacademic (or “noncognitive”) skills to an approach more valuable for school administrators. Typically, educational research operationalizes learning or human capital development in terms of short-term gains in student test score achievement. A number of scholars in psychology, and more recently economics, have identified serious shortcomings of this approach (Kautz, Heckman, Diris, ter Weel, & Borghans, 2014). Therefore, to the greatest extent possible in administrative data, I consider predictors indicative of an individual’s interpersonal skills and/or indicative of the individual’s “intra-personal” abilities to set goals, exhibit curiosity, and manage his or her emotions and behavior. These measures include absences, disciplinary infractions, level of homework effort, and time spent reading for enjoyment. This approach exemplifies how school leaders can use indicators already incorporated in student records to track the behavioral development of students.
The third contribution of the article is to seek out macroeconomic sources of heterogeneity in high school graduation prediction. The primary cohort of students in this analysis, those in eighth grade during the 2007-2008 school year, entered high school just on the dawn of the Great Recession. Economic downturn and job loss varied significantly across North Carolina’s counties, with changes in the local unemployment rate between 45% and 178% (Action for Children North Carolina, 2011). I use this variation to explore whether individual patterns of dropout and graduation differed based on local economic conditions. One hypothesis would state that individuals in geographic areas hit hard by the recession would be less likely to drop out of high school because of the lowered chances of finding employment. In fact, the change in the incidence of unemployment between 2007 and 2009 for high school dropouts was 9.0 percentage points compared with 4.4 percentage points for high school graduates and 2.0 percentage points for 4-year college graduates (Sum & Khatiwada, 2010). A competing hypothesis would suggest that high school students would express greater preference to drop out in a local economic climate where the earnings returns to a high school degree are less certain.
To examine these patterns of high school dropout by local economic climate, I proxy for the degree of impact of the economic recession of 2008 through annual unemployment claims by county. I replicate the best-performing random forest algorithm in two different subsamples: (1) students in areas largely protected from recessionary job loss and (2) students in areas highly sensitive to recessionary job loss. I then compare both how accurately individual academic and behavioral indicators predict high school dropout, and whether certain indicators are more or less important contributing factors, in counties with unstable local economic conditions. In doing so, this analysis aims to investigate how school administrators can best identify and help students at risk of dropout across varying socioeconomic circumstances.
If technology companies can, with astonishing levels of accuracy, predict individuals’ shopping patterns, movie preferences, and Internet searches, why not apply such capabilities toward identifying students in dire need of educational or social assistance? The current study makes an initial attempt toward building these capabilities for education researchers and administrators.
Predictive Models in the Context of Data-Driven Decision Making
A growing body of research considers how educators can effectively use data collection and analysis to drive practice. This challenge applies at all levels of the public education system: to teachers (Datnow & Hubbard, 2015), to school principals and administrators (e.g., Halverson et al., 2007; Reeves & Burt, 2006; Shen et al., 2010), and to leaders in school districts and higher levels of government (e.g., Honig & Coburn, 2007). All of these efforts to collect, analyze, and translate data aim for what is called “data-driven decision making” (DDDM). Relevant to the current study are the following questions: (1) What are the steps required to move from data collection to evidence-informed educational leadership? (2) What are the current barriers (and possible policy solutions) to effective DDDM? (3) How do machine learning or big data methods fit into this existing framework? I also consider the particular risks and challenges associated with predictive dropout models in an era when most behavioral data collected focus on student deficits rather than on student strengths.
Marsh, Payne, and Hamilton (2006) outline a conceptual model of DDDM. Their model describes a distinct pathway from data, to information, to actionable knowledge, to types of decisions. Data, they claim, may come in the form of input data, process data, outcome data, or satisfaction data. Each component of this system holds a key to answering the overarching question of how data collection and analysis can feed into successful continuous improvement and holistic systems thinking (Bowers et al., 2014). Mandinach (2012) identifies two critical ingredients for DDDM: (1) technology tools and (2) human capacity and data literacy. One in operation without the other, she argues, cannot succeed.
Accountability standards under the No Child Left Behind Act and performance-based teacher evaluation emphasized under Race to the Top grants have accelerated data collection and reporting, particularly around student test score achievement. Efforts to collect and disseminate such data in order to meet state and federal requirements have generally outpaced efforts to analyze data and effectively inform day-to-day instruction and school administration (Murray, 2014). Translating summative evaluations of student data into formative evaluations would require, as Earl and Katz (2002) put it, moving “from accountability as surveillance to accountability as performance.” Ingram et al. (2004) identify barriers to DDDM even in schools rated highly for their continuous improvement efforts. These include mistrust of how data are used by school leaders, a lack of measurement that accurately reflects improvement, and a lack of teacher time available to perform data analysis and create additional paperwork. Wayman, Cho, Jimerson, and Spikes (2012) observe that certain negative principal leadership strategies and technical issues with computer data systems present obstacles for effective classroom use of data. Cho and Wayman (2014) recommend that central education offices not only provide teachers with technical assistance for computer data systems but also help teachers and principals better interpret and make sense of the data available to them.
Some of these lessons clearly apply to the case of predictive modeling, while others are less relevant. Nationwide, in the 2014-2015 school year about half of public schools implemented early warning systems for identifying students in danger of dropping out (U.S. Department of Education, 2016). Although a majority of schools collected data and considered more than one type of indicator to assess student risk, few used a systematic approach for determining indicator thresholds or characterizing level of risk (U.S. Department of Education, 2016). As noted by Bowers, Sprott, and Taff (2013), incorrect labeling of students could have negative consequences. If early warning systems fail to identify students who end up dropping out, those students are harmed. On the other hand, if early warning systems identify students as at risk of dropping out when the students are not truly at risk, this could both waste resources and potentially harm students who may feel unfairly stigmatized.
Furthermore, warning systems that rely either on administrator discretion or on methods that are not transparently communicated to students could reinforce stereotyping of students and/or educator practices that build on “deficit model” thinking. The deficit model in education posits that students who fail in school do so because of internal deficiencies (e.g., cognitive or motivational limitations) or shortcomings in a student’s family, neighborhood, or culture (Valencia, 2010). To the extent that predictive models of dropout risk depend on deficit-type measures such as student attendance, grade retention, and disciplinary infractions, there is a chance that administrators might use such systems to enforce punitive measures against students. Stearns and Glennie (2006) document that a large proportion of students, particularly those younger than 16 years, are “pushed out” of school through disciplinary systems rather than choosing to drop out. Lee and Burkam (2003) further note that school structure, school organization, and the nature of the relationship between educators and students within a school strongly predict likelihood of students’ dropping out.
The current study experiments with new forms of predictive dropout risk models with the aim of reducing misclassifications. Although machine learning and related approaches are taking off in different fields, from health care (Murdoch & Detsky, 2013; Raghupathi & Raghupathi, 2014) to climate change (Araújo & Rahbek, 2006), their use in the public education sector is still rare. Future research into how sophisticated algorithms could be implemented at scale, with appropriate training for school and district leaders, and without unintended consequences for students, will be essential.
Data
This study uses longitudinal student-level data from the NC DPI from the 2002-2003 school year to the 2013-2014 school year. It focuses on two specific cohorts of students: those finishing eighth grade in spring 2008, and those finishing eighth grade in spring 2009. Consistent with analytical conventions in data mining research, I allow the former cohort to act as a training data set for all algorithms, and I allow the latter cohort to serve as a testing data set. The training data set contains a total of 111,221 student observations, and the testing data set contains 109,464 student observations.
I match these students using their unique identification number to all dropout, graduation, and school exit records within the subsequent five academic years (corresponding hypothetically to Grades 9-13). This matching process allows us to accurately track students who continue through North Carolina public schools, but it fails to capture the outcomes of students who transfer to schools outside the state of North Carolina or who transfer to private schools or homeschooling. 5 Therefore, I may underestimate the total number of dropouts in greater quantity than the total number of graduates if there is meaningful negative attrition out of the sample. (And the opposite would be true in the case of positive selection out of the sample.)
As can be seen in Table 1, of the 111,419 eighth-grade students in North Carolina during the 2007-2008 school year, 72.3% graduate from high school within 5 years, 10.3% drop out within 5 years, and 17.4% exit the North Carolina Education Research Data Center sample through some other means. These ratios are comparable in the 2008-2009 eighth-grade “testing” cohort, with a slightly higher graduation rate (75.1%), similar dropout rate (9.7%), and lower missing rate (15.2%). The official 5-year cohort graduation rate published by North Carolina is 83.1% for entering ninth graders in 2008-2009 and 84.9% for entering ninth graders in 2009-2010 (NC DPI, 2014). Mechanically, it makes sense that these official graduation statistics would be higher with fewer “missing” students than those calculated within the analytical sample. Measuring graduation outcomes from eighth grade rather than ninth grade implies losing some portion of the student sample due to their exit from North Carolina public schools between middle school and high school.
High School Graduation and Dropout Statistics.

These issues of sample attrition notwithstanding, I exclude students who leave the sample prior to an observed graduation or dropout outcome and make inferences based on the remaining sample. Therefore, the prediction models performed for this study should hold greatest validity for students who remain in North Carolina public schools until graduation or drop out conditional on being in North Carolina public school in eighth grade. Table 2 presents a descriptive summary of students within each of the three relevant categories: high school graduates, high school dropouts, and unobserved. Across several dimensions, students who graduate from high school come from more advantaged backgrounds than those who do not graduate: They are less likely to be eligible for free or reduced lunch and less likely to be a racial minority. Unsurprisingly, high school graduates also tend to possess stronger test score and attendance histories than dropouts. The category of students who I observe as neither officially dropping out nor graduating from North Carolina public schools exhibit early indicators somewhere between those of graduates and dropouts (in terms of demographic, academic, and behavioral advantages).
Description of Demographic, Academic, and Behavioral Predictors (by Group).

Note. std = standardized.
The variables listed in Table 2 for group comparison purposes also serve as the set of predictor variables included for application of statistical learning algorithms. This group includes a total of 74 predictors collected from Grades 3 through 8 of the student’s schooling history: 22 demographic and family background indicators, 24 academic indicators, and 28 behavioral indicators. The demographic and family background indicators include gender, race/ethnicity, 6 age (Grade 8), free/reduced lunch eligibility (Grades 3-6), exceptional status (Grades 3-8), and parental education. The academic indicators include gifted in math status (Grades 3-8), gifted in reading status (Grades 3-8), standardized math scores (Grades 3-8), and standardized reading scores (Grades 3-8). 7 And finally, the behavioral indicators include absences (Grades 4-8); serious disciplinary infractions (Grades 3-8), 8 time spent using electronics (Grades 3-8), time spent reading for enjoyment (Grades 3-8), and time spent doing homework (Grades 3-8). The last three measures on time use come from self-reported surveys included in the annual end-of-grade standardized tests. 9
This study has no need to selectively include and exclude certain predictor measures, because most machine learning algorithms incorporate explicit variable selection methods into their process. These processes—when working well—can distinguish between essential and nonessential predictor measures and use only the salient information. I also intentionally categorized measures into the three primary domains: personal background, academic achievement, and “noncognitive” behaviors. Of the personal background factors, prior research has concluded that a student’s age—in particular, being old-for-grade—has a strong association with high school dropout. This reflects both the higher propensity to drop out for students retained one or more grade levels and also other social and psychological mechanisms through which old-for-grade students prefer to leave school earlier. Cook and Kang (2016) demonstrate this relation causally by comparing students just before the birth date cutoff in kindergarten and those just after. Some of the other background variables such as free or reduced lunch eligibility and parental education have been found in prior research to correlate highly with educational attainment (Breen & Jonsson, 2005), but may play a reduced role once I include other academic and behavioral indicators.
Method
This study employs several types of predictive models to compare the effectiveness of each approach toward generating accurate predictions of high school graduation and dropout. I organize these empirical approaches into three primary categories: logistic regression, tree-based classification, and SVMs. The term classification refers here to the fact that the outcome variable is a dichotomous indicator. Therefore, a prediction problem is defined as a classification problem if the purpose is to determine whether the individual will eventually belong to one outcome class (“high school dropout”) or another class (“high school graduate”). The machine learning algorithms included in this study, such as random forests and SVMs, are known to perform better for simple classification problems than for predicting continuous outcome measures. Therefore, such methods should be well suited for the student dropout prediction problem.
Prior research in this area can help shape hypotheses of how statistical learning algorithms would perform in comparison with linear probability or logistic regression methods. Simulation-based studies have shown that under very specific circumstances, logistic regression can actually have misclassification rates lower than those of SVM classifiers, but that SVM classifiers have lower misclassification rates in multivariate, mixed-distribution data sets (Salazar, Velez, & Salazar, 2012). One study of unbalanced meteorological data demonstrated that simple logistic regression can generate surprisingly comparable results to the supervised classification method of random forests (Ruiz-Gazen & Villa, 2008). In general, as one shifts from traditional linear regression to more flexible, nonparametric algorithms based on cross-validation accuracy, one confronts a direct tradeoff between the ease of interpretation of results and the power of pure prediction.
Linear Probability and Logistic Regression
The linear probability and logistic regression methods mirror those used in prior research (Allensworth, 2005; Neild & Balfanz, 2006). For the linear probability model, I estimate ordinary least squares with a high school dropout indicator

The coefficients
The logistic regression model alternatively assumes that the dropout outcome

To estimate such an equation, I maximize the joint likelihood of n independent binomial observations, which is defined as the product of their individual densities. The associated log-likelihood function is thus

For the logistic analysis, I present all results in terms of odds ratios. To minimize the possibility of overfitting the data, I also perform logistic regression using a backward stepwise selection procedure based on the Akaike Information Criterion (AIC), which results in only including variables that affect the outcome with a p value of less than .1. 11
Tree-Based Classification
The decision tree represents one of the machine learning field’s most fundamental and popular classification techniques (Breiman, Friedman, Olshen, & Stone, 1984; Loh, 2014). These types of algorithms first partition the “predictor space” into a number of simple regions and then determine the mode outcome value for each region. For example, you could imagine the algorithm may partition the student training data set from this study into students with greater than 10 absences per year and students with fewer than 10 absences per year. Of the students with greater than 10 absences per year, it could then further partition that set into those with math test scores greater than 0.5 standard deviations above the mean and those with math test scores less than 0.5 standard deviations above the mean. The algorithm would then calculate the mode graduation outcome for each subset of the predictor space (or “terminal node”), and use these simple partition or tree branch rules to predict outcomes for all students in the testing cohort.
To construct an optimal decision tree, the goal is to find predictor partition regions

where
To prune decision trees, one can alter slightly the RSS-minimization goal to impose a cost for tree complexity, thus minimizing the risk of overfitting the data. The minimization problem becomes

For each value
Unfortunately, a single decision tree does not typically perform well in comparison with other methods in terms of prediction accuracy. However, when one uses methods that aggregate a large number of trees—such as “bagging,” “random forest,” or “boosting”—one can improve the prediction accuracy of decision trees dramatically (Strobl, Malley, & Tutz, 2009). I will not go into the intricate details of each of these methods but rather explain the improvement principle behind each. 12
Bagging uses bootstrapping to average across a number of repeated samples from the training data set. I can formally represent this process as the following, where

Random forest algorithms operate very similarly to bagging processes in the sense that they average over a large number of decision trees formed from bootstrapped samples. However, with bagging, each time a tree split occurs the algorithm considers the entire set of predictor variables, and in random forests, the algorithm only considers a random subset of
Finally, “boosting” of classification trees works in a similar manner to bagging, except that trees are grown sequentially, each using information from previously estimated trees. The repeated process iterates as follows for
Fit a tree
Update

Update the residuals:

After I repeat this process for each bootstrapped sample, the final boosted model averages across all trees:

Performing boosting requires making a priori decisions about the depth of each tree and the shrinkage parameter
Support Vector Machines
Computer scientists developed SVM approaches in the 1990s to solve complex classification problems (Boser, Guyon, & Vapnik, 1992; Cortes & Vapnik, 1995)—That is, to predict with high levels of certainty the likelihood of observations belonging to a certain “class” or achieving a certain outcome. SVMs are unique in how flexibly they can classify observations based on the predictor space. The underlying technique constructs a separable hyperplane in the predictor space that separates observations into two outcome classes while minimizing classification error. The “maximal margin classifier,” which classifies observations based on a strict separable hyperplane solves the following maximization problem:
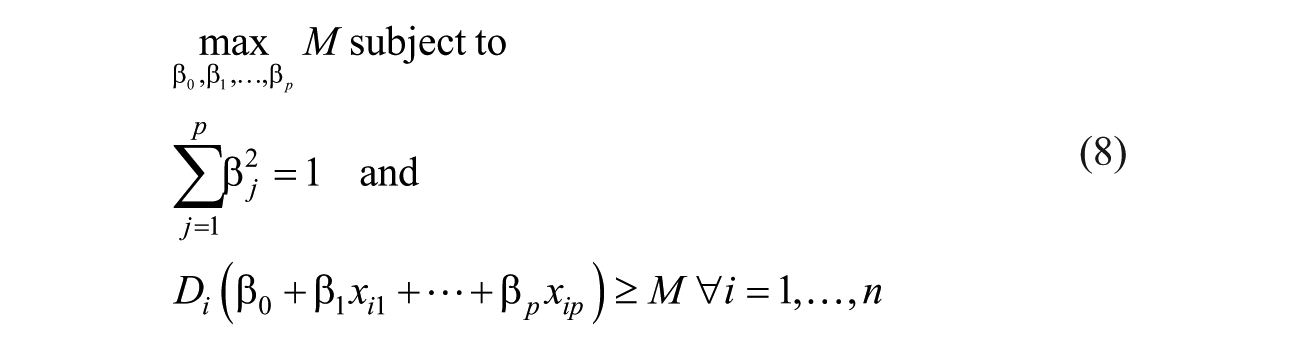
In these equations, M represents the margin between the separable hyperplane and the observations closest to it and
However, with most data it is impossible to perfectly separate all observations into two outcome classes with a single hyperplane in a high-dimensional space. In the case of this analysis, the high school dropout predictor data set spans 74 dimensions that cannot be perfectly separated into the two outcome classes. Therefore, a “support vector classifier” or “soft margin classifier” instead imposes a cost for observations placed into an incorrect classification but allows observations to appear on either side of the hyperplane. The maximization problem under these looser assumptions (where C is a nonnegative tuning parameter and

A common approach for estimating these classification algorithms is to use a kernel-based approach for quantifying the similarity of two observations. To allow nonlinearity and additional flexibility in the boundary between classes, the current study uses a radial kernel for training points

I experiment with different levels of the cost parameter, which determines how costly it is for an observation in the training data set to be misclassified, and also with different levels of the gamma parameter
Finally, I use the estimated SVM boundary from the training data set of students to predict dropout and graduation outcomes for the testing data set of students. For SVM approaches and each other method described in this section, I estimate the true positive rate (TPR), false positive rate (FPR), and total prediction accuracy (TPA) in the training data set to compare efficacy across methods. The TPR represents the fraction of high school dropouts that are correctly identified, and the FPR represents the fraction of high school graduates that are incorrectly identified as dropouts. TPA simply equals the number of correct predictions divided by the total number of predictions.
Results
From the statistical analyses described above, I generate three types of findings. First, I illustrate which algorithms (with which parameter values) most accurately predict student high school graduation and dropout in the testing data set. Second, the findings indicate which student metrics have the greatest importance within a predictive model. And third, I examine heterogeneities in the pathways toward dropout or graduation in different local economic climates.
Figure 1 presents the aggregate 5-year cohort graduation rate in North Carolina over the past several years. Overall, between the cohort of ninth graders in 2003 (graduating by 2007) and the cohort of ninth graders in 2011 (graduating by 2015), the 5-year graduation rate has increased from 70% to more than 85%. These improvements in graduation rates were not accidental—the state of North Carolina has made substantive efforts to prevent dropout through their Race to the Top initiative, as well as in response to Governor Bev Perdue’s “Career & College: Ready, Set Go! Every Child a Graduate” education agenda. During this same time period the White–Black graduation rate gap decreased from 11.5% to 5.1%. The graduation rate gap between Asian students, the highest performing group, and Hispanic students, the lowest performing group, also shrunk from 21.6% to 2.1%. Despite these improvements, there remain meaningful disparities by gender (Figure 1) and by race and ethnicity (Figure 2).
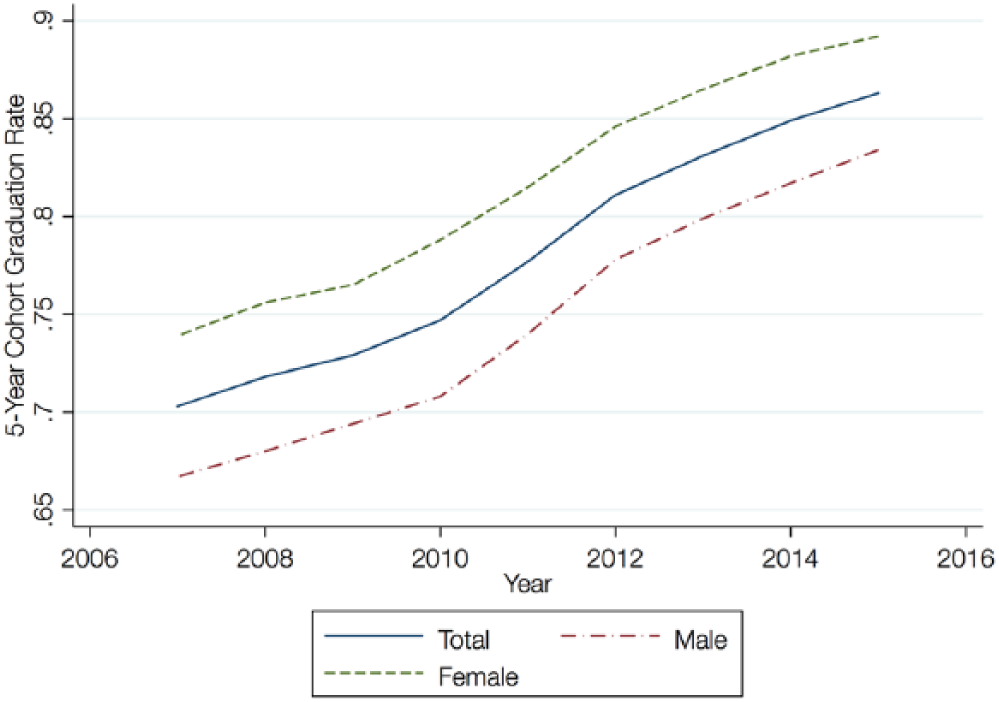
Five-year cohort graduation rate in North Carolina (by gender).

Five-year cohort graduation rate in North Carolina (by race/ethnicity).
In the training data sample used by this study, 17.4% of students leave the North Carolina public school sample before I can observe their graduation or dropout status. Of those who remain in the sample, 87.5% graduate from high school within 5 years and 12.5% drop out within 5 years (see Table 1). Although I cannot state definitively that the final sample represents the total eighth-grade student cohort in terms of educational attainment, the sample is representative of all students who remain in North Carolina public schools throughout their high school career (however long). Table 2 compares descriptive statistics of all academic, behavioral, and background indicators for the graduation, dropout, and missing (or transfer) subgroups.
When testing educational outcome prediction validity, I repeat the same process for each algorithm and regression method. First, I estimate each classification model using the training cohort data set, with an indicator for high school dropout as the outcome variable of interest and the 74 student measures listed in Table 2 as predictors. Next, I use each estimated classification model in turn to predict dropout, or alternately graduation, for each observation in the testing cohort data set. Comparing the model predictions to actual educational outcomes in the testing cohort, I compute three test statistics: TPR, FPR, and TPA. The TPR represents the fraction of high school dropouts that are correctly identified, and the FPR represents the fraction of high school graduates that are incorrectly identified as dropouts. TPA simply equals the number of correct predictions divided by the total number of predictions.
Table 3 compares these prediction statistics for each of the traditional regression and machine learning algorithms. Beginning with logistic regression, I find that a logistic model with all predictor variables correctly predicts 86.7% of observations in the testing cohort a year later. If I use backward hierarchical stepwise variable selection with logistic regression (with a selection cutoff of p = .1), the TPA declines marginally to 86.6%. The TPR for stepwise selection is higher at 39.7% versus 35.7%, but the FPR is also higher at 8.4% versus 7.6%. Linear probability models have similar TPA, but lower TPR and FPRs.
Comparison of Methods.

Note. For each method listed above, the training data set contains the entire cohort of students in eighth grade in North Carolina public schools during the 2007-2008 school year; the testing data set contains the entire cohort of students in eighth grade in the 2008-2009 school year. A “true positive” indicates that the algorithm predicted a dropout decision and the student did ultimately drop out; a “false positive” indicates that the algorithm predicted a dropout decision and the student did not ultimately drop out.
Table 4 presents full results from the logistic regression with odds ratios for each predictor variable. Although these results are only descriptive, they nonetheless hold interesting insights. 13 For example, in the behavioral category, having a serious disciplinary incident in eighth grade is associated with an 88.8% increase in likelihood of dropout, all other factors held constant. Each additional day absent per year in eighth grade is associated with a 3.2% increase in the likelihood of dropout. So, moving from 10 absences to 20 absences would result in a 32% increase. Academic achievement also strongly predicts high school dropout, as expected. A 1 standard deviation increase in math performance in eighth grade is associated with a 34.6% decline in likelihood of dropout. Reading scores have a smaller coefficient (corresponding to a 10.5% decline). Interestingly, early academic and behavioral measures from Grades 3 through 7 each have unique predictive power even when eighth-grade measures are included in the model: Late indicators matter most, but the entire educational trajectory is important. With all of the academic and behavioral measures in the model, student race, gender, exceptionality status, free/reduced lunch eligibility, limited English proficiency, and parental education levels do not stand out comparatively as particularly salient.
Full Results From Logistic Regression: Predicting High School Dropout in Training Cohort.

Note. std = standardized.
p < .1. *p < .05. **p < .01.
Next, I estimate a single decision tree model. Figure 3a illustrates the decision splits for the estimated classification tree with six terminal nodes, and Figure 3b illustrates the decision splits for a classification tree with 12 terminal nodes. In each of the machine learning models, I rescale all variables such that the minimum value equals zero and the maximum value equals one. Therefore, in Figure 3a, the decision tree split for student age in months (eighth grade) is at approximately the median value, and the three eighth-grade absences splits are closer to the lower end of the absence distribution. In both the smaller and the larger tree, certain measures stick out as potentially important predictors of high school dropout. However, I will consider the question of variable importance more formally using other statistics. A single decision tree (both with and without pruning) predicts high school dropout correctly 88.1% of the time, with a 33.0% TPR and 4.7% FPR (see Table 3). 14

Classification tree for high school dropout prediction: (a) excluding missing observations, 6 terminal nodes and (b) including missing observations, 12 terminal nodes.
Moving on to various approaches for aggregating large numbers of decision trees, I perform bagging with 500 trees, which involves averaging these trees across 500 bootstrapped samples of the training data set. Interestingly, this approach appears to perform worse than a single decision tree with a TPA of 86.2%. It has the highest TPR of all methods of 63.3%, but also the highest FPR of 10.8%. This represents, therefore, an inclusive identification method—many more students would receive dropout prevention support—both those who need it and those who don’t.
Using random forests, which intentionally and randomly limit the predictor space for each tree split, improves algorithm reliability with TPA of 89.1% with 100 trees and 89.2% with 500 trees. The TPR hovers between 50% and 54% depending on the number of trees, and the FPR between 5% and 6%. A boosting analysis, which again allows each tree constructed to build off of information from prior trees, generates the most robust predictions of the decision tree processes. With a small shrinkage parameter of 0.01, boosting accurately predicts high school dropout and graduation for 90.7% of observations with both a low TPR of 29.6% and low FPR of 1.1%. Boosting results do not appear particularly sensitive to the “depth” of the classification trees.
Given the lack of an experimental identification strategy, I cannot speak to the “effects” of various early predictor measures on likelihood of high school graduation or dropout. Nor do classification tree processes even generate effect sizes such as those that result from linear regression analysis. I can, however, determine the relative importance of each measure for the predictive validity of the overall model. Figure 4 plots the mean decrease in accuracy and the mean decrease in the Gini index from removing any specific variable from the model, for the thirty most “important” variables. In this context, the Gini index, also called “node purity,” measures the variance of the dropout outcome indicator for a single terminal node of the tree. Across both measures of importance, math scores in eighth grade, student age-for-grade, absences in seventh and eighth grade, reading scores across several grades, and disciplinary infractions in eighth grade, all greatly improve model prediction accuracy. Although this plot only reflects the decision trees algorithm with bagging, variable importance is highly consistent across different tree-based methods.
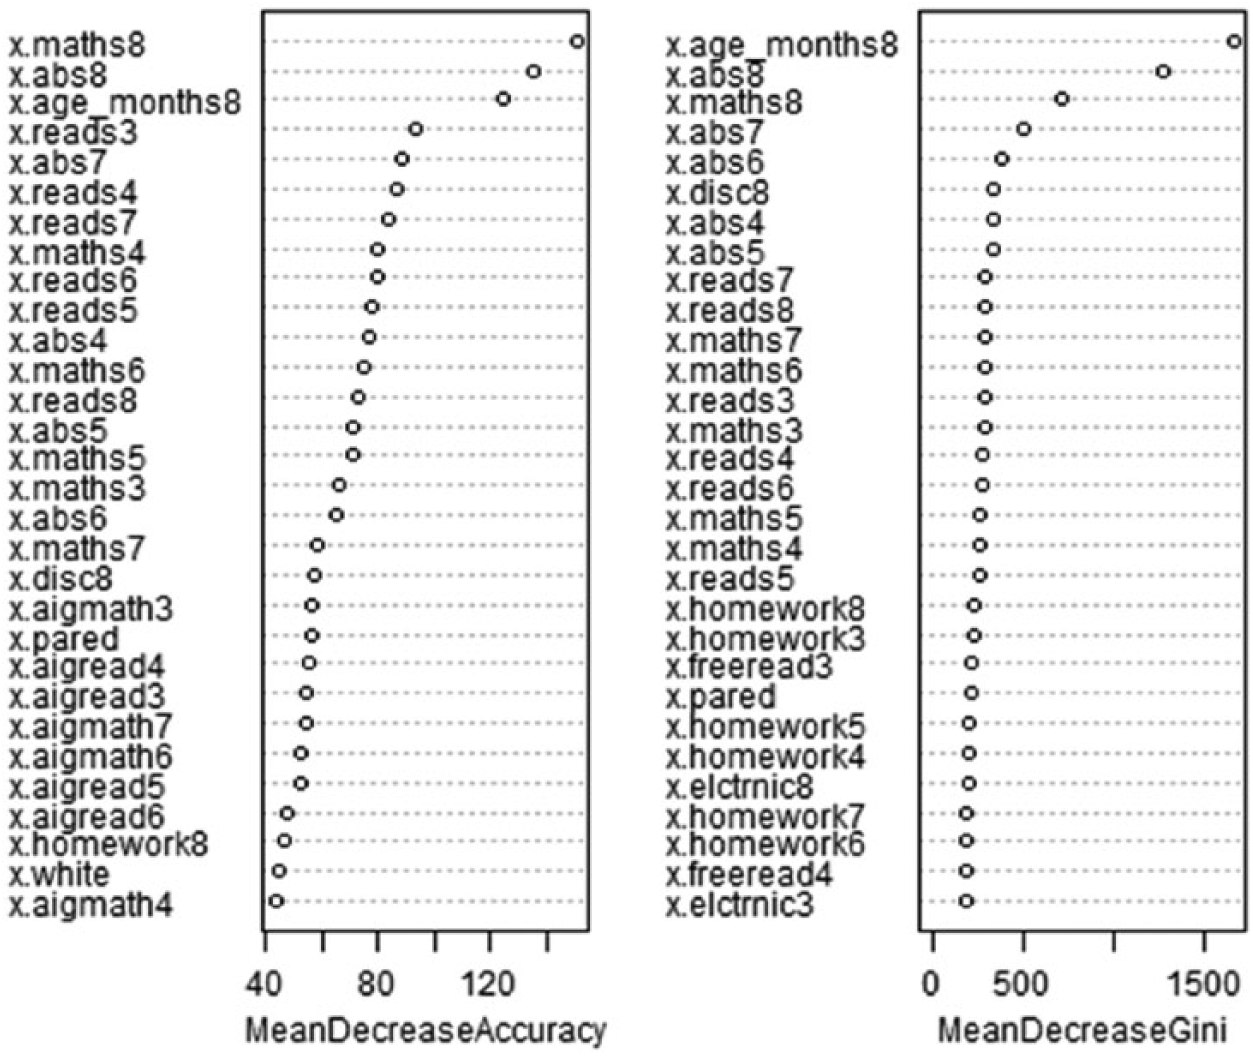
Importance plot of academic, behavioral, and demographic predictors: Classification trees with bagging (1,000 trees).
Finally, I perform SVM classification with the training data set to obtain a more parametrically flexible model of high school graduation and dropout. To optimize the classification process, I experiment with several parameter values for gamma (
As a simplified illustration of the method, Figure 5 provides a radial classification plot of high school dropout relying on only two of the predictor variables: eighth-grade math score and eighth-grade absences. In this graph, the blue shaded region (with generally high absences and low math scores) represents observations that would be classified as likely dropouts; the red shaded region as likely graduates; and plotted triangles and circles mark the actual graduates and dropouts. The SVM classification from those two variables alone, while flexible and generally effective, misclassifies a sizeable number of students.
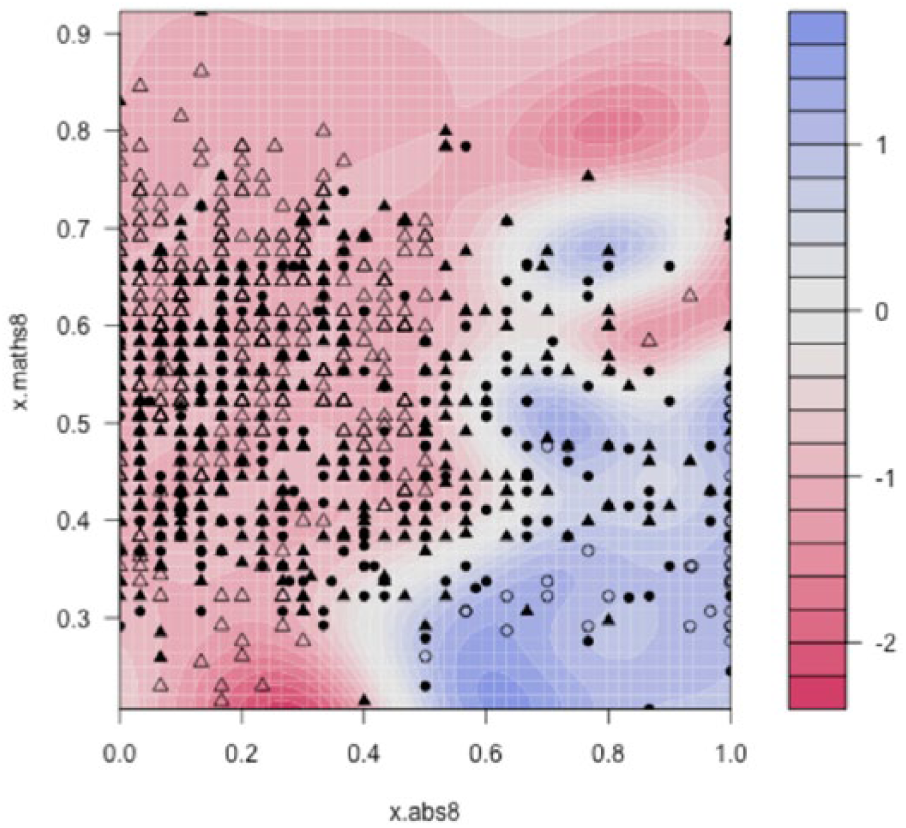
Support vector machine (SVM) radial classification plot of high school dropout from eighth grade math scores and absences.
Across the entire set of prediction strategies, random forest algorithms make tremendous improvements in correctly identifying students at risk of high school dropout (63.3% TPR with bagging and 61.4% TPR with boosting as compared with 13.8% for linear probability). However, I only uncover a moderate degree of variance in TPA among all of the different methods. The TPA improvements between traditional logistic regression with a large set of covariates and more complex random forest, boosting, and SVM algorithms are modest, in the range of a 4 to 5 percentage points increase in prediction accuracy. This could reflect one of several contributing factors. For one, the validity of many of these statistical learning algorithms depends on minor elements such as parameter choice and number of iterations. Further experimentation could ensure that these models use the optimal tuning parameters for explaining student variation. This possibility aside, the current study appears to confirm earlier empirical evidence that logistic regression fares comparably to machine learning methods for particular types of classification problems (Ruiz-Gazen & Villa, 2008; Salazar et al., 2012).
One potential explanation for inconsistencies in prediction validity may come from differences between the 2008 cohort of students (training sample) and the 2009 cohort of students (testing sample). This scenario is especially plausible given the timing of the economic recession and its likely effects on schooling decisions. In the next section, I provide a brief summary of how dropout trends and individual educational trajectories may have shifted in response to the recession and local experiences of job loss.
Dropout in an Economic Recession
In North Carolina, the economic impact of the Great Recession of 2008 varied strikingly across geographic regions (Action for Children North Carolina, 2011). Figure 6 maps the percentage point increase in the unemployment rate for each of North Carolina’s 100 counties from 2007 to 2010 (Bureau of Labor Statistics, 2015). Overall, the state experienced a large uptick its unemployment rate, from a county average of 5.1% in 2007 to a county average of 11.7% in 2010. As one can observe in Figure 6, job losses from the recession were not evenly distributed across the state and hit rural counties in the western mountainous part of the state especially hard.
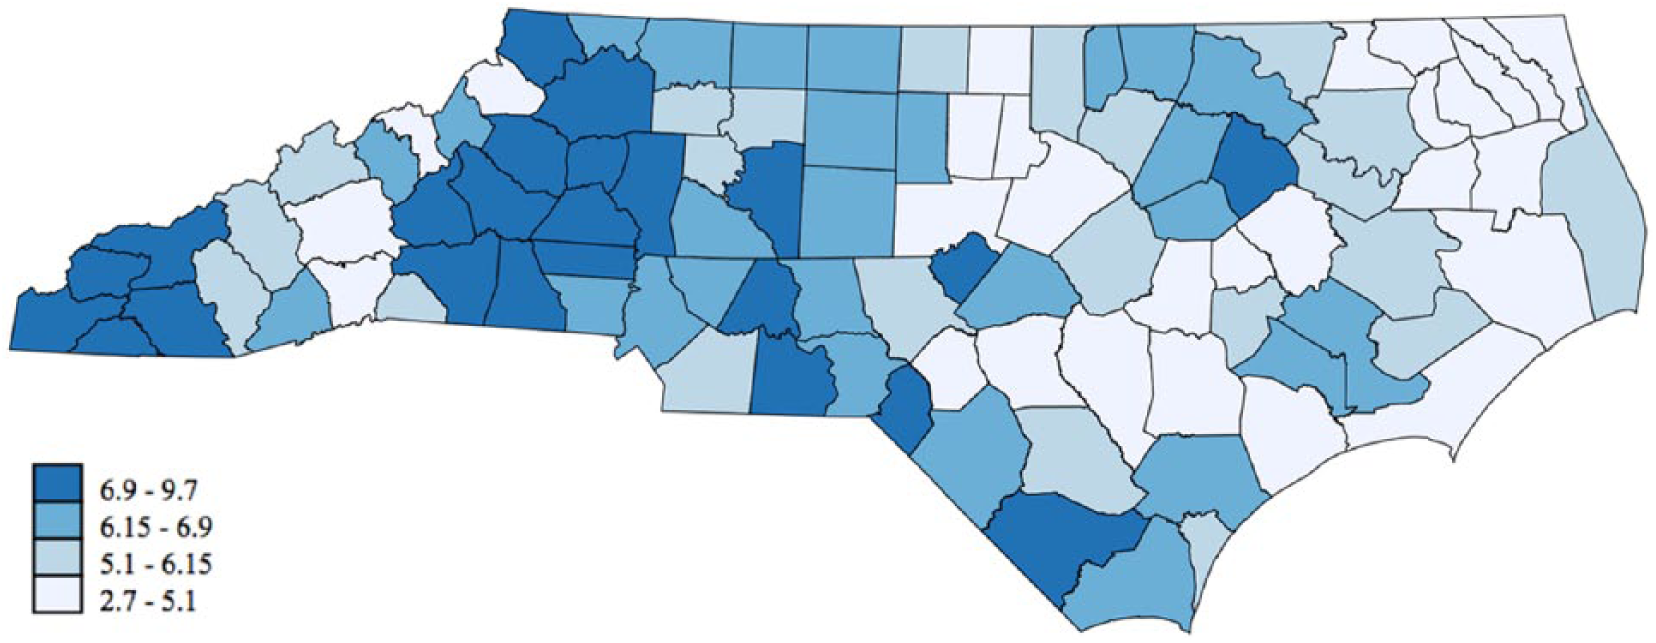
North Carolina change in unemployment rates across the economic recession period (by county).
To tease out how individual high school dropout and graduation patterns play out differently during strained economic climates, I can use this geographical variation in recessionary impact. Two contradicting hypotheses have emerged regarding counties hit hardest by the economic recession. On the one hand, students may stay in school longer if they perceive that local job prospects are few and they may face steep competition for low-skill jobs (Sum & Khatiwada, 2010). On the other hand, students may drop out at greater frequency if they expect that a diploma would not accrue any substantial benefits for earnings in the local labor market (Kahn, 2010), or if they need to enter the labor force immediately to reduce household financial stress. Figure 7 plots the 5-year cohort graduation rate between 2007 and 2015 for counties with below-median increases in unemployment and those with above-median increases in unemployment during the recession. In 2007, the graduation rates of eventual high-job-loss counties trailed behind those of eventual low-job-loss counties. But in the past 8 years one can see that gap has closed completely, ostensibly due to increased motivation for students to graduate from high school in communities with struggling local labor markets.
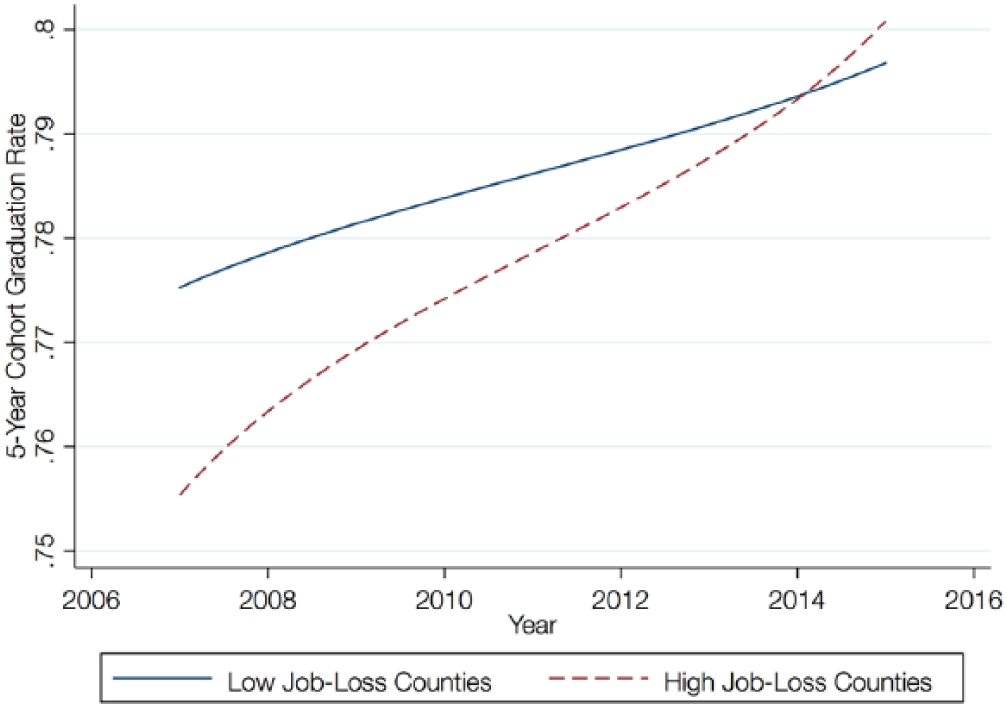
The 5-year cohort graduation rate of counties by change in unemployment rate 2007-2010 (local polynomial smoothed fit).
In Table 5, I replicate the logistic regression analysis of individual predictors of high school dropout, separating the training data sample this time into high-job-loss and low-job-loss counties. Columns 2 and 3 present odds ratio estimates for each background, academic, and behavioral indicator. Column 3 provides the p value of a test of the equality of regression coefficients across the two samples. Apparently, significant differences in predictive impacts appear for gender, race/ethnicity, age in months, gifted status in math in fourth grade, reading score in third grade, electronics use in fifth grade, reading for enjoyment in fourth grade, and homework effort in fourth grade. However, once I correct for multiple hypothesis testing using Bonferroni’s method in Column 4, very few statistically significant differences remain.
Predicting High School Dropout in Areas Heavily Affected and Less Affected by the Great Recession.

Note. std = standardized. Columns 2 and 3 present coefficients as odds ratios for the association with likelihood of high school dropout. The “large change in unemployment” column includes counties that experienced greater than a 6.2 percentage point rise in the unemployment rate between 2007 and 2010. The “small change in unemployment” column includes counties that experienced less than a 6.2 percentage point rise during the same period. The unadjusted p value column tests the equality of each coefficient across samples, and the adjusted p-value column uses Bonferroni’s method for adjusting multiple hypothesis tests.
p < .1. *p < .05. **p < .01.
Even after adjusting for multiple hypothesis testing, males are 23.7 percentage points more likely to drop out of high school in counties with small changes in unemployment than in those with large job losses. This could reflect the well-known fact that men fared significantly worse than women during the economic recession (Sahin, Song, & Hobijn, 2010). In Western North Carolina, many of the recessionary job losses occurred in the manufacturing sector. Although counties heavily affected by the recession fared poorly in the short term, the educational attainment of their male labor force increased rapidly, which could potentially spur growth in those areas. Closer attention to the relation between local economic factors and schooling attainment could help education administrators and policy makers to increase graduation rates in those difficult-to-reach regions.
Limitations
This study contains several limitations. First, as mentioned in the data section, 17.4% of the eighth-grade training sample leave North Carolina public schools before I can observe their graduation or dropout status. Presumably, these students are moving outside the state, or to private schools or homeschooling, but I am unable to observe their reasons for leaving the sample. Thus, the analysis should be seen as generalizable to the population of students who remain in the public school system in their state either until dropping out or until graduation.
It is also essential to note that the “training” cohort of students who enter high school in the fall of 2008 are inherently different from the “testing” cohort of students who enter high school in the fall of 2009. Differences may arise due to cohort effects, timing of the economic recession, and state and district policy efforts at reducing dropout rates. This phenomenon likely reduces the accuracy of the predictive models included in this study.
Finally, this study is constrained by the administrative data available for driving prediction models. Although North Carolina’s longitudinal school data are comparatively quite rich, ultimately the indicators provided, such as absences, grade retention, and test score achievement, paint an incomplete picture of how students are functioning within and outside of schools. While large data sets may seem intimidating at first for informing decision making, “big data” methods thrive on multidimensional measurement. The more that schools know about students’ strengths and assets in different areas, the better such algorithms will work and the better schools can serve their students.
Discussion
This study does not evaluate or advocate any one specific policy action for raising the high school graduation rate. It does, however, illustrate that administrators and researchers can use machine learning algorithms to glean formerly “invisible” information about students and to greatly augment existing understandings of educational trajectories. In a broad comparison of traditional regression and machine learning methods, I find that SVM classifiers most accurately predict high school dropout or graduation based on early academic, behavioral, and background indicators, closely followed by classification trees with boosting. These findings imply dynamic, nonlinear, interactional connections between students’ early development and their eventual schooling attainment. Both noncognitive behaviors and academic successes or failures matter for predicting students’ ultimate educational trajectories. Family background and demographic characteristics, on the other hand, appear less salient once I include a large set of other individual traits and behaviors in the model.
Bowers, Sprott, and Taff (2013) provide the ideal template for comparing these findings to existing research on predicting school dropout. The authors generate a meta-analysis of prior work by comparing for 110 dropout indicators across 36 studies: sample size, dropout rate, precision (positive predictive value), sensitivity (true-positive proportion), specificity (true-negative proportion), and false-positive proportion (one minus specificity). They find high variability in these values, as the studies use different grade levels and take place in different contexts. Based on these metrics, the algorithms in the current study outperformed those that used data from similar grade levels (eighth grade or below) and even some of those that used high school level data. Their framework holds promise for continually revisiting this question of how to know when predictive modelling systems are working well.
This study also explores patterns in educational decision making during an economic recession, taking advantage of geographical variation in the extent of job loss in North Carolina. Although young men suffered worse during the recession in terms of labor market outcomes, I find that local economic downturn propelled them to graduate from high school at a much higher rate than previously observed. Future research could examine the long-term social and economic effects of such an educational shift, which are likely to be significant. My findings suggest that school and district leaders should be acutely aware of concurrent local job market shocks and outside employment options for students as they consider avenues for preventing dropout.
Using machine learning algorithms to predict high school dropout risk has the potential either to ameliorate some of the problems with existing predictive models, or to possibly exacerbate them. The devil lies in the details. To the extent that these algorithms improve prediction accuracy, they should reduce the financial and psychological costs associated with misidentifying students. However, such methods also tend to be less transparent and more technologically demanding. Updating existing early warning indicator systems to incorporate statistical learning approaches will likely require investments in technological software and/or partnering with external technical organizations. Prior research has shown that building partnerships with organizations whose mission is to support data use can provide means of interpreting information that is sensitive to local needs (Coburn, Honig, & Stein, 2009).
The quality of data underlying student risk prediction systems will ultimately determine those systems’ success or failure. Predictor measures included in this analysis—though relatively comprehensive for an administrative data set—still provide a limited view of the full landscape of relevant student capabilities. Mckown (2017) acknowledges that assessment of social and emotional capabilities has lagged far behind education policy and practice. He encourages the widespread development and adoption of age-appropriate measures of student thinking, behavior, and self-control, that could aid educators and administrators toward improved formative and summative evaluation.
With ever-increasing quantities of micro-level educational data and widespread availability of vast computational resources, this study demonstrates how to use data science methods to complement other forms of education administration research. Machine learning algorithms offer great promise both for increasing our understanding of educational processes and for providing powerful prediction systems for school leaders and policy makers. However, much work remains to be done to improve the prediction accuracy across years, policy contexts, and geographic regions. If policy makers choose to use and refine these methods to identify students at risk of dropping out, school administrators could fashion targeted, intensive interventions with greater effectiveness and lower cost.
Supplemental Material
DS_10.1177_0013161X18799439 – Supplemental material for “Big Data” in Educational Administration: An Application for Predicting School Dropout Risk
Supplemental material, DS_10.1177_0013161X18799439 for “Big Data” in Educational Administration: An Application for Predicting School Dropout Risk by Lucy C. Sorensen in Educational Administration Quarterly
Footnotes
Acknowledgements
The author thanks Kenneth Dodge, Philip Cook, Helen Ladd, and Philip Gigliotti for their feedback and contributions.
Declaration of Conflicting Interests
The author declared no potential conflicts of interest with respect to the research, authorship, and/or publication of this article.
Funding
The author disclosed receipt of the following financial support for the research, authorship, and/or publication of this article: This research was supported by the Nelson A. Rockefeller Institute of Government.
Notes
Supplemental Material
The Appendices are available in the online version of the journal.

Author Biography
References
Supplementary Material
Please find the following supplemental material available below.
For Open Access articles published under a Creative Commons License, all supplemental material carries the same license as the article it is associated with.
For non-Open Access articles published, all supplemental material carries a non-exclusive license, and permission requests for re-use of supplemental material or any part of supplemental material shall be sent directly to the copyright owner as specified in the copyright notice associated with the article.
