
Abstract
Issues with correlation attenuation due to measurement error are well documented. More than a century ago, Spearman proposed a correction for attenuation. However, this correction has seen very little use since it can potentially inflate the true correlation beyond one. In addition, very little confidence interval (CI) research has been done for correction for attenuation. In the present study, the authors propose a bootstrap procedure for estimating the deattenuated correlation and corresponding CIs. The authors use Monte Carlo simulations to generate data under certain conditions and assess the performance of the bootstrapped deattenuated correlation. The authors investigate for bias and 95% CI coverage. Results indicate that the bootstrap deattenuated correlation provided adequate percentile CI coverage in all but three conditions. The bias-corrected and accelerated CI, however, provided adequate coverage under all simulation conditions.
Social/behavioral research ranges in scope and specificity, but it shares an underlying characteristic: In one way or another, researchers must work with variables measured with error. Such variables come in the form of unobservable variables such as anxiety, depression, IQ, and so on, which cannot be directly measured. Thus, each of these variables must be indirectly measured through items at which point measurement error is introduced. These types of variables are typically known as factors or latent variables. Furthermore, working with these variables frequently involves estimating relationships between them. The fundamental statistic for estimating relationships between continuous variables is the Pearson product–moment correlation coefficient (or correlation coefficient). In fact, it is the driving force behind general linear models (GLMs; e.g., regression, analysis of variance [ANOVA]) and is a benchmark measure of effect size. In general, researchers desire a strong correlation because it is a clear demonstration of a relationship. However, all statistical models assume that the variables in the model are measured without error, and none are robust to this assumption. As such, the correlation is not immune to this assumption and the issues it creates can propagate to other methodologies that are based on the correlation. Although the impact of measurement error on the correlation has been known for more than a century, to date very little work has been done to address and minimize its impact. In light of this we propose a bootstrap methodology with accompanying confidence intervals (CIs) as a viable solution to address the effect of measurement error on the correlation and investigate its properties under several simulation conditions.
General Overview
Researchers in the social/behavioral sciences are often unable to find strong empirical support for theories that otherwise appear plausible (Buckley, Cote, & Comstock, 1990). Failure to find empirical support may be explained from a theoretical view. Specifically, the model may not account for all factors influencing the variability on the outcome of interest. Other researchers propose that method effects and measurement error are more plausible explanations for discrepancies across research studies (Buckley et al., 1990; Kassarjian, 1971; Lance, Dawson, Birkelbach, & Hoffman, 2010). These researchers emphasize a relationship between poor validity of a measure that may be due to method effects (Fiske, 1987), and measurement error that is rarely accounted for in the literature (Schmidt & Hunter, 1996). For example, a measure may be developed for a specific population but is then used with a general population resulting in poor correlation among variables (Buckley et al., 1990; Kassarjian, 1971). Such studies generally conclude a poor relationship between variables instead of investigating the validity of the measure with the population investigated and/or correcting for measurement error.
Unfortunately, measurement error can cause a number of serious problems in statistical models all of which lead to inaccurate inferences or conclusions. For example, when the ubiquitous correlation coefficient is calculated, measurement error in either variable will attenuate the correlation, making the relationship appear weaker than it would be without measurement error (Allen & Yen, 1979; Carroll, Ruppert, Stefanski, & Crainiceanu, 2006). In regression models, measurement error in the independent variables can result in coefficients that are smaller, larger, or even have a different sign than the coefficients that would occur if there were no measurement error. See Hobfoll, Shoham, and Ritter (1991) and Thomas and Williams (1991) for examples. In addition, measurement error in the dependent variable can increase the residual variance, reduce power, and decrease R2 (Carroll et al., 2006).
The central statistic to GLMs is the correlation coefficient. When interest is in estimating relationships between predictor(s) and a criterion, a regression model is estimated. When interest is in the effect of an independent variable on the dependent variable, an ANOVA model is estimated. Each of these models is a form of the GLM, and an underlying correlation between the variables is assumed in each case. As such, not only does the correlation determine the magnitude of the GLM parameter estimates, it can also drive a researcher’s decision on what variables to include in the model. As previously noted, however, measurement error in the variables negatively affects GLM parameter estimates and corresponding inferences.
An inaccurate correlation coefficient with corresponding CIs can also affect research that synthesizes other research findings such as a meta-analysis. In this type of analysis, the correlation coefficient is a benchmark measure of the effect size and is used as a data point. Even if the correlation for every study is based on a reliability of .90 for the variables, it still indicates that 10% of the variance is due to measurement error. When all these studies are synthesized through a meta-analysis, the 10% error for each correlation quickly propagates through the analysis which may result in a situation where empirical results do not support plausible theories (Buckley et al., 1990). In fact, a recent meta-analytic article indicated that “for the PTSD–psychological aggression association, 98% of the variance was accounted for by methodological artifacts such as sampling and measurement error” (Taft, Watkins, Stafford, Street, & Monson, 2011, p. 22).
Thus, getting an accurate estimate of even a fundamental statistic as the correlation coefficient is essential because it is the building block to more advanced statistical models and is commonly used to synthesize research results through a meta-analysis. If the correlation coefficient with corresponding CIs is inaccurate because of measurement error, it will negatively affect the parameter estimates and inferences of statistical models based on the correlation coefficient and meta-analytic research in which it is used as a data point.
Correlation Attenuation
The correlation coefficient is biased as a result of measurement error (Charles, 2005; Fan, 2003; Mutch & Tisak, 2005; Schmidt & Hunter, 1996; Tarkkonen & Vehkalahti, 2005; You & Chen, 2006). The magnitude of the bias depends on the reliabilities of the measurement instruments used to represent the variables: Poor reliability estimates attenuate the correlation and, consequently, the effect size (Fan, 2003).
The lack of consistency in measuring variables (i.e., low reliability) results in obtaining a weaker (or attenuated) relationship between the variables than may be true in the population (Fan, 2003; Fleiss & Shrout, 1977; H. G. Johnson, 1944; Kirkpatrick, 1997; Murphy, 2008; Mutch & Tisak, 2005; Pedhazur, 1997; Winne & Belfry, 1982; Zimmerman & Williams, 1997). The relationship between the correlation coefficient and reliability can be seen by the equation for the deattenuated correlation coefficient (Spearman, 1904):

where ρ TxTy is the true correlation, ρ xy is the observed correlation, and ρyy′ and ρxx′ are the reliabilities for y and x, respectively. To estimate the deattenuated correlation one just replaces the parameters with the parameter estimates as follows:

Note that Equations (1) and (2) are valid for continuous and ranked (Spearman, 1904) variables.
According to Equations (1) and (2), the true correlation equals the observed correlation when there is no measurement error in x and y, that is, the reliabilities of both variables equal one (ρ yy = ρ xx = 1). When this does not hold, any measurement error variance in the variables results in correlation attenuation (Charles, 2005; Zimmerman & Williams, 1997). To correct for attenuation, accurate reliability estimates are required. According to Winne and Belfry (1982), the most common reliability coefficients are the Spearman–Brown split-half correlation and coefficient alpha (or Cronbach’s alpha). Assuming that the set of items in the measurement instrument are at least tau-equivalent or essentially tau-equivalent, coefficient alpha is equal to reliability (Graham, 2006; Lord, Novick, & Birnbaum, 1968; McDonald, 1999; Zinbarg, Revelle, Yovel, & Li, 2005). If the items are congeneric, coefficient alpha underestimates reliability, but coefficient omega is equal to reliability of the measurement instrument (McDonald, 1999; Zinbarg et al., 2005). Furthermore, both coefficients alpha and omega are equal to the reliability of the set of items when they are at least tau-equivalent. As noted by Winne and Belfry, using an underestimated reliability in Equations (1) and (2) results in overestimation of the correlation.
The two major psychometric components of a measurement instrument are validity and reliability (Allen & Yen, 1979; Crocker & Algina, 1986; Tarkkonen & Vehkalahti, 2005). Validity is concerned with whether the instrument measures what it purports to measure. Reliability, on the other hand, refers to the consistency or precision of the measure and is derived from the classical true score model as

where x is an observed score, τ is a true score, and u is a measurement error (Allen & Yen, 1979; Crocker & Algina, 1986; Tarkkonen & Vehkalahti, 2005). The true score model further assumes no correlation between the true score and the error, which allows for the separation of true score variance from the error variance,

where

Tarkkonen and Vehkalahti (2005) indicate that the majority of traditional studies focus on sampling error, often ignoring measurement error and, according to Fan (2003) and Schmidt and Hunter (1996), also underreport obtained reliability estimates. Both sampling and measurement error are mutually exclusive but both have a unique effect on the outcome. To see further derivations and an explanation of the measurement error variance, the interested reader is referred to Tarkkonen and Vehkalahti (2005).
The issue with bias due to measurement error carries over to path models. Recognizing the effect of correlation attenuation on their proposed teaching and learning path model, Stayrook and Corno (1979) corrected the path coefficients for attenuation. Unlike other discussed studies that applied the classical true score model, Stayrook and Corno followed generalizability theory, a more general extension of the classical true score model, where the true (or universe) score is “the average of all possible representative observations” (p. 229). In other words, the true score is the mean of the sampling distribution composed of representative observations. After correcting for attenuation, these researchers noted changes in their path coefficients that were more congruent with their hypotheses. Although a couple of path coefficients decreased in value, the magnitude of this change was not large and the model fit improved.
A clear interpretation from the discussion thus far can be made: Measurement error affects statistical results and corresponding conclusions. Despite the serious implications of measurement error, however, some studies still fail to report reliability estimates or refute the possibility of measurement error (Schmidt & Hunter, 1996). According to Schmidt and Hunter, there is yet to be a psychological variable that could derive an absolute value. Most psychological measures thus far developed do not account for 100% of the variability, leaving room for measurement error. Schmidt and Hunter further point out that even when reliability estimates are reported, researchers do not correct their results for measurement error, or if corrections are applied this is often done incorrectly. The researchers believe this confusion is due to lack of concrete examples as to when and how to use correction for attenuation.
To further illustrate their point, Schmidt and Hunter (1996) present a number of scenarios depicting common misconceptions and errors in judgment. For example, in one scenario the researcher in question assumes that measurement error and sampling error are one and the same. As previously noted the two are independent and refer to different research issues. Measurement error refers to an inconsistency in assessing a psychological construct; the bias is minimized when items generated to assess one factor are highly correlated, which implies that items measure the same construct. On the other hand, sampling error refers to the difference between a sample statistic and a population parameter. Sampling bias is a possible source of sampling error: Specifically, having overrepresentation or underrepresentation of some members of the population can bias a statistic.
Another common mistake noted by Schmidt and Hunter (1996) is the misconception associated with an adequate reliability estimate of .70 (Nunnally, 1978). Even if both variables have reliability of .70, “the bias factor is
Methodological Studies
Recent methodological research has investigated correcting measurement error in the correlation coefficient. In one such study, Zimmerman and Williams (1997) conducted a Monte Carlo simulation to analyze the properties of Spearman’s deattenuated correlation. The conditions of the simulation were as follows: distribution shape of the data, sample size, reliability coefficient, and population correlation. The researchers noted that the deattenuated correlation was unbiased, but only when the reliability of the variables was high (e.g., ≥.70). In contrast, if the reliability was low the deattenuated correlation greatly exceeded the true correlation. This was exacerbated with small samples (e.g., n = 20) in which case a deattenuated correlation greater than one became frequent. In addition, Zimmerman and Williams noted that the variability of corrected correlations increased as a function of poor reliability estimates, which may result in the overestimation of the association between the two variables. Zimmerman and Williams did not investigate CI coverage.
In another investigation, Charles (2005) addressed the criticisms associated with the deattenuated correlation. As was previously discussed, correcting for attenuation when using poor reliability estimates results in overestimation of the correlation, which can result in a corrected correlation coefficient that goes beyond ±1. Instead of abandoning the attenuation correction method, Charles proposed the use of confidence sets. Unlike CIs, the idea behind confidence sets is that interest lies in finding population bounds likely to have generated the obtained sample as opposed to CIs which reflect sampled values likely to have been generated by a given population. According to Charles, corrected correlations consist of true correlations and nuisance correlations (see Charles, 2005, for details).
Charles (2005) investigated confidence sets for correction for attenuation due to measurement error. The confidence sets were derived from regressing the sampling distribution standard deviation from the deattenuated correlation on the sample size, geometric mean of reliability, square of true-score correlation, and their two- and three-way interactions. The regression equation accounted for 99.6% of the deattenuated correlation variability. The method performed reasonably well under the investigated conditions. However, it has seen little use in the applied literature. One reason may be that the method is counterintuitive to what researchers are used to in that statistics are used to estimate population parameters as opposed to finding a range of populations that generate the sample data.
The purpose of the current study is to assess the performance of the bootstrapped deattenuated correlation and corresponding CIs based on Spearman’s original correlation correction. In particular, interest lies in simulation conditions similar across earlier studies. The bootstrapped deattenuated correlation was assessed for bias and interval estimation. We start with the bootstrapped deattenuated correlation.
Bootstrapped Deattenuated Correlation
The bootstrapped deattenuated correlation for a pair of variables x and y can be summarized in three steps. Suppose

from
The bootstrap estimate of standard error (SE) for the deattenuated correlation is

where b is the bootstrap replicate,

There are several types of bootstrap CIs that can be constructed, but here we will focus on the percentile bootstrap (PB) and the bias-corrected and accelerated bootstrap (BCa) CIs because the sampling distribution of the correlation coefficient is not normal (N. C. Johnson, Kotz, & Balakrishnan, 1995). The PB CI can be constructed by computing the α/2 and 1 −α/2 percentiles from the
In the current study, these methods were used to estimate 100(1 –α)% CIs for the deattenuated correlation under several simulation conditions, where α = .05. In addition, all corresponding bootstrap quantities were estimated from a total of 1,000 bootstrap samples.
Method
Simulation
A Monte Carlo simulation was used to investigate the properties of the bootstrapped deattenuated correlation CIs. Specifically, the impact of three simulation factors was investigated in a 5 (correlation magnitude) × 5 (reliability) × 6 (sample size) simulation design. All data were simulated assuming multivariate normality. To increase the generality of the results, data were simulated under similar scenarios investigated in earlier studies (Charles, 2005; Zimmerman & Williams, 1997). In this study, 1,000 replications were obtained for each combination of the Monte Carlo simulation.
Data were simulated as follows. First, generate an n×k multivariate true variable data

where

where ρ ij is the reliability of jth variable. The following simulation conditions were investigated.
Correlation (ρ)
Small, medium, and large correlations, as defined by (Cohen, 1988), were investigated. The Pearson product–moment correlation (ρ) measures the magnitude of a relationship between the two continuous variables and can be interpreted as an effect size (ρ2). Cohen recommends the following interpretation of the correlation coefficient: ρ = .10, .30, .50 represents a small, moderate, and strong correlation, respectively. To broaden the investigation, we focused on the correlation coefficients ranging from .10 to .50 in increments of .10.
Reliability (ρ ij )
The reliability of both variables in the correlation was manipulated. The rule of thumb in the behavioral sciences is to consider a reliability coefficient of .70 as an adequate reliability estimate (Nunnally, 1978). Nonetheless, we investigated reliability estimates ranging from .50 to .90 in increments of .10, which mimic scenarios similar to what is often seen in applied research.
Sample size (n)
The following sample sizes were investigated: n = 50, 100, 150, 200, 250, 300. These are typical sample sizes found in social/behavioral research.
Procedure
In each replication, the deattenuated correlation was computed along with the corresponding bootstrap 95% CIs. Relative bias for the deattenuated correlation was computed as

where ρ is the true population correlation. The average of the estimated SE was computed as

where rep is the number of replications and
CI coverage was assessed using Bradley’s (1978) liberal criterion, which is defined as 1 − 1.5α≤ 1 −ρ≤ 1 − 0.5α (Romano, Kromrey, & Hibbard, 2010). Coverage is defined as the proportion of estimated CIs that contain the true population correlation. Thus, with α = .05 acceptable coverage falls within the interval [.925, .975].
Results
Point Estimate Bias
The focus of the study is the bootstrapped deattenuated correlation CIs; however, parameter estimate bias was also investigated since it can have an effect on the CIs. Tables 1 through 5 display the results and there is no observable bias. In fact, the magnitude of the bias was .00 ± .07. However, the quantities for bias behave in the anticipated manner: Bias decreases as sample size and/or reliability increases.
95% CI Coverage for Reliability by Sample Size at .10 Correlation
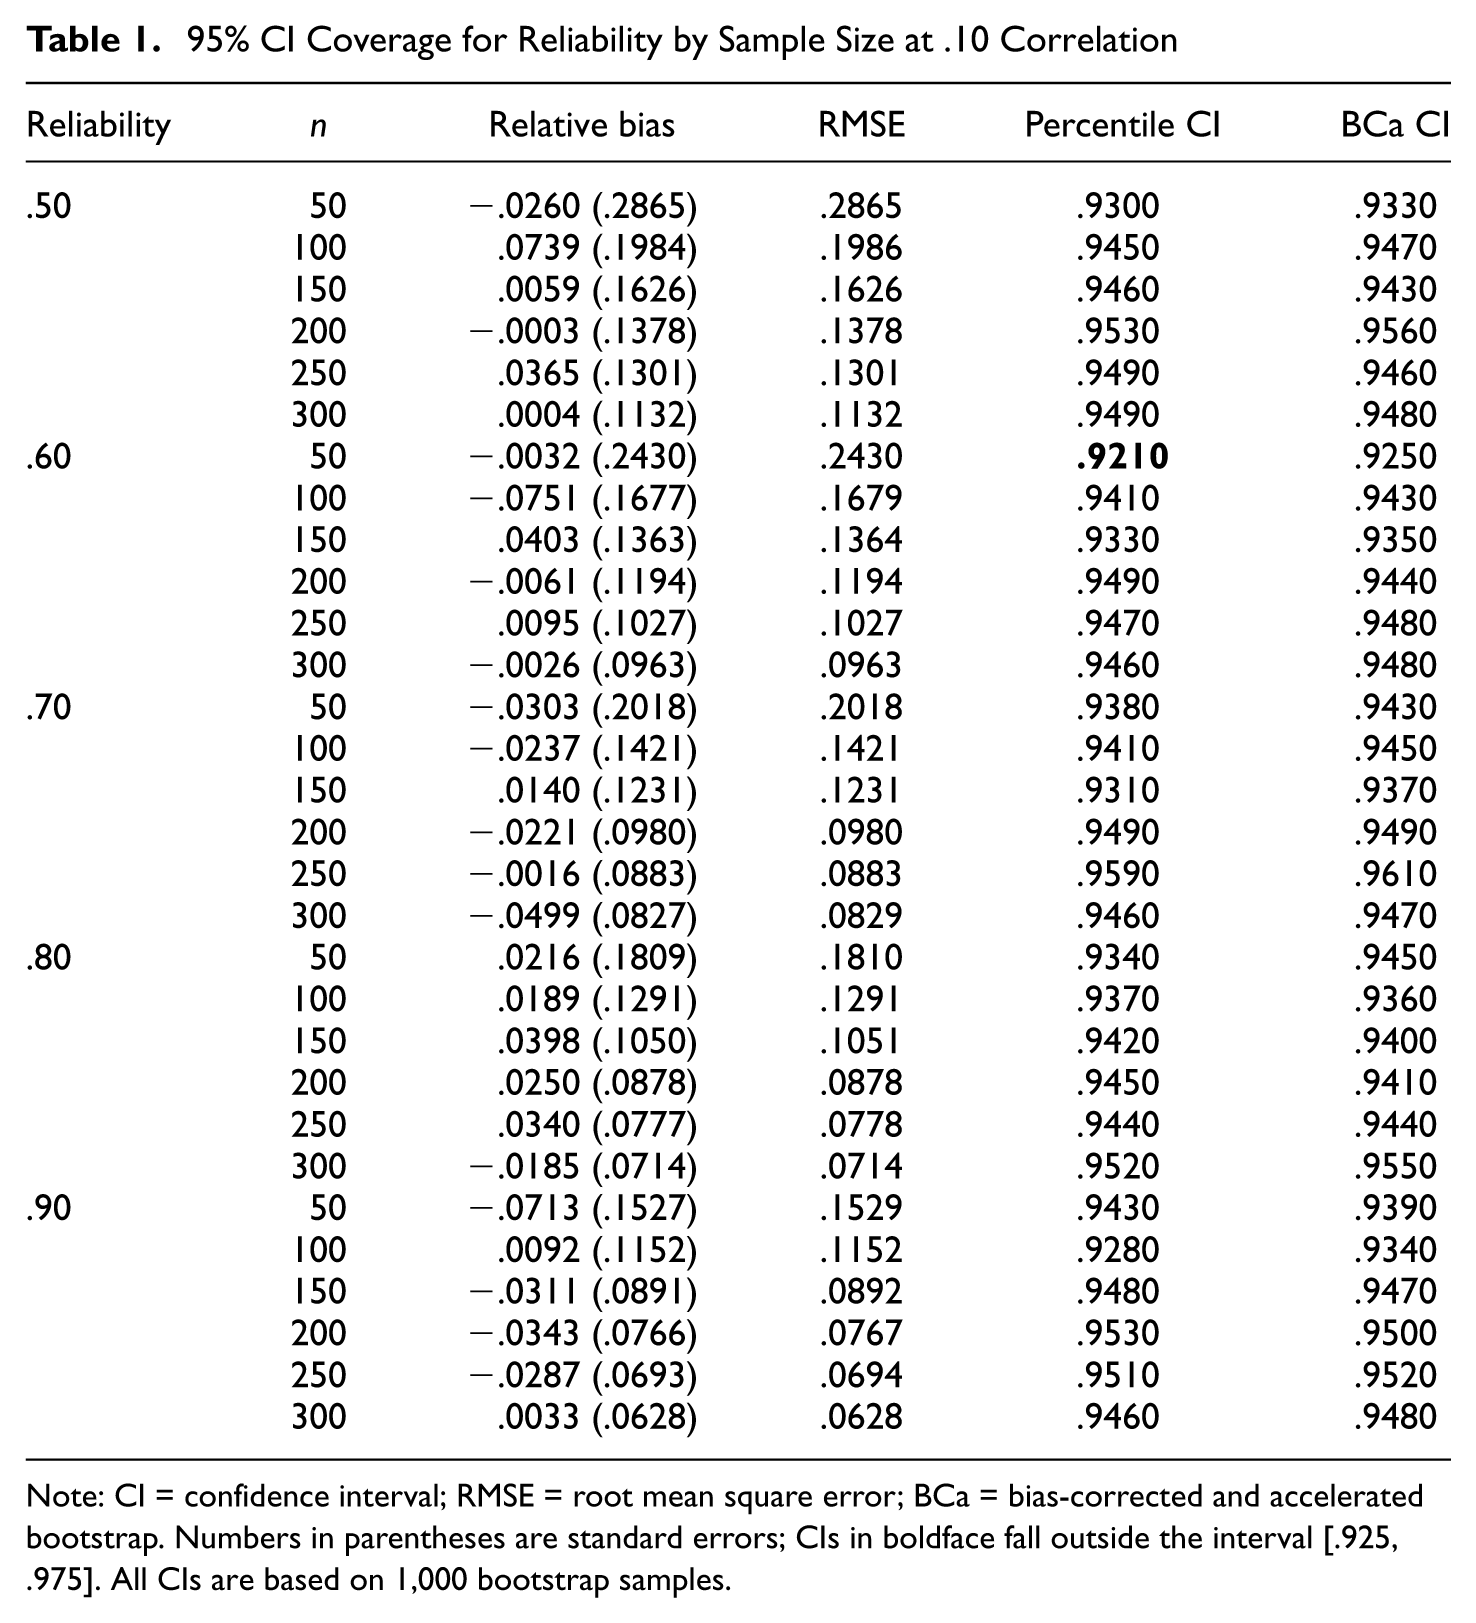
Note: CI = confidence interval; RMSE = root mean square error; BCa = bias-corrected and accelerated bootstrap. Numbers in parentheses are standard errors; CIs in boldface fall outside the interval [.925, .975]. All CIs are based on 1,000 bootstrap samples.
95% CI Coverage for Reliability by Sample Size at .20 Correlation
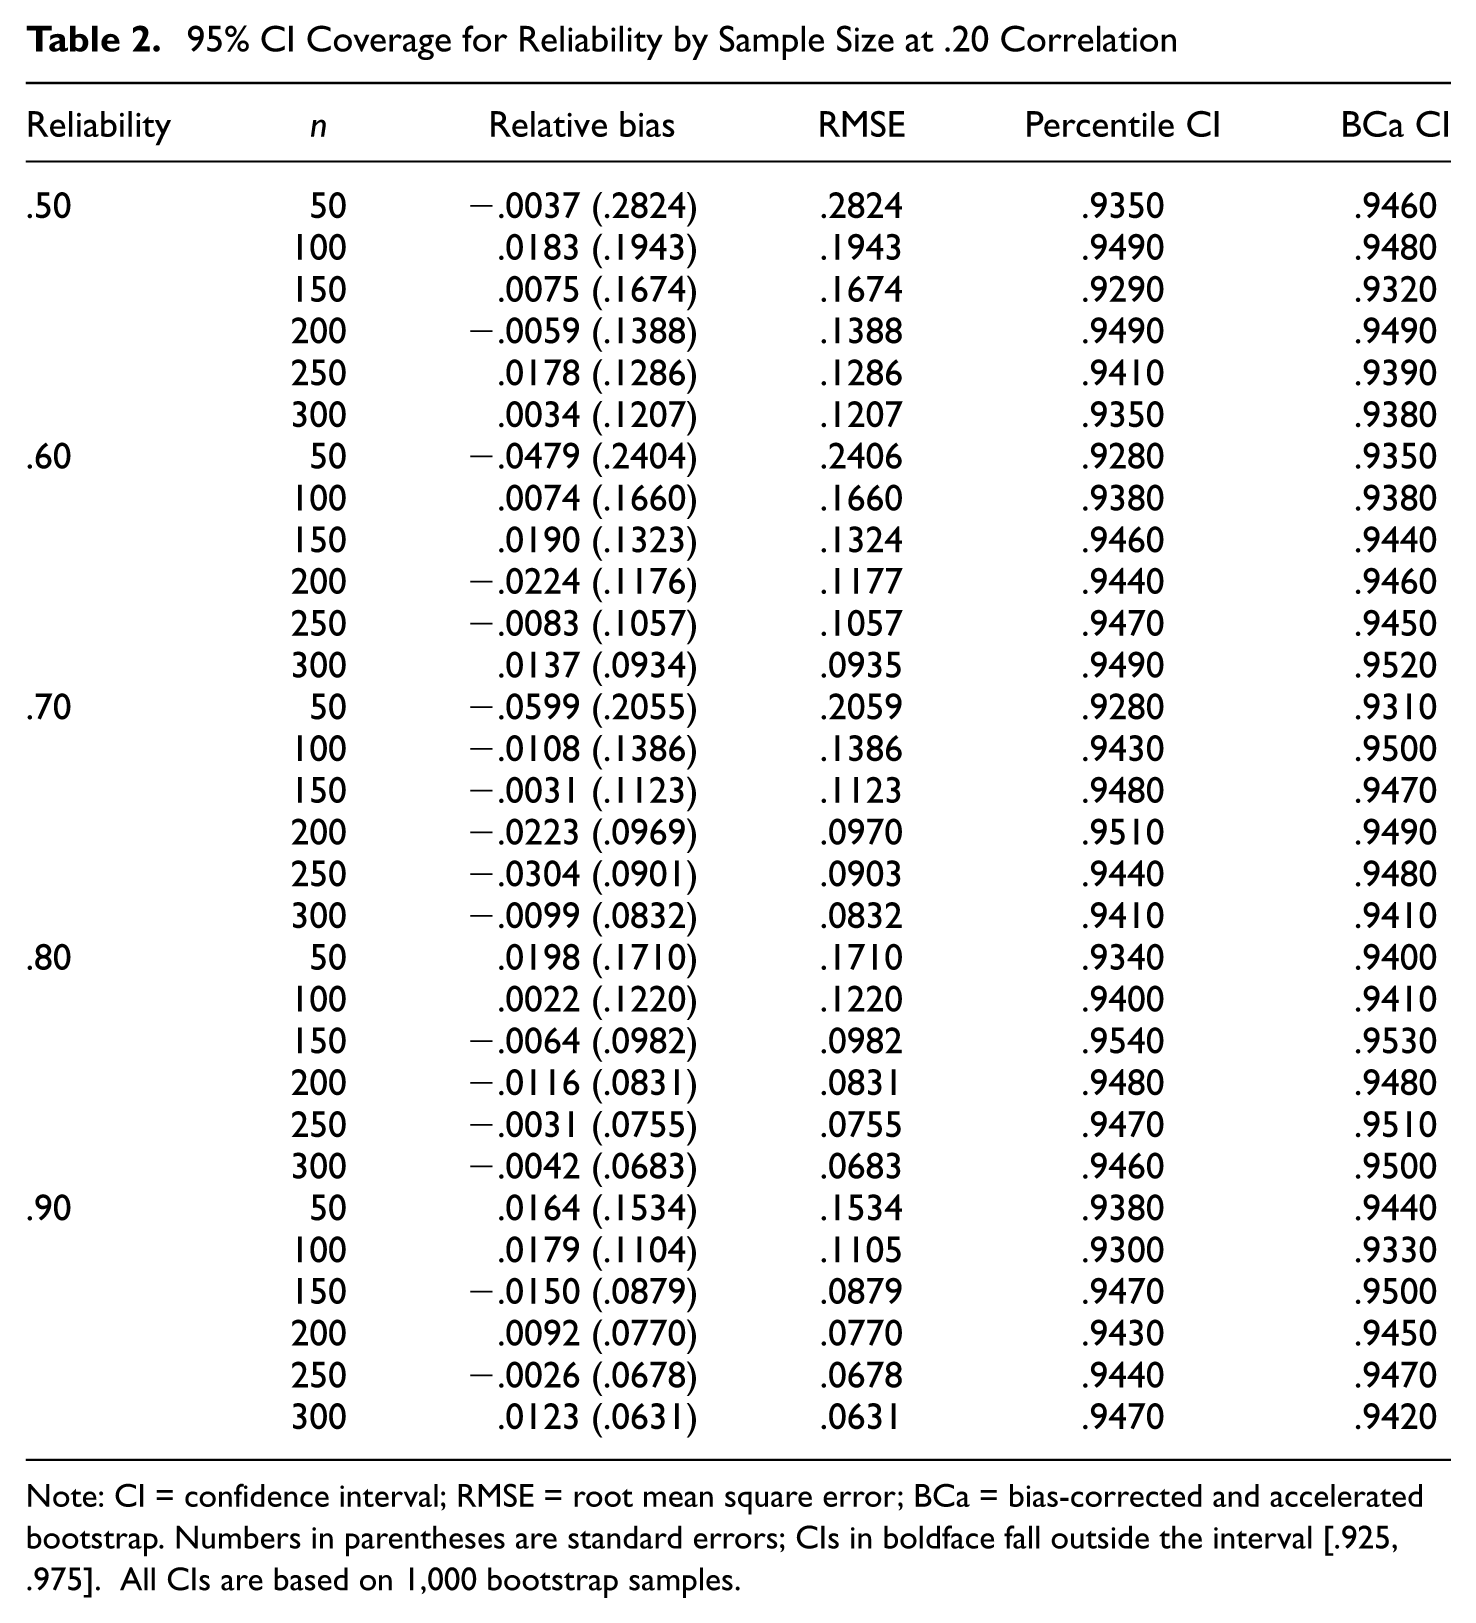
Note: CI = confidence interval; RMSE = root mean square error; BCa = bias-corrected and accelerated bootstrap. Numbers in parentheses are standard errors; CIs in boldface fall outside the interval [.925, .975]. All CIs are based on 1,000 bootstrap samples.
95% CI Coverage for Reliability by Sample Size at .30 Correlation
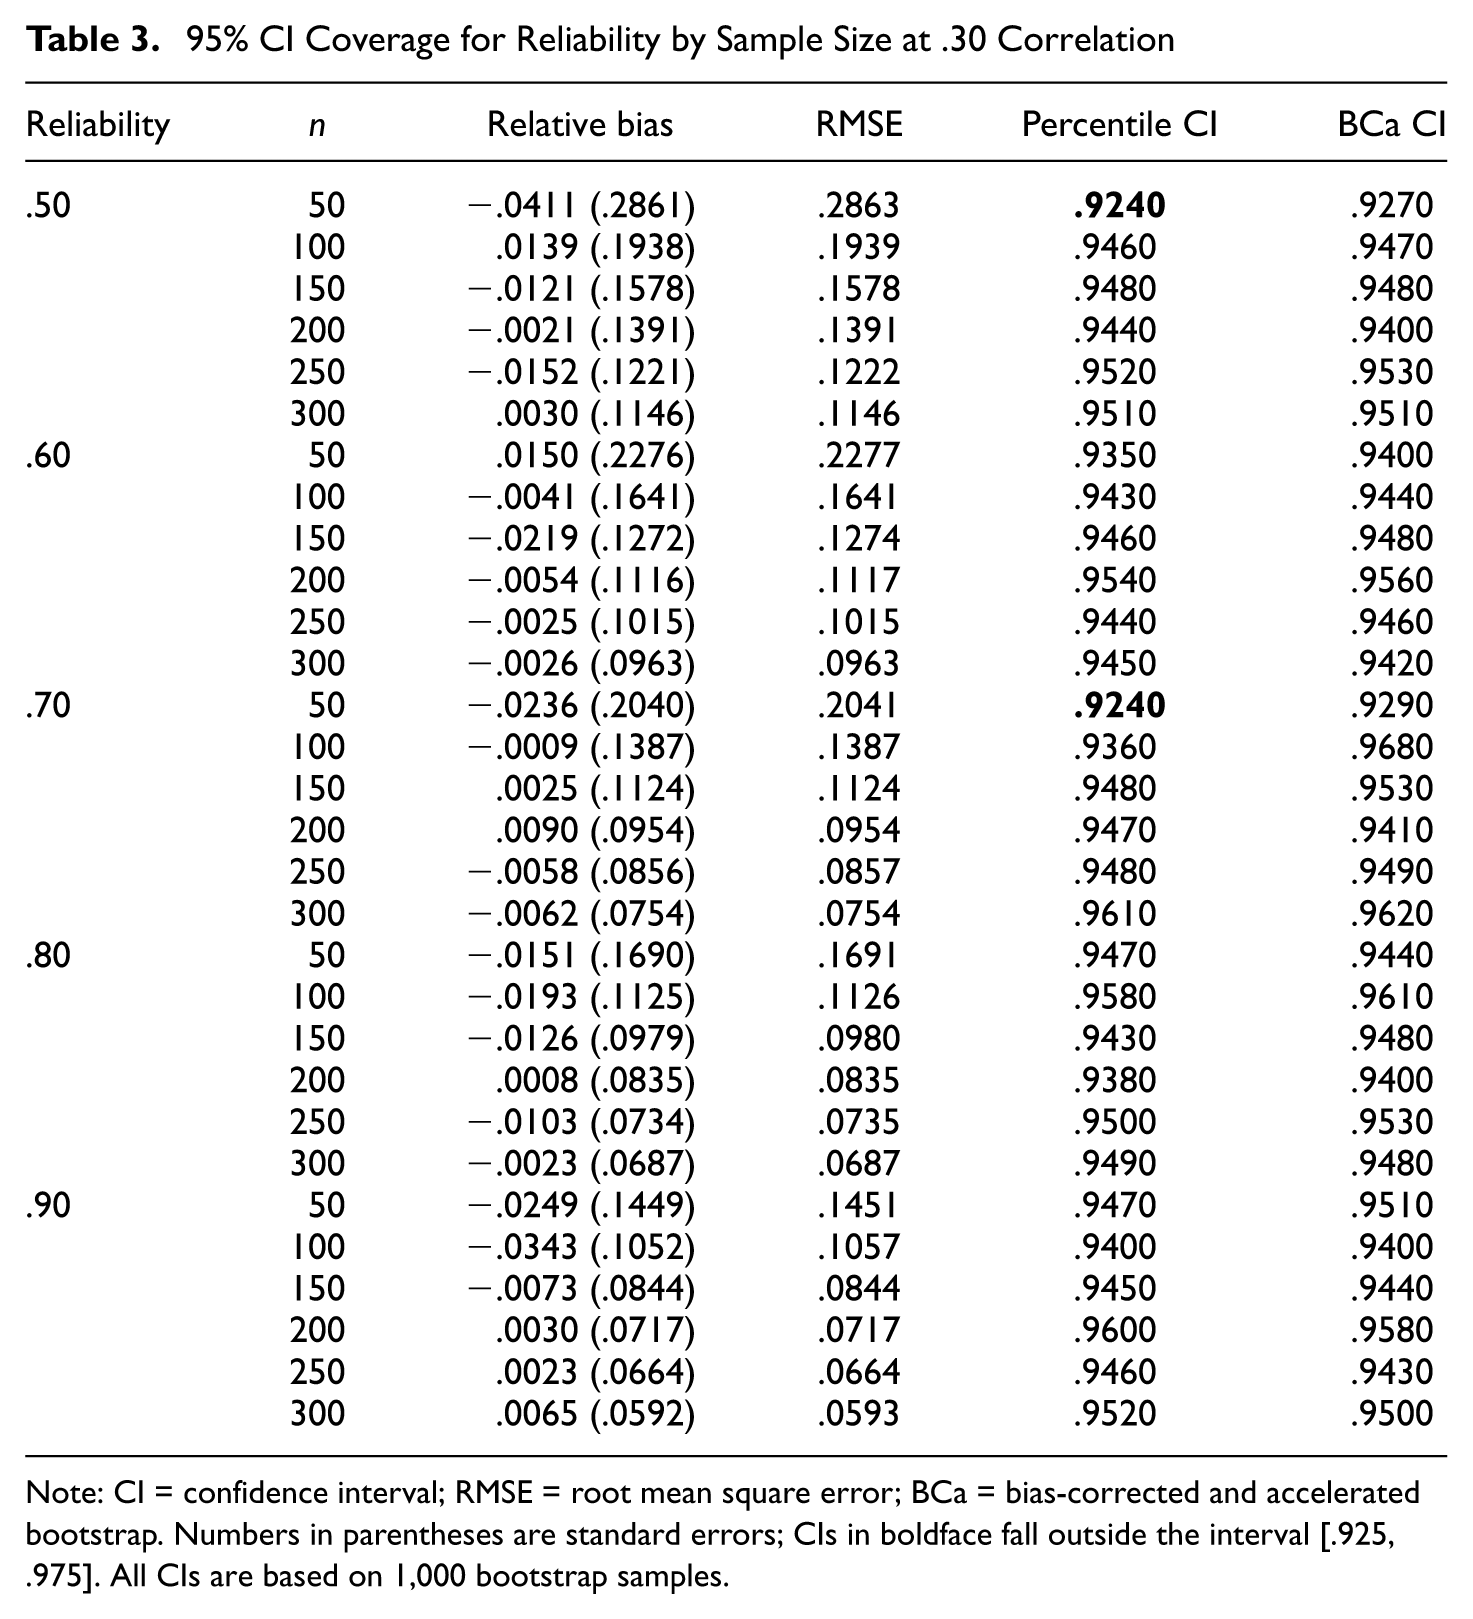
Note: CI = confidence interval; RMSE = root mean square error; BCa = bias-corrected and accelerated bootstrap. Numbers in parentheses are standard errors; CIs in boldface fall outside the interval [.925, .975]. All CIs are based on 1,000 bootstrap samples.
95% CI Coverage for Reliability by Sample Size at .40 Correlation
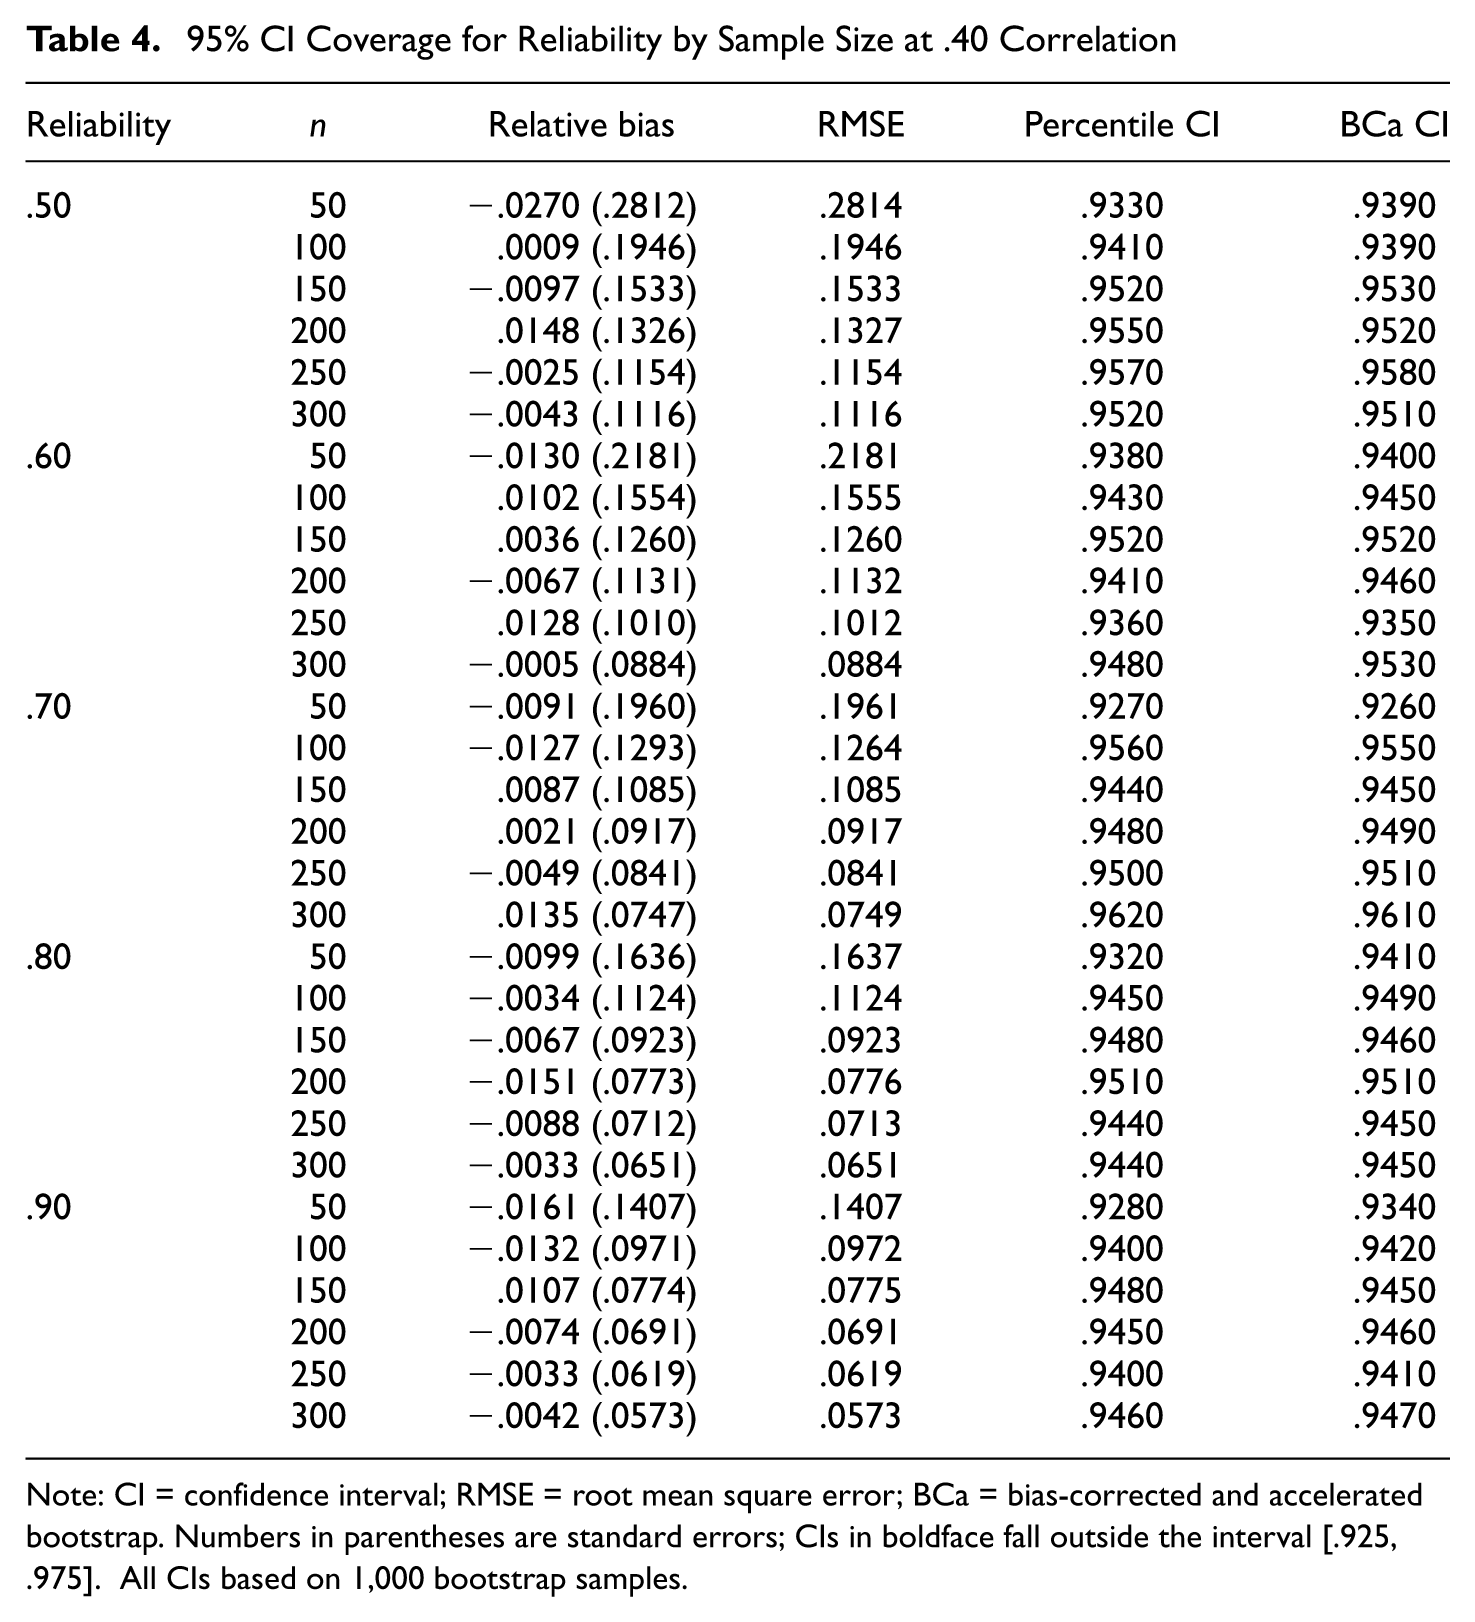
Note: CI = confidence interval; RMSE = root mean square error; BCa = bias-corrected and accelerated bootstrap. Numbers in parentheses are standard errors; CIs in boldface fall outside the interval [.925, .975]. All CIs based on 1,000 bootstrap samples.
95% CI Coverage for Reliability by Sample Size at .50 Correlation
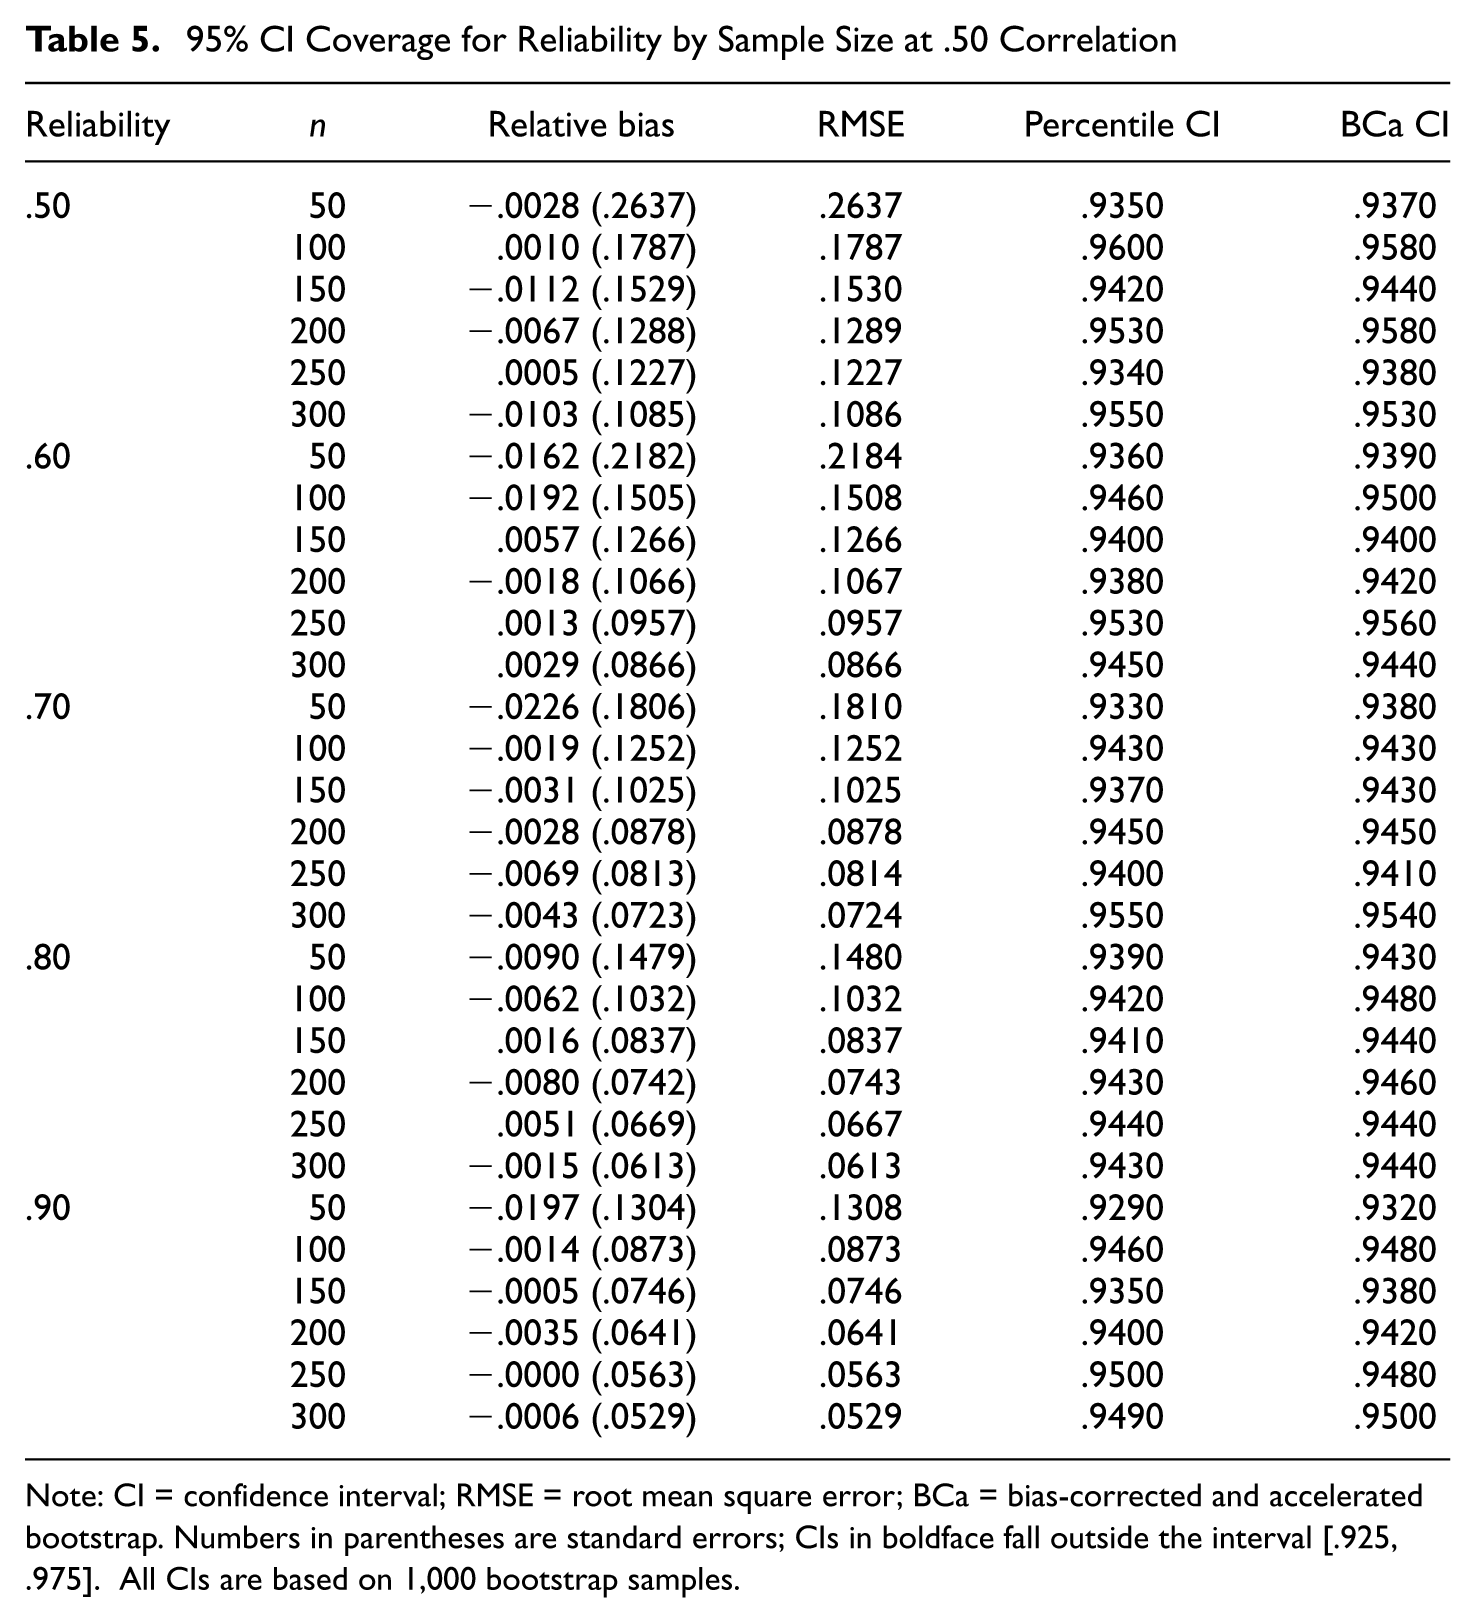
Note: CI = confidence interval; RMSE = root mean square error; BCa = bias-corrected and accelerated bootstrap. Numbers in parentheses are standard errors; CIs in boldface fall outside the interval [.925, .975]. All CIs are based on 1,000 bootstrap samples.
Standard Error and Root Mean Squared Error
Although the SE is not technically required for the PB or BCa CI, it gives an indication of the precision of the deattenuated correlation. The results in Tables 1 through 5 indicate that the deattenuated correlation has very little variability. In addition, the SE becomes smaller as the sample size and reliability increase, that is, the deattenuated correlation becomes more precise. The root mean square error (RMSE) is similar to the SE in magnitude and behaves in a similar manner, that is, the RMSE becomes smaller as the sample size and reliability increase.
Confidence Intervals
For the majority of simulation conditions, both the PB and BCa CIs met Bradley’s criteria (Bradley, 1978). Results are shown in Tables 1 through 5. In only the following three instances with a sample size of 50, the PB CIs fell slightly below the lower bound of Bradley’s criteria: (a) when the correlation was .10 and reliability was .60 and (b) when the correlation was .30 and the reliability was .50 or .70. However, the BCa CIs met Bradley’s criteria in all conditions. The slight underestimation of the PB CIs in the three conditions indicated above could be due to the PB CI requiring a sample size larger than 50 and/or could be due to simulation (or sampling) error.
Figures 1 and 2 display the 95% CI coverage for each method over sample size. As can be seen, both the PB and BCa CIs had similar coverage probabilities. However, the BCa CIs had more consistent estimation in that they had less variability and thus were narrower.
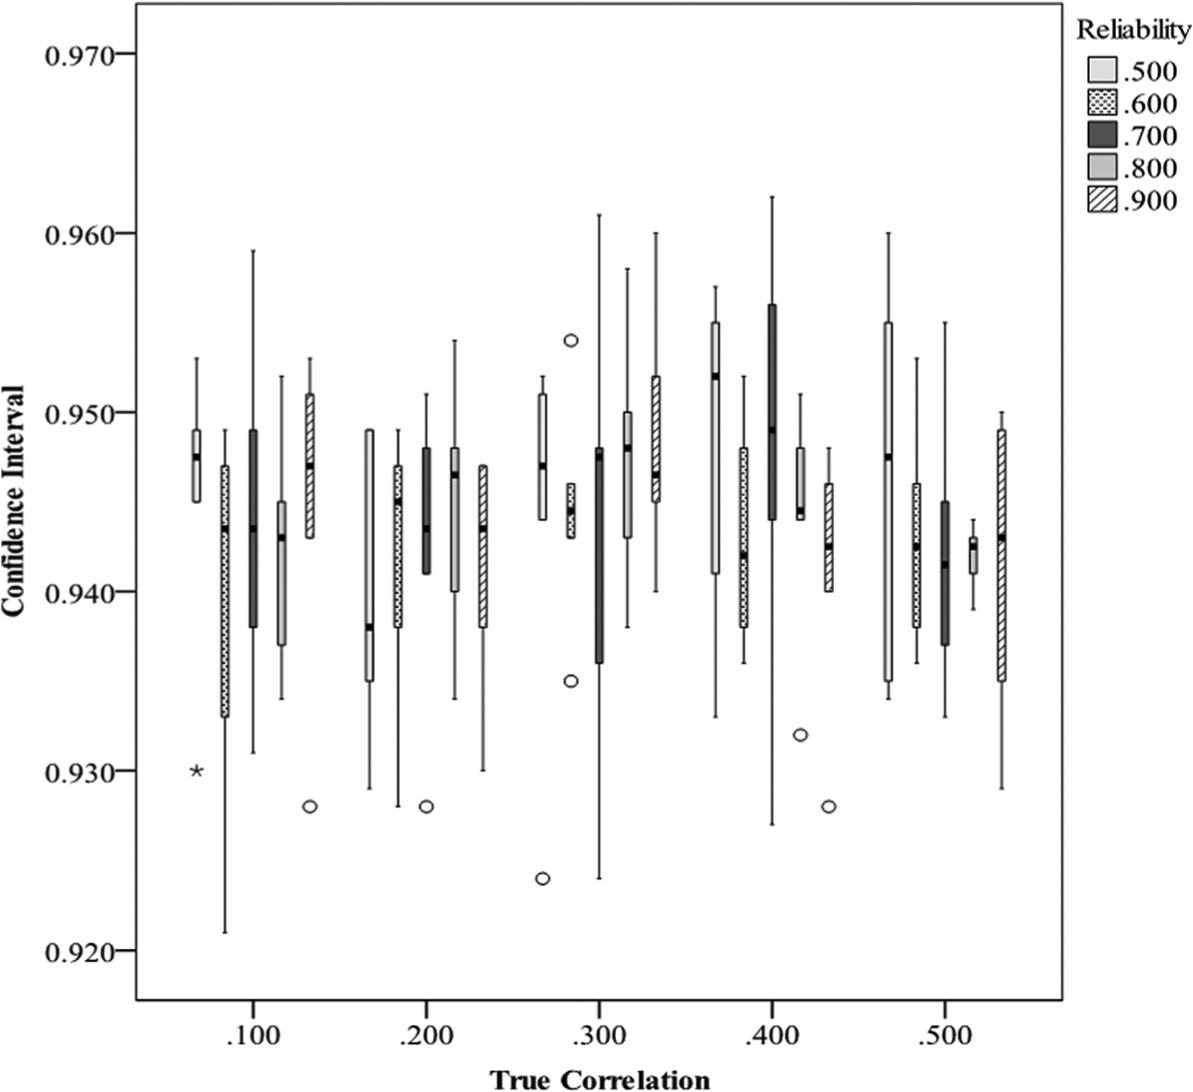
Percentile bootstrap 95% confidence interval coverage over sample size

Bias-corrected and accelerated 95% confidence interval coverage over sample size
Discussion
Measurement error in the social/behavioral sciences is common because of the nature of the latent variables of interest in these fields such as anxiety, depression, IQ, and so on. These types of variables exist in potential but cannot be directly measured. Thus, they must be indirectly measured through items in a measurement instrument at which point the measurement error is introduced. However, measurement error in these types of variables can hinder the correlation between them which can propagate to other statistics and methodologies that are based on the correlation such as GLMs and meta-analysis (Buckley et al., 1990; Carroll et al., 2006; Kassarjian, 1971; Lance et al., 2010; Schmidt & Hunter, 1996; Taft et al., 2011). Thus, it is important to get an accurate correlation estimate and accompanying CIs when there is measurement error in the variables.
Although the effects of measurement error on the correlation coefficient, and potential solution by way of the deattenuated correlation, have been known for over a century (Spearman, 1904), to date very little of it is used in applied work (Charles, 2005; Schmidt & Hunter, 1996). The main issues hindering its use are that CIs for it have been difficult to develop and that the deattenuated correlation can potentially be greater than one. Several recent studies have been conducted to investigate these issues further (Charles, 2005; Zimmerman & Williams, 1997). Although the first study had promising results when reliability and sample size were .70 and 100 or greater, respectively, it did not investigate CIs. The second study investigated confidence sets as opposed to CIs for the deattenuated correlation. This method also showed promise; however, the lower bound had accuracy issues with high correlations (e.g., r≥ .70) and small sample sizes (e.g., n≤ 100). Even so, the methodology has seen little use in applied research.
Here we introduce a bootstrapped deattenuated correlation coefficient with corresponding CIs and assessed its statistical properties through simulation. Simulation conditions investigated included true population correlation, sample size, and reliability of both variables. According to the results, the BCa CIs were acceptable under all 150 conditions of the simulation. The PB CIs had unacceptable coverage in three simulation conditions: The conditions included a sample size of 50, reliability of .70 or less, and correlation between .10 and .30. For the conditions investigated, the BCa method showed excellent promise whereas some caution is warranted for the PB method with sample size of 50 or less and reliability of .70 or less. Thus, the bootstrapped deattenuated correlation is an adequate method for correcting the attenuated correlation due to measurement error and provides good estimates of corresponding CIs.
Bootstrap methodology is a flexible technique that can be used to solve a variety of statistical problems, but to our knowledge it has not been used to address measurement error in the correlation coefficient. In this capacity, the bootstrap holds much promise with three advantages. First, within this investigation, the bootstrap remained relatively unbiased and did not exceed the correlation bounds (±1), which was the primary criticism in earlier studies. Second, the bootstrap provided the ESD for the deattenuated correlation, which was recommended by Charles (2005) and “. . . difficult, if not impossible . . .” according to Hakstian, Schroeder, and Rogers (1988, p. 27). As such, the bootstrapped deattenuated correlation did not have any lower and/or upper bound accuracy issues. Third, the bootstrap deattenuated correlation can be extended to GLMs. The parameter estimates of any GLM can be obtained through the covariance (correlation) matrix and mean vector for a set of variables (for details, see Timm, 2002). In this respect, one replaces the covariance matrix with the deattenuated covariance matrix at each bth step from which the GLM parameter estimates are obtained. From here, the ESD for each GLM parameter estimate is generated and can be used to make inferences.
A limitation here is that the bootstrapped deattenuated correlation’s performance was assessed using normally distributed data. Although the normality assumption dominates research in social/behavioral sciences, there is no indication that any proposed CI for the deattenuated correlation, including the one here, is robust to the normality assumption (Charles, 2005; Zimmerman & Williams, 1997). Zimmerman and Williams did not investigate the CI for the deattenuated correlation; however, they indicated that the deattenuated estimate of the correlation is unbiased under a variety of distributions when the reliability is high (e.g., .70). This suggests that the bootstrapped deattenuated correlation may hold promise under nonnormality given that the procedure only requires an unbiased estimate to generate the correct CIs. Even so, future research should investigate the performance of the bootstrapped deattenuated correlation under nonnormality.
While other studies about the deattenuated correlation investigated a larger range for reliability, here we only focused on reliability that ranged from .50 to .90. This decision was made as a matter of practicality. It is difficult to imagine a researcher using a measurement instrument with reliability less than .70. A measurement instrument with a reliability estimate of .70 indicates that 30% of the instrument’s variance is error variance; a reliability estimate of .50 indicates that 50% of the instrument’s variance is error variance. Thus, we did not investigate as wide a range of reliability as previous studies; however, the range that was investigated is sufficient for applied research. In addition, the reality is that in applied research a measurement instrument with more than 30% of its variance being error variance should probably not be used (Nunnally, 1978). In this case, the researcher should find or create a more adequate measurement instrument.
As previously mentioned, the deattenuated correlation has seen very little use in the social/behavioral sciences since its inception more than 100 years ago (Charles, 2005). Although several reasons have been discussed, the most likely reason is the vast popularity of coefficient alpha (Cortina, 1993; Hogan, Benjamin, & Brezinski, 2000). It is widely known that coefficient alpha is a lower bound estimate of reliability, and therefore it is used to provide a conservative estimate of reliability. Given that the deattenuated correlation, including the one proposed here, assumes that the reliability estimate is accurate, researchers most likely worry that using coefficient alpha will inflate the estimated deattenuated correlation and possibly make it larger than one. This is a valid concern. However, researchers should be reminded that coefficient alpha is not the only measure of reliability.
As discussed earlier, an alternative to coefficient alpha is coefficient omega (McDonald, 1999; Zinbarg et al., 2005). Coefficient omega provides a comparable form of reliability to coefficient alpha but does not have the strict assumption that the items have to be tau-equivalent or essentially tau-equivalent. When this assumption is not met, coefficient alpha will underestimate the reliability whereas coefficient omega will not. Hence, there is an option to using coefficient alpha. See McDonald (1999) and Zinbarg et al. (2005) for further details.
As noted by Charles (2005), arguing that the deattenuated correlation is imperfect indicates that the attenuated correlation is even more imperfect. If attenuation due to measurement error continues to be ignored, researchers will continue to have a difficult time finding a true relationship (or effect) that may exist. Furthermore, it automatically implies that variables are measured without error, which is not the case in the social/behavioral sciences (Schmidt & Hunter, 1996). Although attenuated correlations continue to be used, it is mostly out of a defensive position in that it is better to be conservative than overoptimistic. In addition, Schmidt and Hunter suggest that such a position is emotional as opposed to rational, and that failure to correct for attenuation is the second worst methodological error in the literature—second only to declaring significance when a p value is less than .05.
In conclusion, this preliminary study has illustrated the increase in accuracy when combining the deattenuated correlation with the bootstrap procedure. According to the results, the bootstrapped deattenuated correlation is an adequate method for correcting the attenuated correlation due to measurement error and provides equally adequate CIs. Given the controversy over the deattenuated correlation, it is hoped that the presentation here, at the very least, is a good start at revisiting this century-old problem.
Interested researchers can obtain an easy-to-use R function for the bootstrapped deattenuated correlation with example data free of charge by contacting the corresponding author.
Footnotes
Declaration of Conflicting Interests
The author(s) declared no potential conflicts of interest with respect to the research, authorship, and/or publication of this article.
Funding
The author(s) received no financial support for the research, authorship, and/or publication of this article.