
Abstract
The performance of the normal theory bootstrap (NTB), the percentile bootstrap (PB), and the bias-corrected and accelerated (BCa) bootstrap confidence intervals (CIs) for coefficient omega was assessed through a Monte Carlo simulation under conditions not previously investigated. Of particular interests were nonnormal Likert-type and binary items. The results show a clear order in performance. The NTB CI had the best performance in that it had more consistent acceptable coverage under the simulation conditions investigated. The results suggest that the NTB CI can be used for sample sizes larger than 50. The NTB CI is still a good choice for a sample size of 50 so long as there are more than 5 items. If one does not wish to make the normality assumption about coefficient omega, then the PB CI for sample sizes of 100 or more or the BCa CI for samples sizes of 150 or more are good choices.
Keywords
McDonald (1970) first proposed coefficient omega as a reliability index for homogenous items a little over 40 years ago. Coefficient omega uses the item factor loadings and uniqueness from a factor analytic model to compute reliability. As such, coefficient omega is a more intuitive reliability measure because it is based on factor loadings and not strictly on correlations as compared to coefficient alpha (Cronbach, 1951; Guttman, 1945). However, there are probably two reasons why it is rarely used in applied settings. First, its utilization in scientific research is dwarfed by coefficient alpha, which is well cited in the literature. More than half a century of cited research gives the impression that coefficient alpha is the only viable reliability coefficient. Second, knowledge of its statistical properties is narrow, in particular with respect to its statistical distribution, which is needed for inference.
Measurement error resulting from using multiple-item questionnaires, inventories, and other measurement instrument is a common issue faced by behavioral/social science researchers. Measurement error from such instruments is commonly quantified by a reliability coefficient. Typically, behavioral/social science researchers use these reliability measures to evaluate items to aid in the creation/modification of reliable measurement instruments. By far, the most common reliability coefficient used in the behavioral/social sciences is coefficient alpha (Hogan, Benjamin, & Brezinski, 2000; Peterson, 1994).
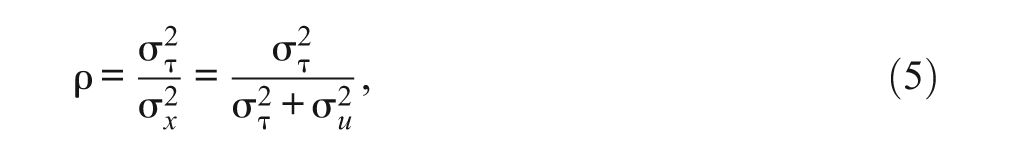
Coefficient alpha is an excellent estimator of internal consistency when used correctly. In addition, confidence interval (CI) estimates for coefficient have been developed (Maydeu-Olivares, Coffman, & Hartmann, 2007; Padilla, Divers, & Newton, 2012; Romano, Kromrey, & Hibbard, 2010; van Zyl, Neudecker, & Nel, 2000; Yuan, Guarnaccia, & Hayslip, 2003). However, coefficient alpha is a biased estimate of reliability when items are not at least tau-equivalent or essentially tau-equivalent (Graham, 2006; Lord, Novick, & Birnbaum, 1968; McDonald, 1999; Zinbarg, Revelle, Yovel, & Li, 2005). Tau-equivalence can best be described in terms of the classical true score model (CTSM) from classical test theory (CTT) in relation to a one-factor factor analysis model. We briefly highlight the most restrictive case to the least restrictive case of the CTSM.
The most restrictive case of the classical true score model assumes the items to be parallel. In this case, the model is written as

where xij is the observed score, τ
i
is the true score, and ui is the measurement error for
A less restrictive case is when items are assumed to be tau-equivalent. For tau-equivalence, the model is written as

For essential tau-equivalence, the model is slightly modified as

In this case, the true scores differ by a unique constant (aj). The main difference between Model (1) and Models (2) and (3) is that the error variances for the latter two models need not be equal. In this case, the item covariance matrix for the xjs need not have equal variances
Finally, the least restrictive case is when items are congeneric. Here, the model is written as

The main difference between tau-equivalent and congeneric items is the linear relationship (bj) between the true (τ
i
) and observed (xij) scores. The item covariance matrix here need not have equal variances
Raykov (1998) proposed a bootstrap percentile CI for the composite reliability of congeneric items measuring a common dimension (Raykov, 1997). The method is specified as a structural equation model (SEM) and showed promise. An illustration of the method with 1,000 bootstrap samples was provided for a small simulation study that considered a sample size of 400 individuals and 6 multivariate normal congeneric items assuming unidimensionality.
In another study, Raykov (2002) derived the standard error for the composite reliability via the delta method, a non-bootstrap method. As before, the model is specified through an SEM framework. It showed promise, and was illustrated with a small simulation. The simulation included a sample size of 500 individuals and 5 multivariate normal congeneric items assuming unidimensionality. It is important to note that the delta method CI was compared to the bootstrap percentile CI with 2,000 bootstrap samples. Both methods had comparable results.
In a parallel study, Raykov and Shrout (2002) presented a more general form of the composite reliability again within the SEM framework with bootstrapped percentile CIs. The method extends the previous method by Raykov (1997, 1998). As before, the authors illustrated the method with 1,000 bootstrap samples in a small simulation that had a sample size of 300 individuals, 6 multivariate normal congeneric items, and a model that assumed two dimensions. The simulation provided evidence that the composite reliability estimate is unbiased and the CIs contain the population parameter.
In more recent publications (Raykov, 2012; Raykov & Marcoulides, 2011), the aforementioned bootstrap and non-bootstrap methods are discussed, and the non-bootstrap method is also illustrated on large example data sets (i.e., n≥350). An important consideration here is that the logit transformation was added to the non-bootstrap method because the reliability parameter is bounded by
The composite reliability CI studies are a promising beginning, but there is still more research to conduct. First, the impact of nonnormal and noncontinuous items remains to be evaluated. Second, the large samples properties of the methods remain unknown. These two conditions have important implications for applied work because items are rarely normal (Micceri, 1989) and continuous (Raykov, 2002) and knowledge of a sufficient sample size for robustness/inference is vital.
The purpose here is to investigate the performance of coefficient omega bootstrap CIs under simulation conditions that investigate the situations described above. Of particular interest is the impact of nonnormality, Likert/ordinal (e.g., categorical) and binary items, and sample sizes less than 300. We begin with the definition of coefficient omega.
Coefficient Omega and Reliability
Consider a set of k items
where
Coefficient omega for congeneric items is defined as
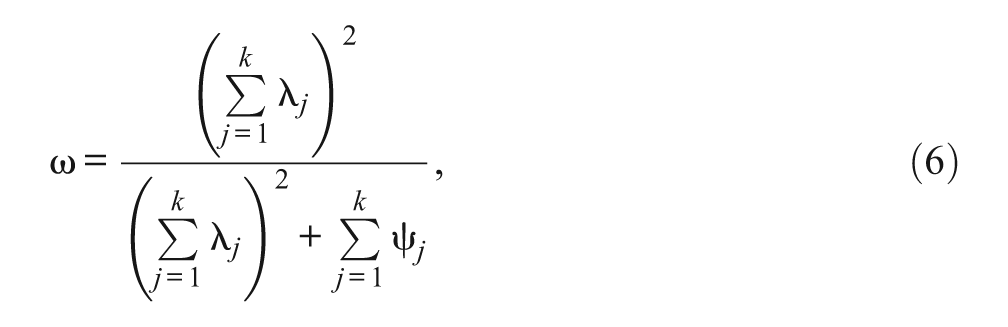
where λ
j
and ψ
j
are the jth factor loading and uniqueness, respectively (McDonald, 1970, 1999). Coefficient omega is estimated
Bootstrapped Coefficient Omega CIs
Bootstrapping for coefficient omega can be summarized in three steps. Suppose

where
The three most common bootstrap CIs were examined. First, the normal theory bootstrap (NTB) CI is estimated as
The bootstrap is a general statistical method with several attractive features (Efron & Tibshirani, 1998). However, its most notable feature is its application to situations where the theoretical distribution of a statistic of interest is complicated or unknown. To date, the distribution for coefficient omega remains unknown. Thus, this presents an ideal situation for the bootstrap and in particular for the PB and BCa CIs.
It should be noted that bootstrapping has been investigated for coefficient alpha (Padilla et al., 2012). In that study, the bootstrapped CIs performed well across a variety of simulation conditions that included items that were noncontinuous and a variety of sample sizes.
Method
Simulation Design
Five different simulation factors were investigated in a 4 (# of items) × 3 (corr. type) × 4 (# of item response categories) × 2 (distribution type) × 6 (sample size) Monte Carlo simulation design for a total of 576 conditions. All simulated items were nonnormal and Likert-type (ordinal) or binary; none of the items were continuous. For each simulation condition, 1,000 replications were obtained.
Likert-type and binary items were generated using the method used in Maydeu-Olivares et al. (2007). This method is outlined below:
Select the structure of the k×k correlation matrix
Select a set of thresholds
Generate an n×k multivariate data matrix
Categorize the generated data
Compute the true population coefficient omega (ω) according to
Estimate the coefficient omega bootstrapped CIs from
Determine if the bootstrapped CIs include ω.
Below are the specific simulation conditions investigated.
Number of items (k)
Past research on coefficient alpha has looked at various numbers of items ranging from 2 to 20 (Duhachek & Iacobucci, 2004; Enders, 2003; Maydeu-Olivares et al., 2007). To make the results here consistent for coefficient omega, the following number of items were selected: k = 5, 10, 15, and 20.
Item correlation type (ρ)
Three different item correlation structures
Item response categories (IRCs)
Four item response categories were investigated: 2, 3, 5, and 7. As noted above, none of the items were continuous. Item 4 above highlights the categories that were used.
Distribution type
Two different distribution types were investigated. When IRC = 2 (i.e., binary items),
Type 1: skewness = 1.70 and kurtosis = 0.88
Type 2: skewness = 0.41 and kurtosis = −1.83
The Type 2 distribution for binary categorization was studied by Maydeu-Olivares et al. (2007). When IRC = 3, 5, 7,
Type 1: skewness = 0 and kurtosis = 0.88
Type 2: skewness = 0.97 and kurtosis = −0.20
These two categorizations were studied by Maydeu-Olivares et al. (2007). The combination of number of items, item correlations, and item categorization created a range of .43 to .95 for ω.
Sample size (n)
The following typical sample sizes in behavioral/social science research were investigated: n = 50, 100, 150, 200, 250, 300. Duhachek and Iacobucci (2004) point out that
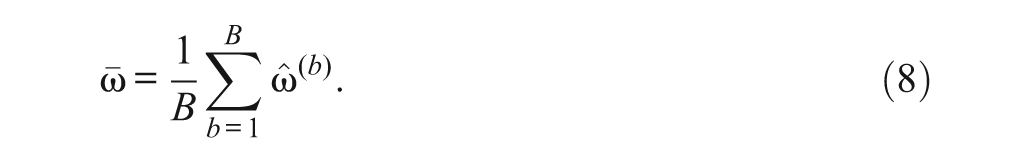
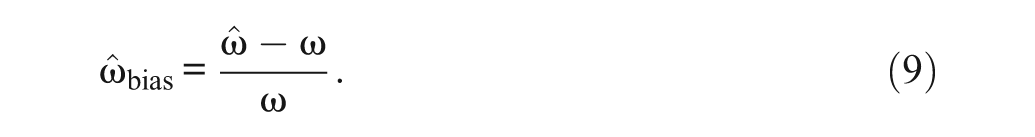
In each simulation replication, coefficient omega and corresponding quantities were estimated. Relative bias for coefficient omega was computed as
Here, the 100(1 −α)% CIs for coefficient omega were estimated from a total of 2,000 bootstrap samples, where
Results
Point Estimate Bias
The estimate of bias was investigated because it can have an impact on bootstrap CIs. However, all combinations of the simulation conditions were inspected and no noticeable bias was observed. By far, the largest bias was observed in four instances with the Type 1 distribution, binary items, and a sample size of 50. Specifically,
Confidence Interval Coverage
The NTB CI had the best performance in terms of coverage. However, the major impact on the CIs was sample size. Thus, the results are presented in the context of sample size. To preserve space, only tables for sample sizes of 50 to 150 will be presented because of the clear impact on CI coverage.
Sample size of 50
Here, the NTB CI was slightly impacted, but the PB and BCa CIs were heavily impacted. Results are presented in Table 1. For Type 1 distributions, the NTB CI only had 7 instances of unacceptable coverage with 5 binary items (7/576 = .012)
95% Coverage Probabilities for a Sample Size of 50.
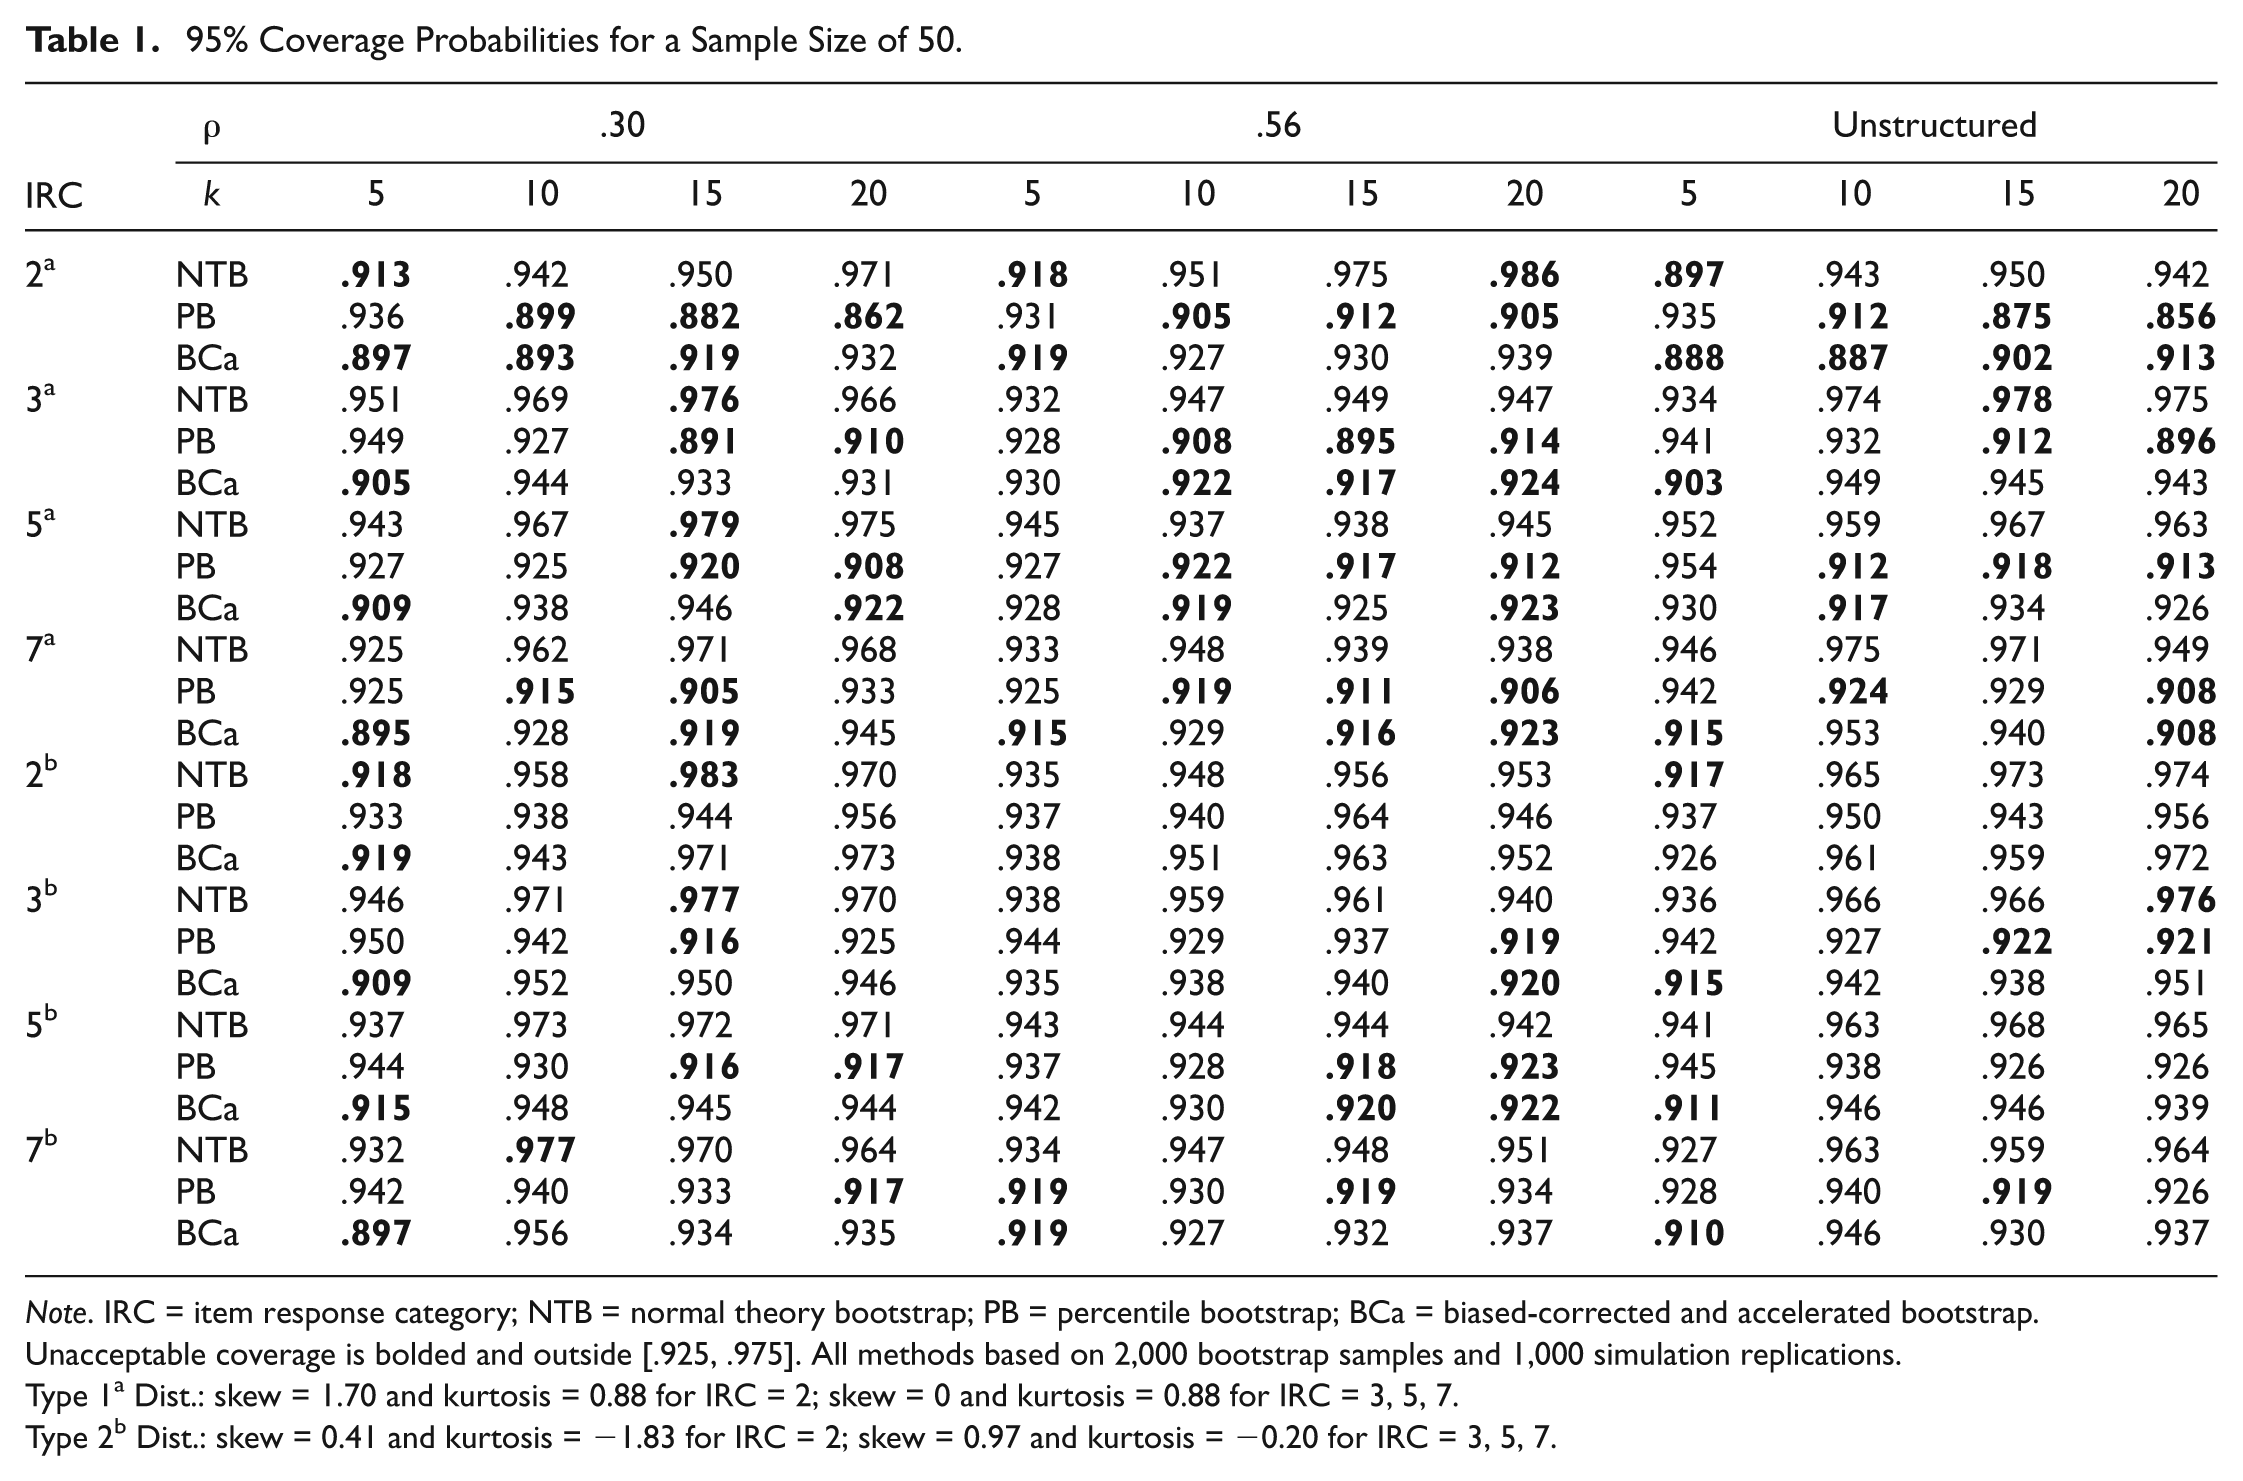
Note. IRC = item response category; NTB = normal theory bootstrap; PB = percentile bootstrap; BCa = biased-corrected and accelerated bootstrap. Unacceptable coverage is bolded and outside [.925, .975]. All methods based on 2,000 bootstrap samples and 1,000 simulation replications.
Type 1a Dist.: skew = 1.70 and kurtosis = 0.88 for IRC = 2; skew = 0 and kurtosis = 0.88 for IRC = 3, 5, 7.
Type 2b Dist.: skew = 0.41 and kurtosis = −1.83 for IRC = 2; skew = 0.97 and kurtosis = −0.20 for IRC = 3, 5, 7.
On the other hand, the PB and BCa CIs consistently had coverage below the acceptable range (42/576 = .073 and BCa = 36/576 = .063, respectively). Most of the impact occurred with Type 1 distributions (31/576 = .054 and 25/576 = .043, respectively), and mostly with binary items (9/576 = .016 and 8/576 = .014, respectively). With 3-, 5-, and 7-point Likert-type items, the PB and BCa CIs had sporadic unacceptable coverage.
With Type 2 distributions, the NTB CI had unacceptable coverage in 3 instances for binary items with a compound symmetric
Sample size of 100
At this sample size, the methods began to stabilize. Results are presented in Table 2. With Type 1 distributions, the NTB CI only had one instance of unacceptable coverage for 20 binary items with a compound symmetric correlation structure
95% Coverage Probabilities for a Sample Size of 100.
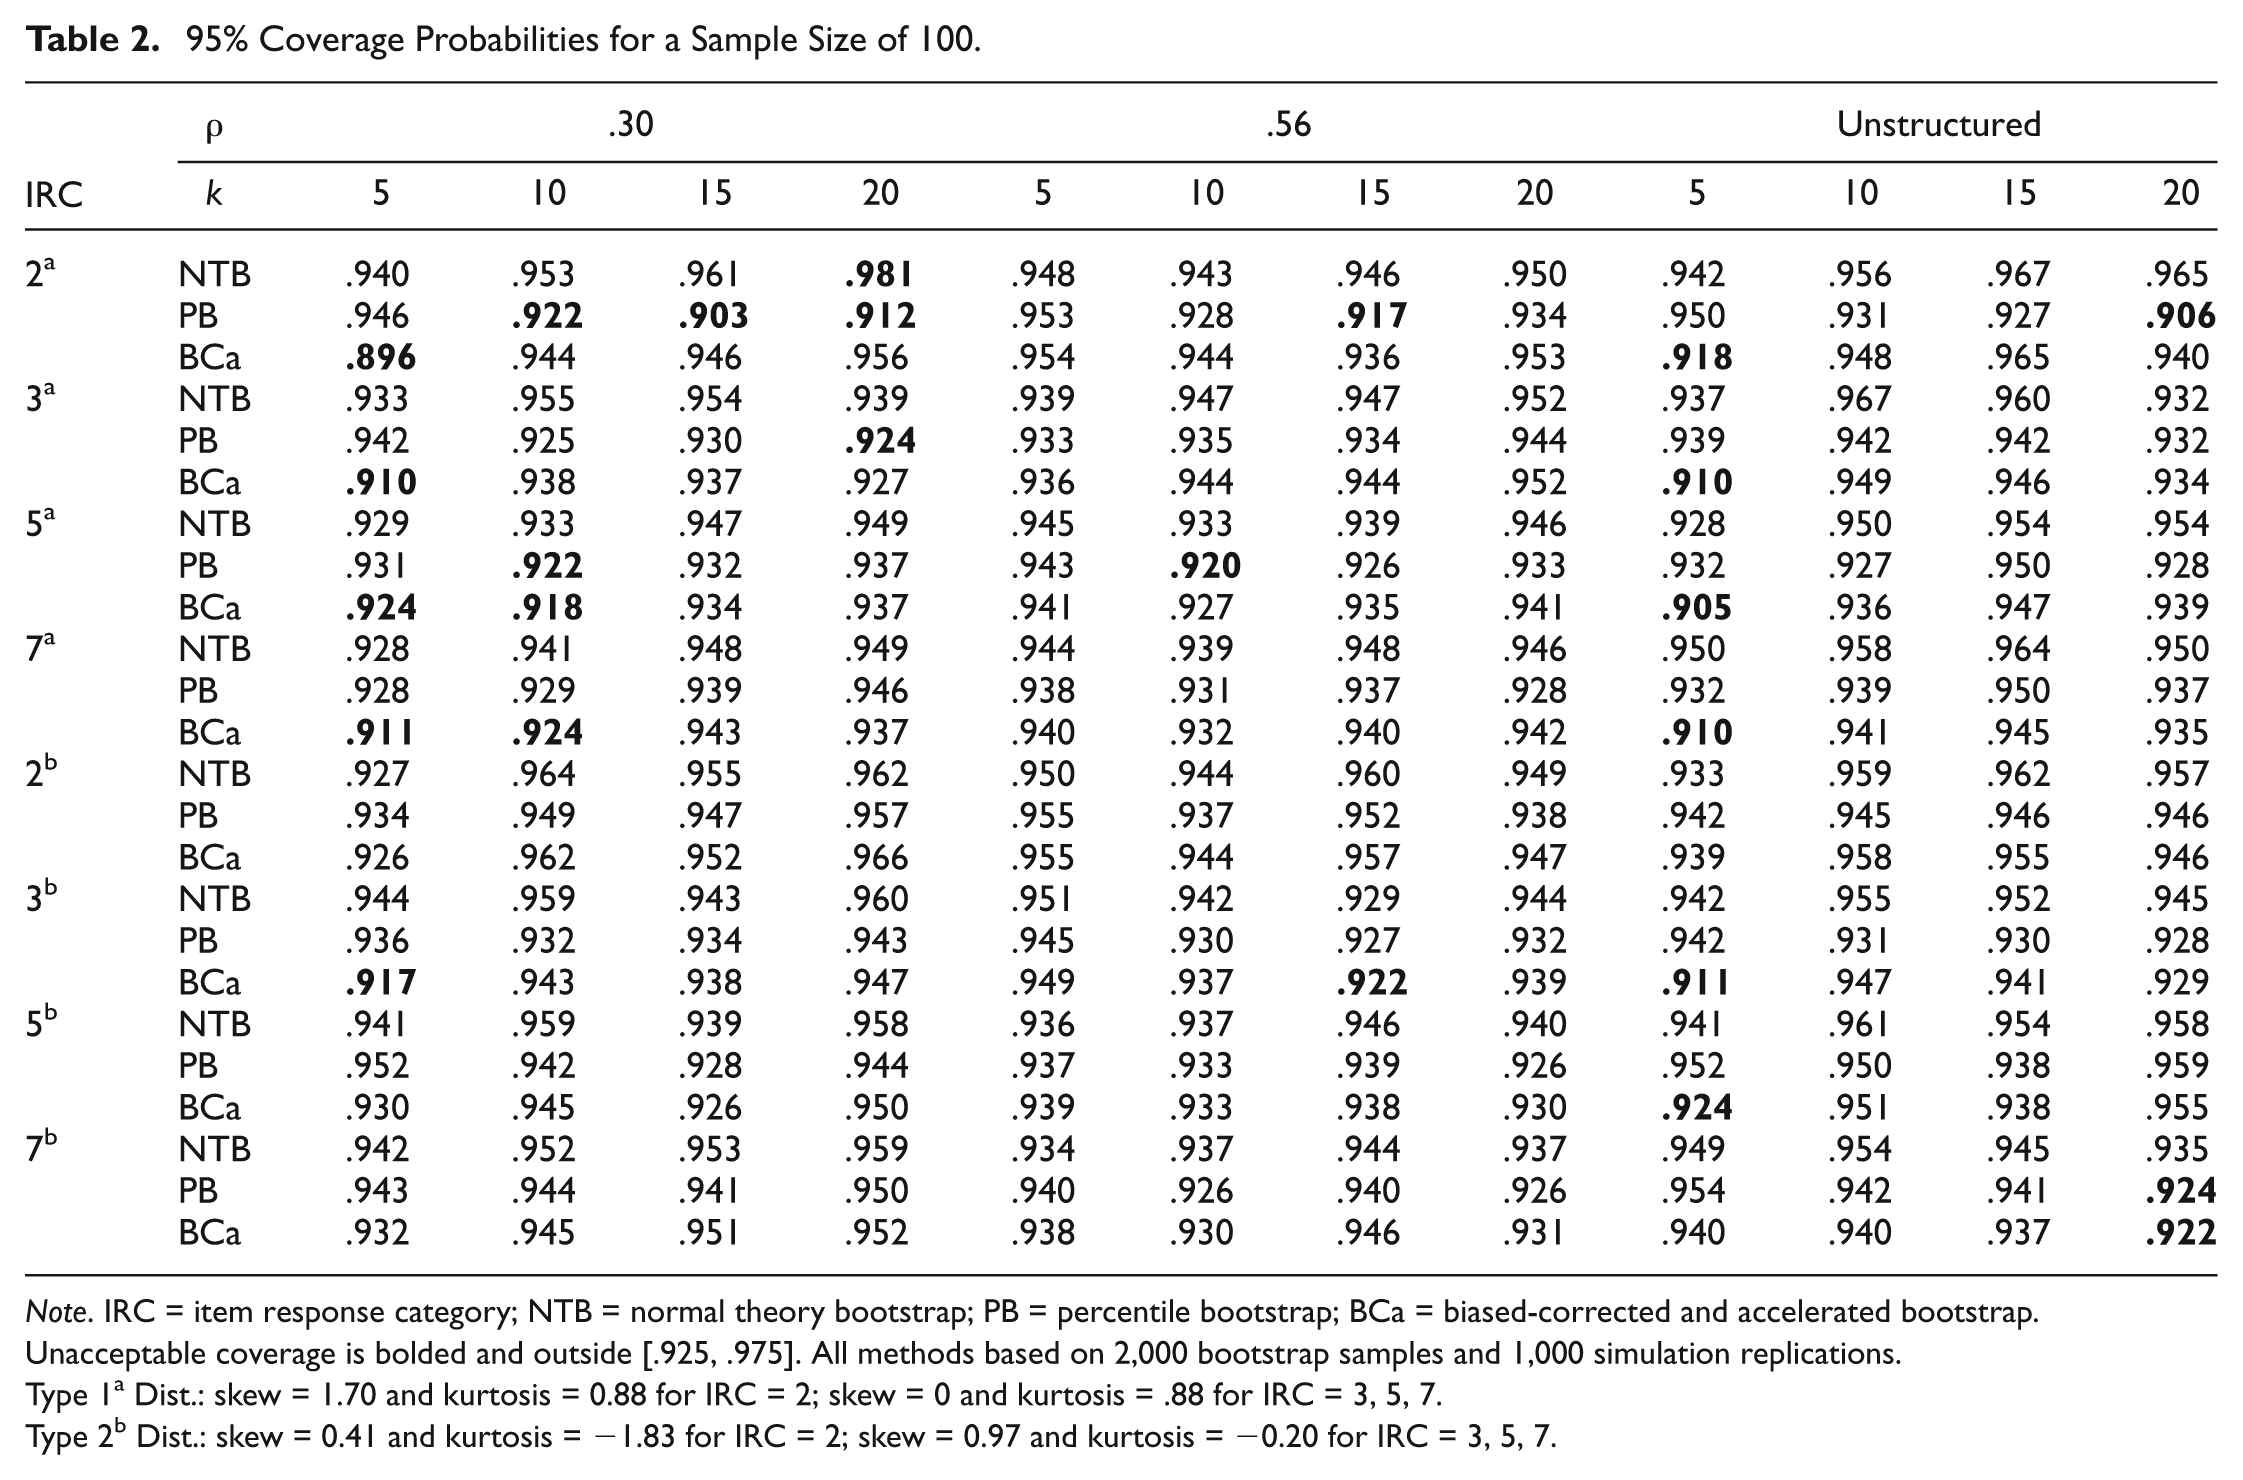
Note. IRC = item response category; NTB = normal theory bootstrap; PB = percentile bootstrap; BCa = biased-corrected and accelerated bootstrap. Unacceptable coverage is bolded and outside [.925, .975]. All methods based on 2,000 bootstrap samples and 1,000 simulation replications.
Type 1a Dist.: skew = 1.70 and kurtosis = 0.88 for IRC = 2; skew = 0 and kurtosis = .88 for IRC = 3, 5, 7.
Type 2b Dist.: skew = 0.41 and kurtosis = −1.83 for IRC = 2; skew = 0.97 and kurtosis = −0.20 for IRC = 3, 5, 7.
For Type 2 distributions, the PB CI had one instance of unacceptable coverage for 20 7-point Likert-type items with an unstructured correlation matrix. The BCa CI had 3 instances of unacceptable coverage for 5 items with a compound symmetric
For the remaining sample sizes, only the PB and BCa CIs were impacted.
Sample size of 150
With this sample size, only the PB and BCa CIs were impacted. Results are presented in Table 3. Here, most unacceptable coverage occurred with Type 1 distributions. For binary items, the PB CI had two instances of unacceptable coverage for 10 and 15 items with a compound symmetric correlation matrix
95% Coverage Probabilities for a Sample Size of 150.
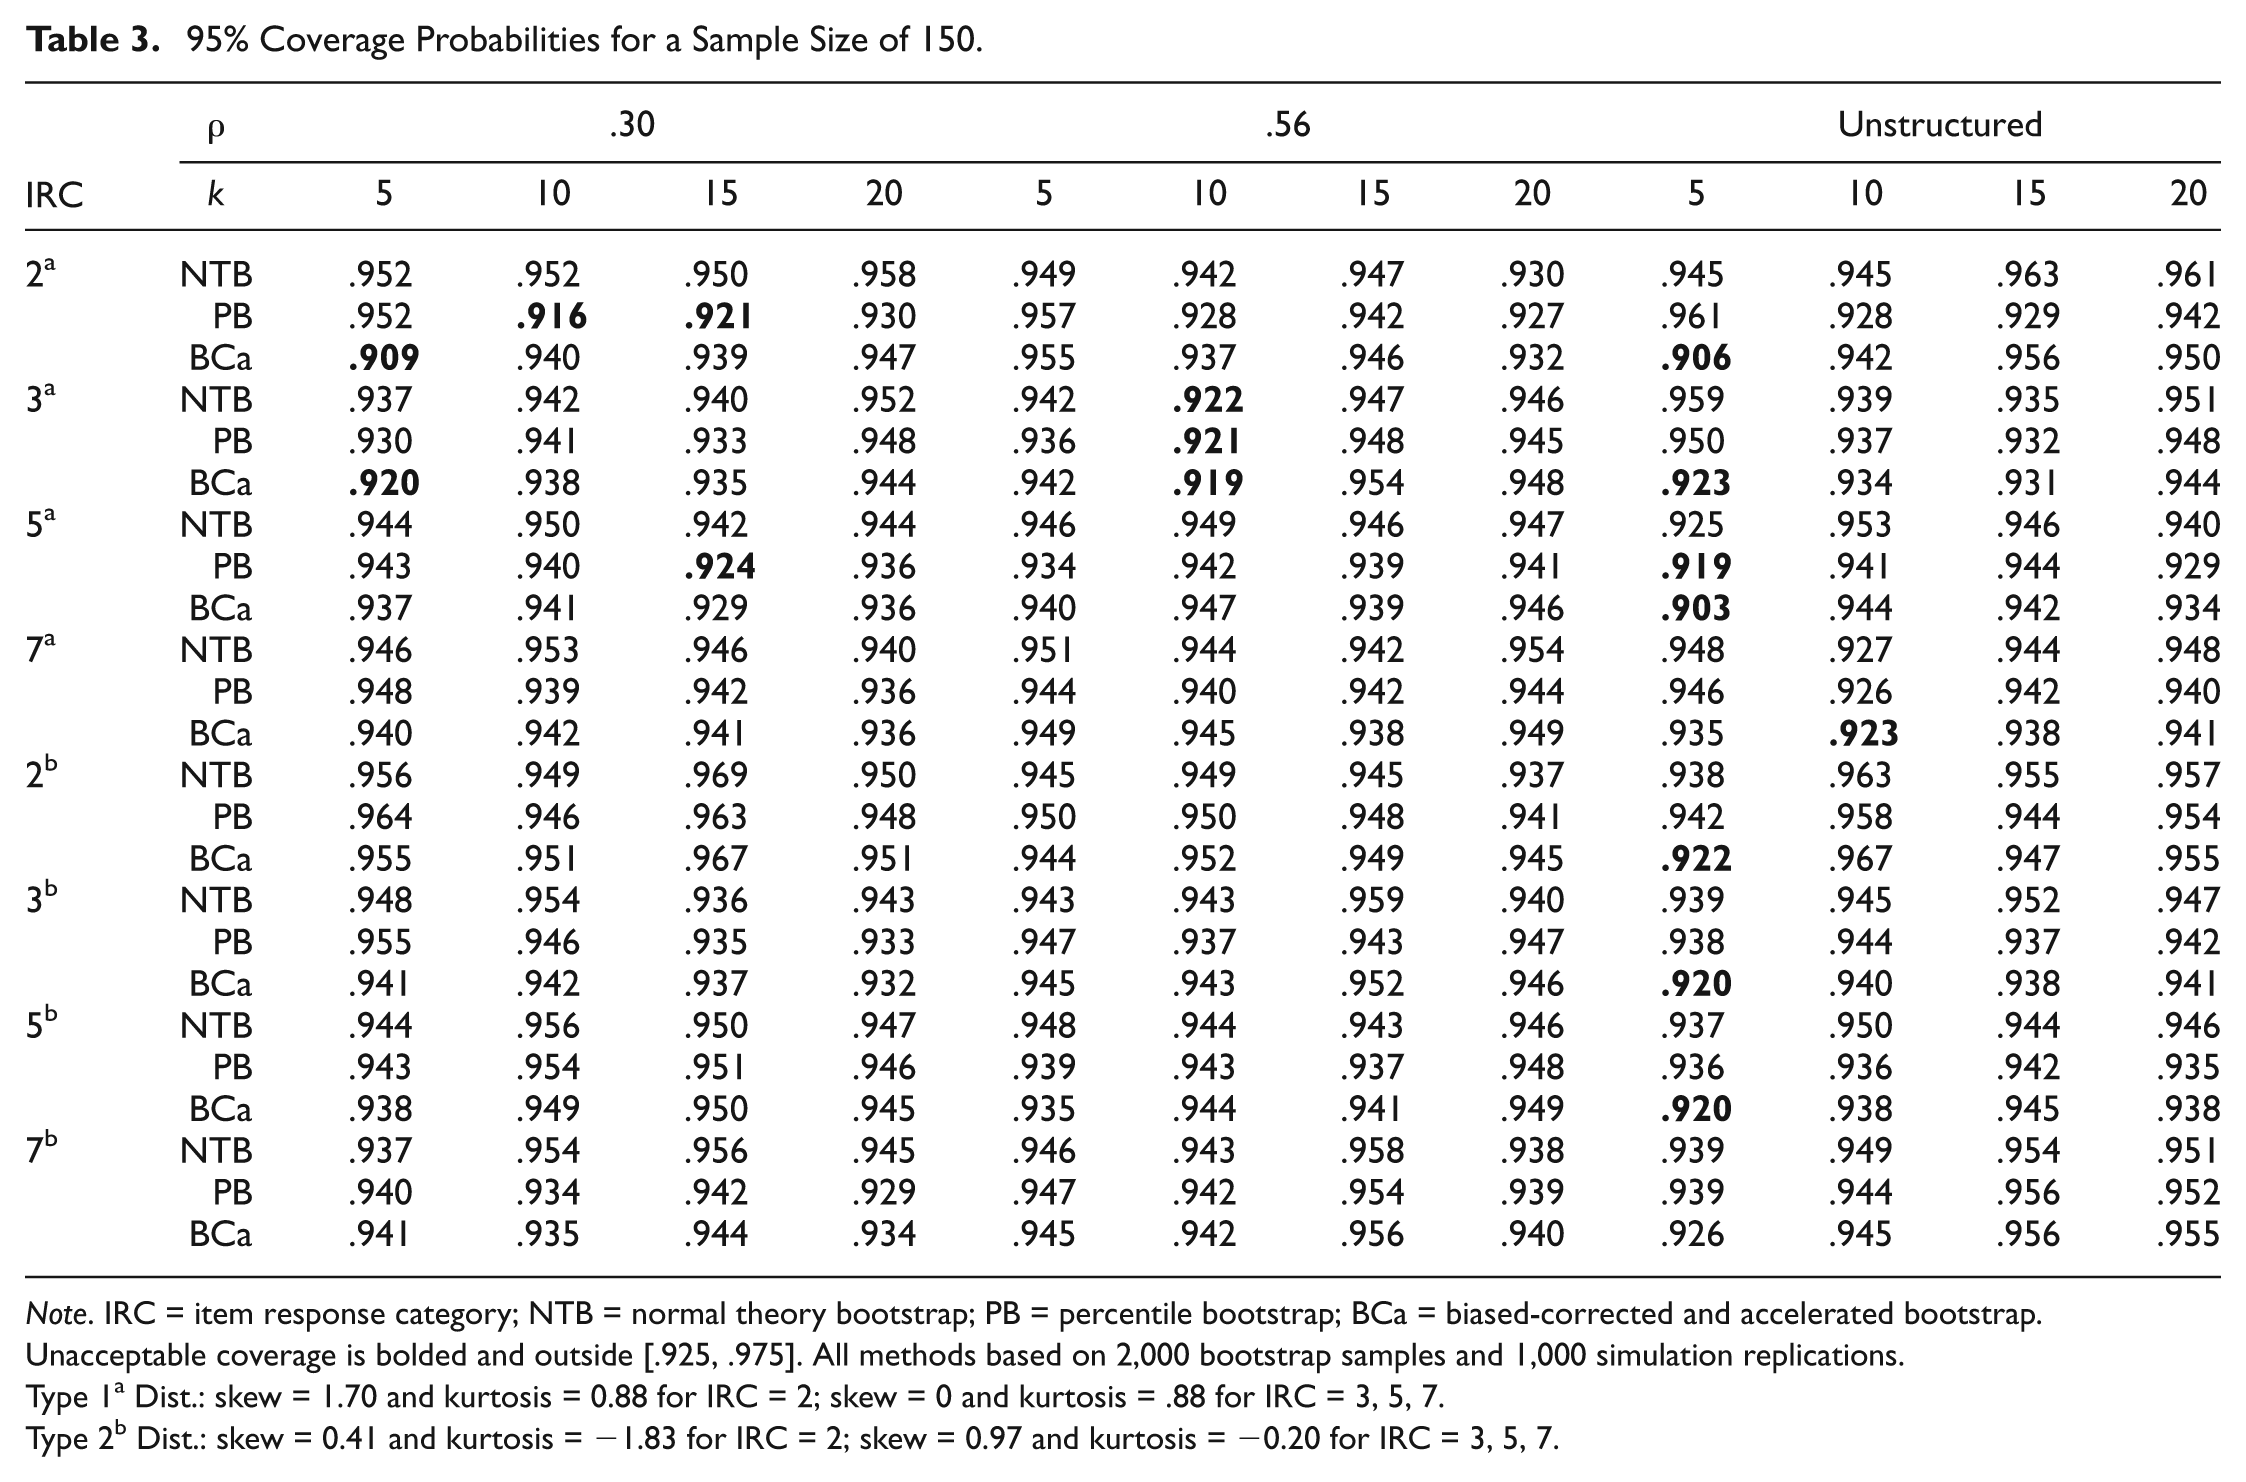
Note. IRC = item response category; NTB = normal theory bootstrap; PB = percentile bootstrap; BCa = biased-corrected and accelerated bootstrap. Unacceptable coverage is bolded and outside [.925, .975]. All methods based on 2,000 bootstrap samples and 1,000 simulation replications.
Type 1a Dist.: skew = 1.70 and kurtosis = 0.88 for IRC = 2; skew = 0 and kurtosis = .88 for IRC = 3, 5, 7.
Type 2b Dist.: skew = 0.41 and kurtosis = −1.83 for IRC = 2; skew = 0.97 and kurtosis = −0.20 for IRC = 3, 5, 7.
Only the BCa CI was impacted with Type 2 distributions. Specifically, the BCa CI had unacceptable coverage for 5 binary, 3-, and 5-point Likert-type items (3/576 = .005).
Sample size of 200
In this instance again, most unacceptable coverage occurred with Type 1 distributions. The PB CI had coverage probability of .919
With Type 2 distributions, the BCa CI had
Sample size of 250
Here, all unacceptable coverage occurred with Type 1 distributions. The PB CI had
Sample size of 300
In this situation, only a single instance of unacceptable coverage with Type 2 distributions occurred. Specifically, the BCa CI had
Figure 1 displays the 95% CI coverage for each CI method by sample size. The figure clearly displays the sample size impact. While all CIs had much variability with a sample size of 50, the PB and BCa CIs tended to have coverage below 95%. Another noticeable feature is that as the sample size increases all of the CIs stabilize within the acceptable coverage of

Distribution of 95% CI coverage for method by sample size.
Discussion
The NTB, PB, and BCa CI estimates for coefficient omega were investigated via a simulation study. The coefficient omega CI estimate considered in this simulation is for a composite of unidimensional (i.e., one factor or latent variable) congeneric items. To date, no study has thoroughly investigated the performance of CI estimates for composite reliability of unidimensional congeneric items. Of particular interest was the impact of nonnormality, Likert-type and binary items, and a sample size of less than 300. The results indicate that the NTB CI had the best coverage across all of the simulation conditions investigated. Even so, the major impact was sample size.
While the sample size impacted all three bootstrap CIs, it was most noticeable for the PB and BCa CIs. In general, all CIs underperformed when sample size was 50. However, the NTB CI was the best performing CI with only 8 instances of unacceptable coverage that tended to occur with 5 binary items. On the other hand, the PB and BCa CIs were heavily and negatively impacted with a sample size of 50. Most of the impact occurred with Type 1 distributions, mostly with binary items. Coverage was better with Type 2 distributions. However, the BCa CI was still underperforming with 5 items whereas the PB CI was impacted with 15 to 20 items.
When the sample size is 100 or more, with the exception of the NTB CI, coverage for the PB and BCa CIs began to stabilize. Here, the NTB CI had two sporadic instances of unacceptable coverage with a sample size of 100 and 150, respectively. With Type 1 distributions, the PB and BCa had several instances of unacceptable coverage, most of which occurred with binary items. With Type 2 distributions, there were fewer instances of unacceptable coverage for the PB and BCa CIs. However, the BCa CI tended to underperform with 5 items and an unstructured item correlation matrix.
One feature to note is that the CIs had issues with binary items under Type 1 distributions with a small sample size (n = 50). In this situation, the distribution had skewness = 1.70. In fact, this was the largest skewness in the simulation. This suggests that a sample size of 50 might be too small to provide and accurate estimate of the SE required for the NTB CI and the
Within the context of the simulation conditions investigated, there is a clear order of preference among the three proposed bootstrap CIs. The NTB CI had the best performance in that it had acceptable coverage under all but 16 simulation conditions (560/576 = .972). This was followed by the PB and BCa CIs, whose performance was similar to one another (516/576 = .896 and 508/576 = .882, respectively). A noticeable feature is that while all CIs tend to be slightly below 95%, the NTB CI is the most liberal and the PB CI most conservative. As mentioned above, all methods were impacted with a sample size of 50 with Type 1 distributed items, and in particular with binary items; however, the NTB CI was only impacted with 5 items. Even so, the PB and BCa CIs stabilized with a sample size of 100 or more. Therefore, the NTB CI can be used for sample sizes larger than 50. The NTB CI is still a good choice for a sample size of 50 so long as there are more than 5 items. If one does not wish to make the normality assumption about the ESD, then the PB CI for sample sizes of 100 or more or the BCa CI for samples sizes of 150 or more are good choices.
In spite of the promising results, more research is still warranted. One aspect future research can investigate is a comparison between the bootstrap CIs proposed here and the non-bootstrap CIs from previous research such as the delta based or the three-step methods with logit transformation (Raykov, 2012; Raykov & Marcoulides, 2011). The results here were assessed for three different correlations matrices of which two were compound symmetric; one correlation matrix was unstructured. However, it is unlikely that data will conform to a compound symmetric correlation matrix in applied settings. Thus, future research should investigate the impact of correlations matrices that deviate from compound symmetry on coefficient omega CI estimation. Last, missing data are a reality in the behavioral/social sciences. Therefore, another possible aspect to consider in future research is the impact of missing data.
Through the results provided here, four advantages can be pointed out regarding the application of the bootstrap CIs investigated. First, none of the investigated items were generated from a normal distribution. Second, none of the investigated items were continuous; all were Likert-type or binary. Third, all conditions were investigated with a sample size of 50 to 300. Last, the type of correlation structure did not have an impact. As such, coefficient omega appears to be appropriate for parallel and congeneric items.
In summary, the performance of three bootstrap CIs for coefficient omega was investigated under conditions not previously considered in published work. The focus was primarily on scenarios with nonnormal Likert-type or binary items. Such scenarios arise quite often in applied work (Micceri, 1989; Raykov, 2002). The results provide clear evidence in terms of performance between the three CIs investigated. The CIs discussed here are perhaps known and have been applied in other contexts. However, here it is shown how they can be applied to this particular problem, and more important, their performance under these less explored conditions is fully described. It is hoped that the results can guide researchers when they need to address this type of reliability problem.
Finally, interested readers can obtain a free and easy-to-use R function for the coefficient omega bootstrap CIs investigated here with example data by visiting the corresponding author’s website (www.omegalab-padilla.org).
Footnotes
Declaration of Conflicting Interests
The author(s) declared no potential conflicts of interest with respect to the research, authorship, and/or publication of this article.
Funding
The author(s) received no financial support for the research, authorship, and/or publication of this article.