
Abstract
Even though there is an increasing interest in response styles, the field lacks a systematic investigation of the bias that response styles potentially cause. Therefore, a simulation was carried out to study this phenomenon with a focus on applied settings (reliability, validity, scale scores). The influence of acquiescence and extreme response style was investigated, and independent variables were, for example, the number of reverse-keyed items. Data were generated from a multidimensional item response model. The results indicated that response styles may bias findings based on self-report data and that this bias may be substantial if the attribute of interest is correlated with response style. However, in the absence of such correlations, bias was generally very small, especially for extreme response style and if acquiescence was controlled for by reverse-keyed items. An empirical example was used to illustrate and validate the simulations. In summary, it is concluded that the threat of response styles may be smaller than feared.
Introduction
There exists the widespread claim and fear that response styles—such as acquiescence response style (ARS) or extreme response style (ERS)—distort results based on self-report data. The goal of the present simulation study was to present data rather than claims and to scrutinize the effect of response styles. The study covered three scenarios of a prototypical psychological research process, namely, estimating the reliability of a scale, testing its validity via correlations, and assigning a score to every respondent. To closely mirror situations in the applied field, the simulated data were analyzed using basic procedures (e.g., Cronbach’s alpha) without trying to control for response styles. The data generating model, however, was a rather complex item response model that allowed to flexibly cover a variety of conditions.
Response Styles
Response styles are defined as the tendency to respond to questionnaire items irrespective of content (cf. Nunnally, 1978). This does not imply that the subject matter is irrelevant to the respondent, but indicates that response styles act independently of content and that both sources influence the actual response. This theoretical notion is supported by empirical evidence showing that response styles are stable across content domains (e.g., Weijters, Geuens, & Schillewaert, 2010a; Wetzel, Carstensen, & Böhnke, 2013). Moreover, it is well documented that response styles are stable within a questionnaire as well as across periods of several years (e.g., Aichholzer, 2013; Weijters, Geuens, & Schillewaert, 2010b).
Response styles represent a source of interindividual variance—additional to the content-related variance—that is usually not taken into account in analyses of self-report data, at least in more applied settings. There seem to be three different viewpoints on the matter. First, probably the majority of practitioners and researchers ignore response styles, because they do not know enough about them or cannot implement (statistical) control for one reason or another. Second, some take the position that response styles are negligible because this source of variance is small, represents error variance, or is trifling compared to content (e.g., Rorer, 1965; Schimmack, Böckenholt, & Reisenzein, 2002). Third, many researchers believe that response styles are a serious threat to the quality of self-report data that potentially influence all kinds of measures scientists usually draw conclusions from. For example, Eid and Rauber (2000) stated that “differences in category use can distort the results” (p. 21). Likewise, Weijters et al. (2010b) wrote that “response styles have been found to bias estimates of means, variances, and correlations . . ., leading to potentially erroneous results and conclusions” (p. 96).
Although individual findings support the impression that response styles form a severe threat, the literature lacks a systematic investigation of the amount of bias and the conditions under which bias occurs. Simulation studies are well suited to address this issue, because they allow a comprehensive analysis of a specific effect (e.g., of response styles) while having full control over all other influences. However, there are only very few studies published that attempt to look at response styles from the perspective of a simulation study. Heide and Grønhaug (1992) published a simulation in a marketing journal and found biasing effects of ARS and ERS, but their methodological approach was rather basic from today’s perspective. The article of Ferrando and Lorenzo-Seva (2010) also contains a simulation study on ARS with a limited range of conditions finding that ARS can bias results, but that this bias is minor for most practical purposes, at least with fully balanced scales (i.e., equal number of regular and reverse-keyed items). Savalei and Falk (2014) found that substantive factor loadings were only affected by ARS when its influence was strong. Wetzel, Böhnke, and Rose (2015) investigated trait recovery of different methods, which aim to control for ERS, and stated, “The results of our simulation study imply that ignoring ERS on average hardly affects trait estimates if ERS and the latent trait are uncorrelated or only weakly correlated” (p. 17).
Statistical Models for Response Styles
A multitude of models to measure and/or control for response styles have been proposed, which vary greatly in terms of their objectives, requirements, and complexity (cf. Van Vaerenbergh & Thomas, 2013). For example, in confirmatory factor analysis, an additional acquiescence factor can be used to analyze scales composed of both regular and reverse-keyed items (e.g., Billiet & McClendon, 2000). Different routes have been pursued in the family of item response theory (IRT). For example, mixture distribution Rasch models have been applied with the result that a 2-class solution could be interpreted as comprising nonextreme and extreme respondents (e.g., Eid & Rauber, 2000; Meiser & Machunsky, 2008; Wetzel et al., 2013). Böckenholt (2012) proposed a multidimensional IRT model in which the original response is separated into content- and response style–related processes using dichotomous pseudoitems (cf. De Boeck & Partchev, 2012; Khorramdel & von Davier, 2014; Plieninger & Meiser, 2014). Another multidimensional IRT model, namely, a variant of Bock’s nominal response model, was developed by Bolt and colleagues (Bolt & Newton, 2011; Johnson & Bolt, 2010) and further extended by Falk and Cai (2016). Furthermore, multidimensionality arising from random thresholds is accounted for in models suggested by Wang (e.g., Jin & Wang, 2014).
Most of the models proposed so far focus on only one response style and cannot be modified to accommodate another one. However, Wetzel and Carstensen (2015) recently proposed an approach in the framework of multidimensional Rasch models that allows to take into account both ARS and ERS.
Multidimensional Rasch Models
Multidimensional Rasch models date back to Georg Rasch (1961) himself and have, since then, been presented in multiple ways. Herein, the notation of Adams, Wilson, and Wang (1997), who call their approach multidimensional random coefficients multinomial logit model, is adapted. Therein, it is assumed that—possibly multiple—latent variables drive the item responses in an additive manner. The model has only one type of item parameter, namely, a difficulty parameter, which herein—for the sake of simplicity—was parametrized using a rating scale model approach (cf. Andrich, 1978), but other versions of the model for ordinal and binary items exist. In the current study, it is furthermore assumed that a symmetric, bipolar response format is used (e.g., ranging from strongly disagree to strongly agree).
Assume we have item i (
Both the item parameters and the person parameters are mapped onto the category probabilities using a design matrix

The weight of category k of item i on each of the dimensions is defined by the row vector
Then, the probability of a response falling in category k of item i is modeled as

where
Multidimensional Rasch Models for Response Styles
Previously, multidimensionality within items has been investigated in situations where items measure more than one dimension at a time (cf. Adams et al., 1997). Wetzel and Carstensen (2015) extended the idea of within-item multidimensionality noting that not all of the latent dimensions need necessarily be related to the content of the items, but could also be related to, for example, response styles. This, in turn, requires different weights composing the matrix

For ERS, the direction (agreement vs. disagreement) of the response is still governed by the first, content-related dimension alone; however, the extremity of the response may be altered by ERS. Contrarily, ARS may alter the direction of the response and may lead to, for example, agreement with both regular and reverse-keyed items.
In summary, multidimensional Rasch models are an interesting alternative to existing response style models. First, the model is very flexible: Various forms of response styles can be implemented; the only restriction is to find sensible weights for the matrix
The Present Research
The present simulation study aimed to scrutinize the claim that response styles threaten the results of self-report data, especially so in applied settings. In more detail, the idea was to simulate data using the framework introduced above, to subsequently ignore response styles during data analysis (as is often done in the field), and finally to quantify the bias introduced by ARS or ERS. In order to cover a variety of settings, three different scenarios resembling prototypical steps of a research process were designed. First, Cronbach’s alpha is arguably the most prominent measure of the reliability of a set of items, and it was investigated whether response styles would bias this measure (and how much). Second, the validity of a scale is often assessed using the correlation of two scale scores, and it was again investigated whether response styles would bias this measure (and how much). Third, the ultimate goal of assessment is to assign a score to every person. The accuracy of this was investigated (a) using correlations of true and observed scores and (b) by comparing the rank order of persons with and without response styles. In other words, it was examined how response styles may influence a decision (e.g., in health, education, work) that is based on self-report data. The analyses in all three scenarios employed raw score–based measures derived from classical test theory—for the reason that those measures are heavily used in applied research. This simulation study went beyond previous work in that the influence of both ERS and ARS was investigated under a wide range of conditions. Furthermore, the results of the simulation were verified and illustrated with an empirical example.
Method
Simulation Design and Setup
The simulation model had D dimensions comprising the attribute(s) of interest,

If
In order to manipulate the amount of response style variance relative to substantive variance,
Each replication entailed 200 persons and 10 items per attribute.
2
The number of categories was not varied and set to five (but see the Appendix). The number of reverse-keyed items was varied between zero and five per attribute. In each replication, the item location parameters
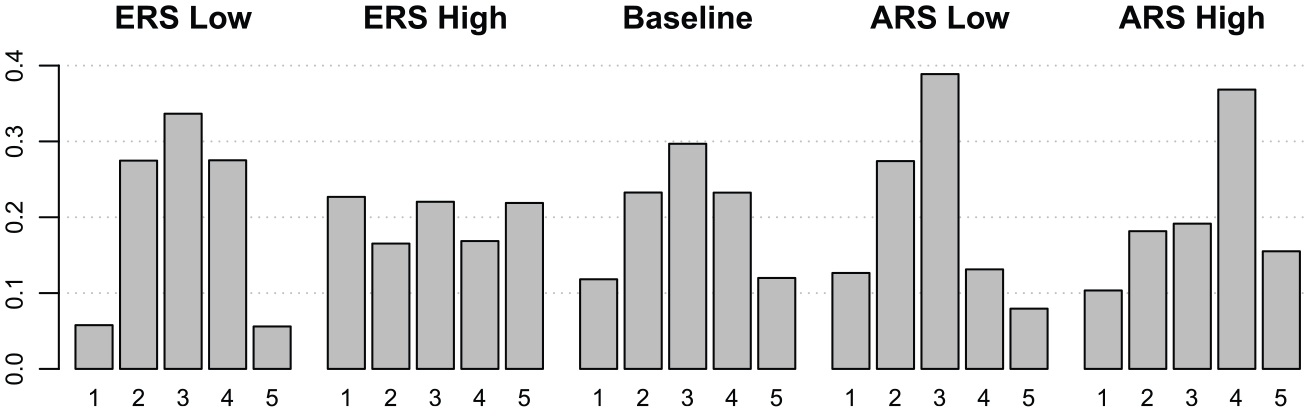
Illustration of the effect of response styles (
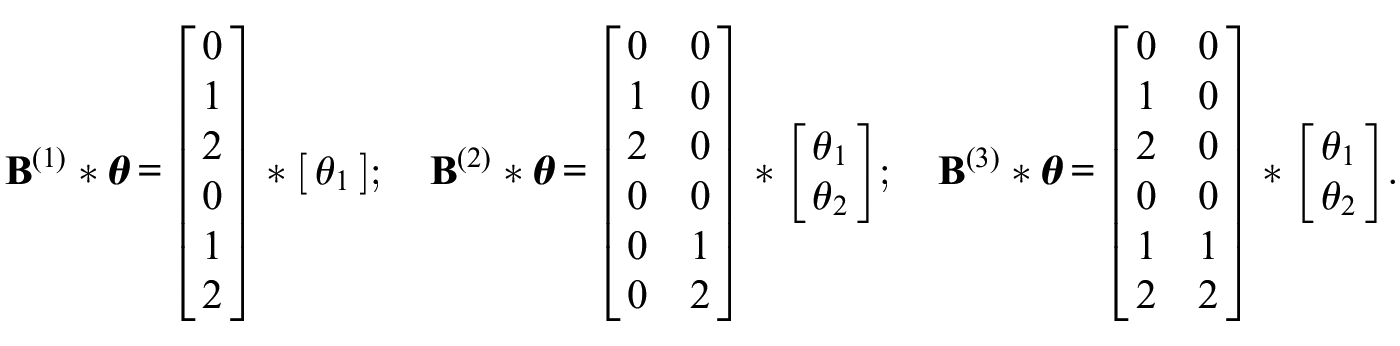
The scoring matrix

Dependent Variables
In the first scenario, Cronbach’s alpha was used as an estimate of the reliability of a set of items. To compare this value to a response style-free measure, we made use of the concept of covariate-free reliability recently introduced by Peter Bentler (2015). He proposed a measure of covariate-free alpha, which controls Cronbach’s alpha for the influence of a covariate (i.e., response styles in the present case) via partialing. 4 The actual dependent variable that was used in the analyses was the amount of bias, that is, the difference between Cronbach’s alpha and covariate-free alpha.
In the second scenario, a scale score
In the last scenario, the true person parameters
Results
The results are based on 100,000 replications for each simulation. In each single replication, the values of all variables were randomly and independently drawn. The simulations and analyses were conducted in R 3.2.1 (R Core Team, 2015). 5
An overview of the average bias with respect to Cronbach’s alpha (upper panel) and a correlation coefficient (lower panel) for selected conditions is given in Figure 2: ARS led to more bias compared to ERS, more reverse-coded items reduced bias, and more response style variance led to more bias. Furthermore, bias rarely exceeded levels of .05 if the attribute(s) and the response style were uncorrelated, but the opposite was true if the attribute(s) and the response style were moderately correlated. This figure gives already instructive insights, and more detailed results are reported in the following sections. In line with recommendations, for example, by Harwell (e.g., Harwell, Stone, Hsu, & Kirisci, 1996), it was chosen to refrain from presenting full-page tables with descriptive results. Rather, the results of each simulation were submitted to a regression model, which facilitates interpretation and makes it easier to detect effects of higher order. Unstandardized (b) and standardized (b*) regression coefficients are reported.
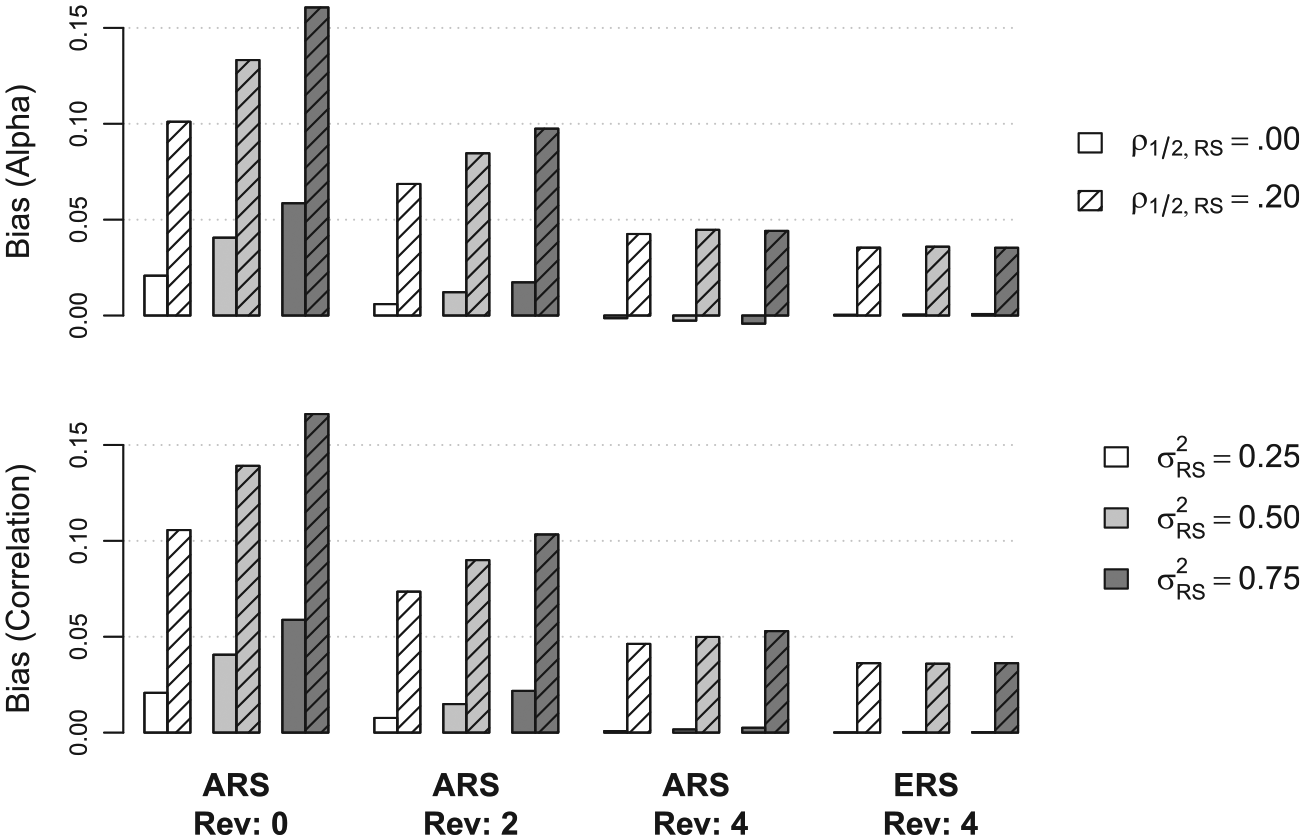
Overview of average bias with respect to Cronbach’s alpha (upper panel) and the correlation of two scale scores (lower panel).Note. Results are based on 1,000 replications in each of the selected conditions.
Estimating the Reliability of a Scale in the Presence of Response Styles
Acquiescence
Two regression models were fit to the simulation results, one without and one with higher order terms (see Table 1), and the following interpretation is based on the correctly specified, second model. Overall, the intercept indicated that—on average—the estimated alpha coefficient (which was .88) slightly overestimated the reliability by .01. Bias increased when fewer reverse-keyed items were used and when ARS variance was higher. Moreover, the substantive linear and quadratic effects of
Effect of Response Styles on Cronbach’s Alpha as a Function of Reverse-Keyed Items and Joint Distribution of Attribute and Response Style.
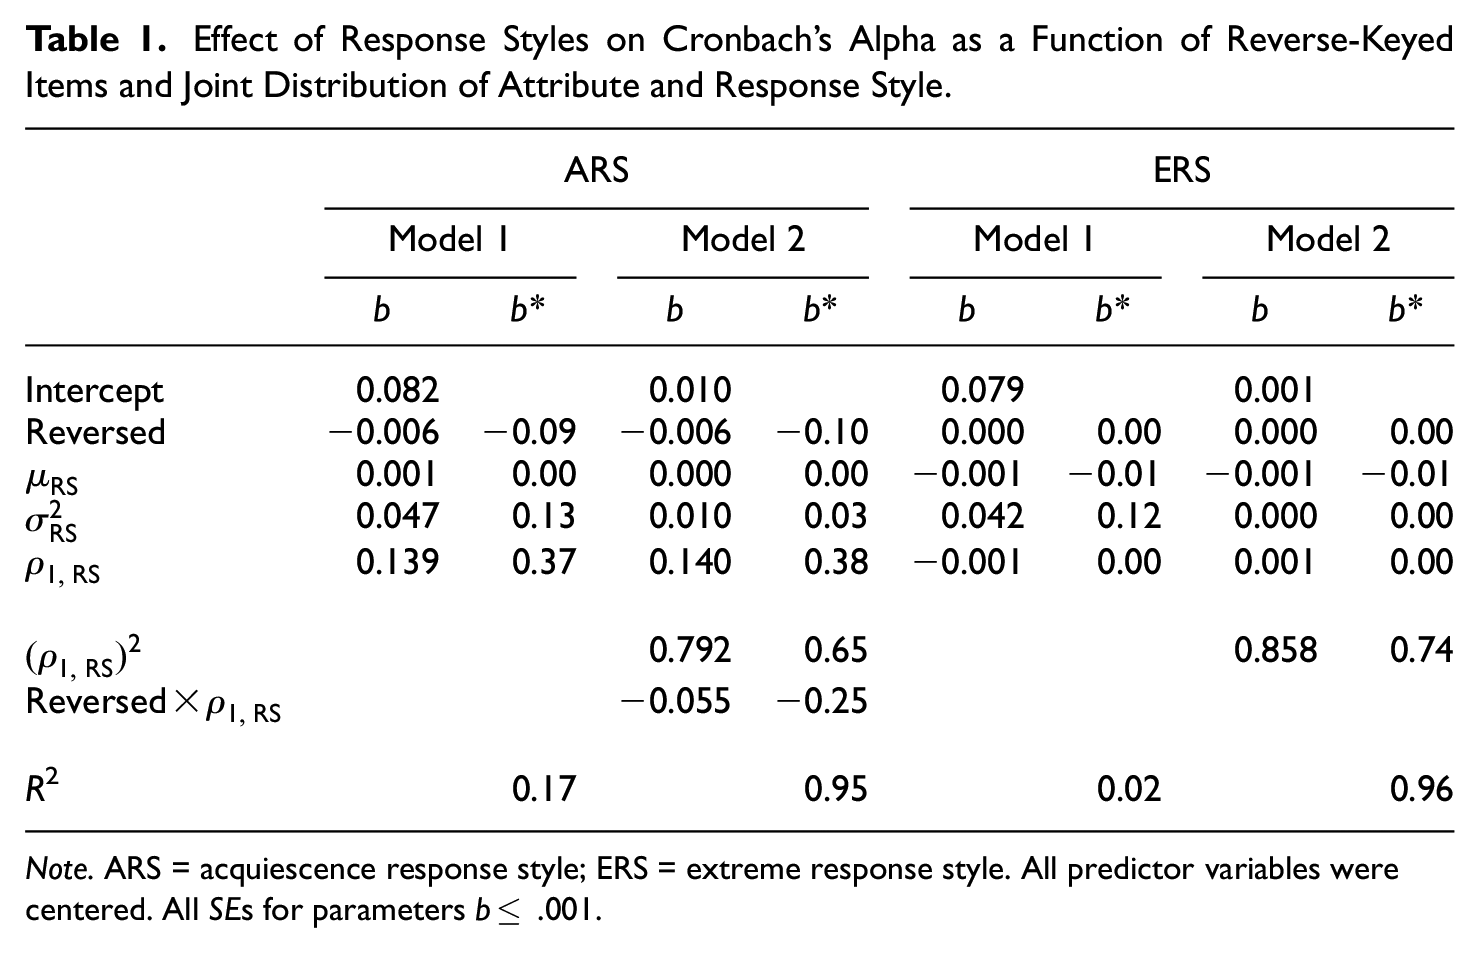
Note. ARS = acquiescence response style; ERS = extreme response style. All predictor variables were centered. All SEs for parameters b≤ .001.

Effect of ARS and ERS, respectively, on Cronbach’s alpha.Note. Plotting region was restricted to
Extreme Response Style
This simulation focused on the effect of ERS on Cronbach’s alpha. The intercept was virtually zero (Model 2), indicating that Cronbach’s alpha was almost unbiased if
Estimating the Correlation of Two Scales in the Presence of Response Styles
In addition to the previous scenario, the simulations now entailed further independent variables, namely, the correlation of the two attributes (
Acquiescence
The results in Table 2 indicated that the actual correlation was, on average, slightly overestimated by a value of .01 when acquiescence was ignored as indicated by the intercept. Mirroring the results presented above, this bias became larger when fewer reverse-keyed items were employed and when ARS variance increased. Again, the center of the ARS distribution had no impact. Additionally, the negative slope of the true correlation between the two attributes indicated that bias became smaller the more positive the true relationship became. This is due to the fact that ARS makes correlations more positive, and the impact of this decreases the more positive the true correlation of the attributes already is. Note that this effect is only interpretable in the correctly specified, second model (see Table 2).
Effect of Response Styles on Scale Score Correlation as a Function of Reverse-Keyed Items and Joint Distribution of Attributes and Response Style.

Note. ARS = acquiescence response style; ERS = extreme response style. All predictor variables were centered. All SEs for parameters b≤ .001.
The second model revealed several interaction effects. The most important one was the interaction between the two attribute–ARS correlations (

Effect of ARS and ERS, respectively, on the correlation of two scale scores.Note. Plotting region was restricted to
Extreme Response Style
The previous simulation was repeated focusing now on ERS, and the results are displayed in Table 2. Both regressions indicated that bias was, on average, virtually zero. Moreover, none of the first-order predictors explained a substantial amount of variance. However, the interaction between the two attribute–ERS relationships was again large, which mirrors the quadratic effect (of
Estimating Respondents’ Scale Scores in the Presence of Response Styles
In the final scenario, the effect of response styles on respondents’ scale scores was investigated. The previous results already revealed that response styles can affect the relationship between observed and true scores (i.e., the reliability)—and this is of course due to distorted scores of respondents. The following simulations were intended to show a more fine-grained picture at the level of individual scores, because these are often the final goal in many situations. This made it necessary to reduce the complexity of the simulation design in order to keep the presentation of the results concise. Therefore, an extreme condition with
The results (i.e., correlations, TPR, FPR, and accuracy) are depicted in Figure 5. Even in the absence of response styles (depicted in gray), there was some natural discrepancy between the observed scales scores,
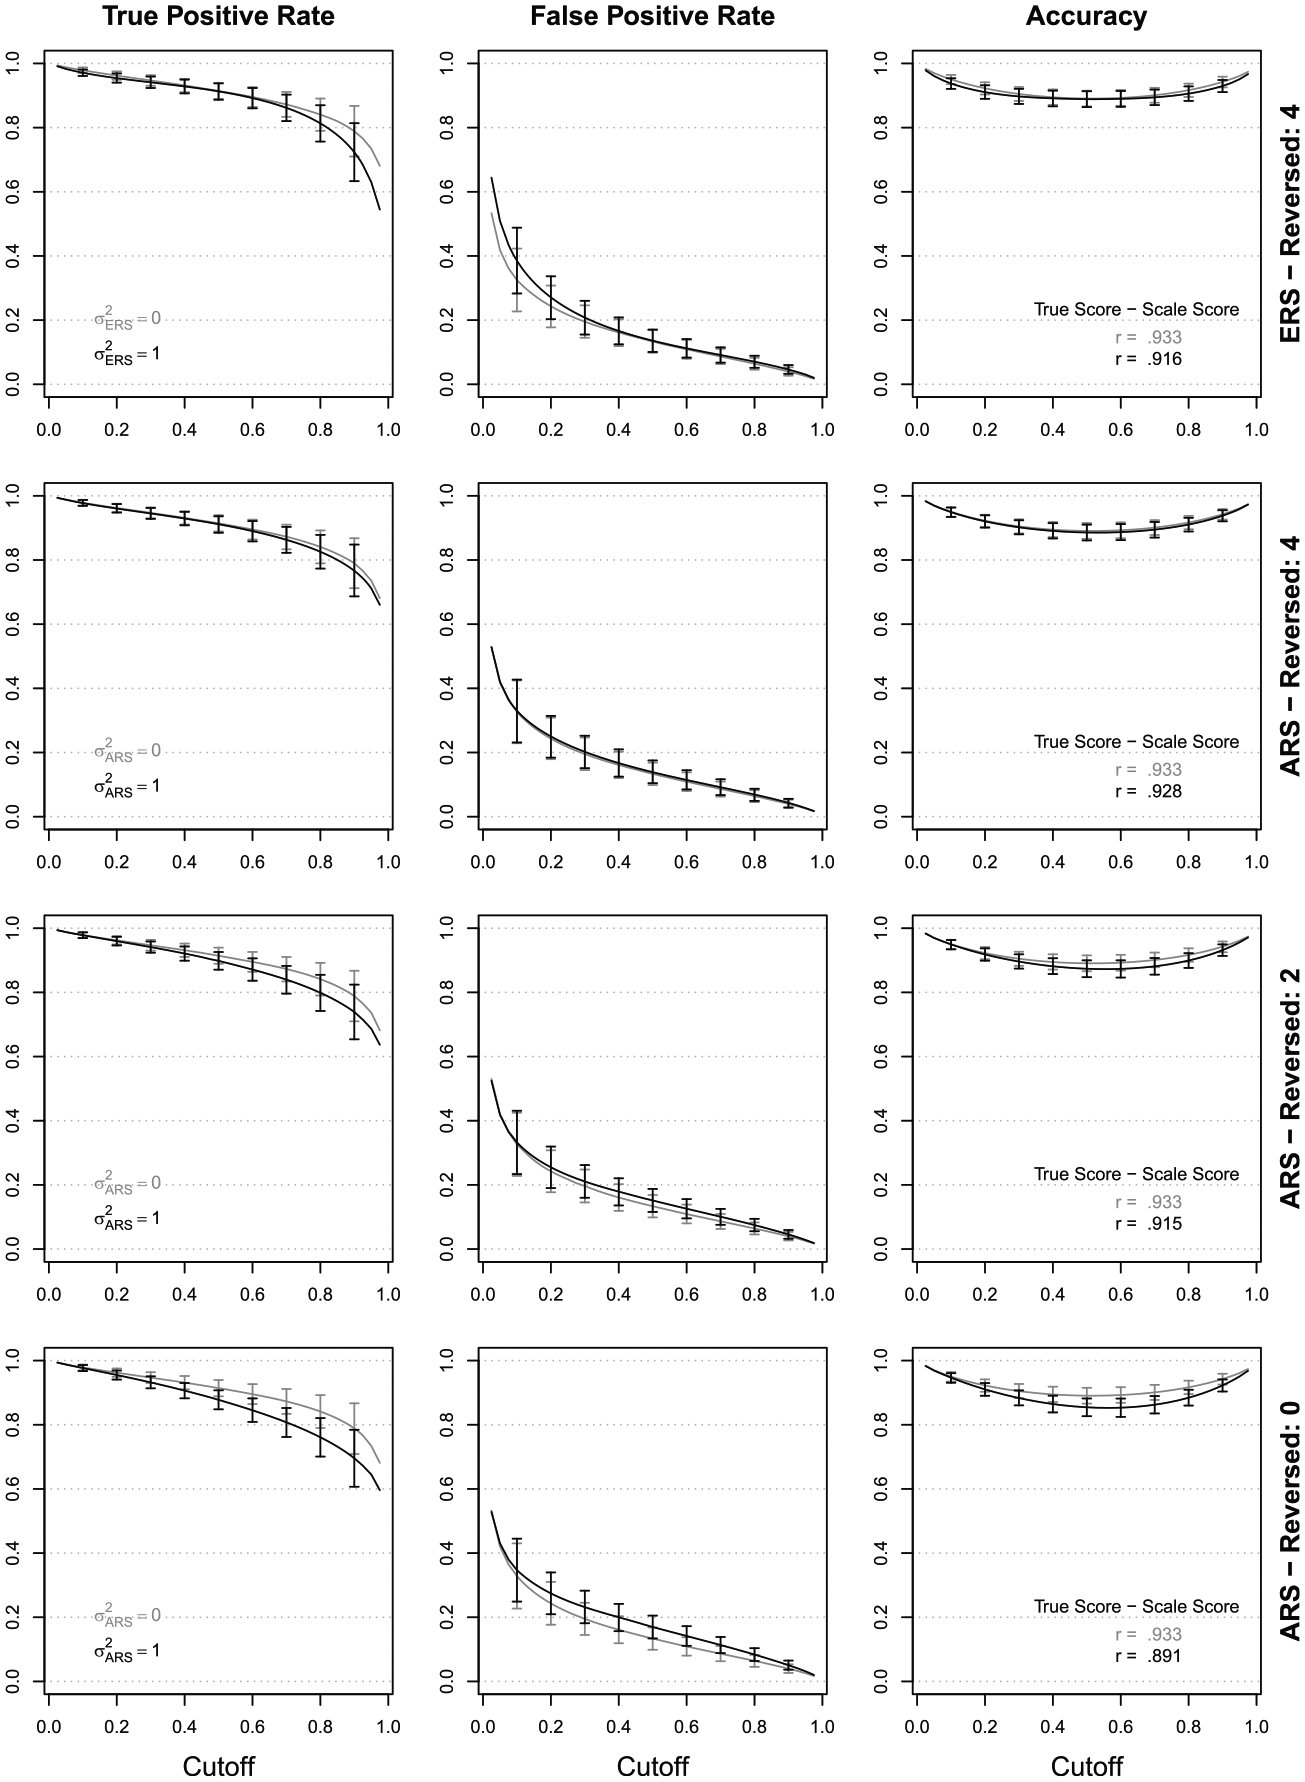
Influence of ERS and ARS on the classification of respondents, which is mirrored in the difference between the baseline condition without response styles (in gray) and the response style condition (in black).Note. The lines represent the mean across all replications at a given cutoff value, error bars represent standard deviations.
The effect of ERS and ARS, respectively, is mirrored in the difference between the response style condition (displayed in black) and the baseline condition (displayed in gray). In the uppermost panel of Figure 5, the influence of ERS is depicted, and the results indicated that ERS was problematic with respect to the TPR when selecting the highest performing individuals. For example, the TPR dropped from .84 to .81 at
The results for ARS with four, two, and zero reverse-keyed items are displayed in the three lower panels of Figure 5. All three measures were impaired in the presence of ARS, the more so the less reverse-keyed items were used. For example, with zero reverse-keyed items at c = .80, the TPR was only .76 (compared to .84 in the baseline condition), the FPR increased to .08 (compared to .06), and the accuracy was .88 (compared to .92). However, this effect was substantially reduced when using two or even four reverse-keyed items. In the latter case, ARS had virtually no effect at all. Note that the slight asymmetry in the impact of ARS (i.e., higher impact in the upper range of the scale) is simply due to an odd number of categories (ARS contrasts two agree categories with three non–agree categories) and would disappear with an even number of categories.
Taken together, even though only an extreme condition—response style variance equal to content variance—was investigated herein, the effect of response styles was once again rather minor. This was especially true with respect to ERS and with respect to ARS controlled for by reverse-keyed items.
An Illustrative Example
An empirical data set from Jackson (2012) was analyzed in order to illustrate the effects of response styles in real data and to check whether the parameter values chosen in the simulations were reasonable. Respondents that were older than 80 (n = 12) or with unclear sex (n = 56) were excluded. Furthermore, 23 cases were removed because these persons showed no variability in the chosen response option across more than 25 subsequent items. The final data set included 8,745 persons who provided responses to 50 Big Five items. Openness, Conscientiousness, Extraversion, Agreeableness, and Emotional Stability were measured by ten 5-point items each (including 3, 4, 5, 4, and 8, respectively, reverse-coded items). Two models were fit to the data using a partial credit model parametrization
6
: Model 1 comprised one dimension for each of the five scales (between-item multidimensionality), and Model 2 included two additional dimensions for ARS and ERS, respectively, that where each measured by all 50 items. The model was fit using the R package
Model 2 had 13 parameters more than Model 1 (2 variances, 11 covariances) and was clearly superior in terms of model fit (e.g., BIC values of 1,130,022 for Model 1 and 1,093,083 for Model 2). The estimated item parameters of the two models were highly similar,
In summary, these results indicated that controlling for response styles increased model fit and led to different parameter values. However, these differences were rather small. Apart from that, the response style variances and covariances were in the range of the values chosen in the simulation above (with the only, small exception being
Discussion
There is an increasing interest in response styles, and many models to measure and control for response styles have been developed. The justification for this research activity is—partly—the belief that not taking response styles into account would distort self-report data, which are used all over the place in (social) science. The goal of the present research was to scrutinize this belief with a focus on applied settings and, in turn, to take a more systematic look at the role of response styles.
Therefore, a simulation study was carried out for the two most prominent response styles, ARS and ERS, and for three different scenarios: one looking at Cronbach’s alpha, one looking at correlations, and one looking at respondents’ scores. These scenarios were selected to resemble typical situations of applied data analysis, where response styles are often ignored—either because response styles are believed to be negligible or because methodological control cannot be realized for one reason or another.
While the generated data were analyzed with everyday methods, they were simulated from a sophisticated, but straightforward IRT model. Wetzel and Carstensen (2015) extended the idea of within-item multidimensionality in the polytomous Rasch model to dimensions that are not related to content but to response styles. The only difference to traditional within-item multidimensionality is that the response style dimension receives weights that are different from the traditional, ordinal coding. This model was well suited for the present simulations, because it is highly flexible and different response styles and/or multiple attributes can be incorporated. Moreover, the underlying notion of response styles is similar to existing approaches.
The results were twofold. On the one hand, bias was large when the attribute of interest was correlated with response style, and bias got extreme for large correlations. Such attribute–response style relationships might perhaps explain empirical findings of a notable impact of response styles. However, correlations outside ±.20 were not observed in the empirical example presented herein and may in general be the exception rather than the rule. Moreover, if the correlation really is in the range of .40, .60, or even higher, the question arises what the items at hand actually measure and whether the problem may be socially desirable responding rather than ARS (cf. Paunonen & LeBel, 2012). In such situations, self-reports might not be a sensible way of data collection.
On the other hand, bias was small or even negligible in a large range of conditions. This holds especially if the attribute–response style relationship was small. Moreover, bias was lower when more reverse-keyed items were used (for ARS), when the attribute–attribute correlation was higher, and when response style variance was smaller. For example, in the conditions in Figure 2 where response styles were unrelated to the attribute(s), bias hardly exceeded levels of .05 or even .02 if at least two reverse-coded items were used. In summary, the findings are in line with previous work finding only small effects as long as the attribute–response style relationship is small (Ferrando & Lorenzo-Seva, 2010; Johnson & Bolt, 2010; Savalei & Falk, 2014; Wetzel et al., 2015).
The presented empirical example supported the interpretation that response styles can introduce bias, but that this bias is rather small and unlikely to alter results completely. Moreover, the example showed that the parameter values chosen for the simulation were reasonable and definitely not understated.
The issue of an attribute–response style relationship brings up further questions about causation and the nature of response styles themselves. Let us look at two examples with ARS. First, if a bivariate relationship between an attribute and ARS is observed, this may be simply due to a common cause or confounder (e.g., cultural background) while the bivariate relationship is in fact nonexisting. Thus, a correct model would include the confounder but not necessarily ARS. Second, two independent attributes may both causally influence ARS—then called a collider. If ARS is wrongly included in the model, a spurious relationship between the two attributes may result. These examples highlight that a much deeper understanding of response styles and their causes and causal effects is needed in order to evaluate the impact of attribute–response style relationships.
If a rule of thumb should be derived from the present results, one third of reverse-keyed items are probably a good way to control ARS. There was no evidence that a fully balanced scale would further improve the results markedly, at least if the attribute–response style correlation was reasonably small. However, it should be noted that the use of reverse-keyed items may have downsides, and there is ample literature on that topic (cf. Weijters, Baumgartner, & Schillewaert, 2013). Apart from that, the number of reverse-keyed items had no effect on the bias caused by ERS. This is not surprising given that the definition of ERS is independent of the direction of an item.
As with every simulation study, the generalizability of the results depends on the external validity (a) of the simulation model, (b) of the parameter values (fixed or varied), and (c) of the analysis model. First, the chosen model allowed for a very natural implementation of ERS—a tendency to select the endpoints—and ARS—a tendency to agree. Moreover, the model is highly similar to existing approaches and there is no reason to assume that a different simulation model (e.g., Johnson & Bolt, 2010) would lead to fundamentally different results. Furthermore, differences between the chosen rating scale approach and a partial credit approach would probably cancel each other out across items and replications. Second, the chosen parameter values seemed plausible given the empirical example. Moreover, the regression results make it straightforward to plug in values (e.g.,
Different outcomes, such as factor structure, model fit, threshold and loading parameters, or higher order moments, were not covered herein and remain a route for further research. Moreover, the relationship among different response styles and the effect of multiple response styles at a time may be of interest in future studies. Apart from that, this study focused on the effect of ignoring response styles in raw score analyses; whether and how response styles can be controlled using appropriate (model-based) approaches is a different question (see, e.g., Wetzel et al., 2015).
In summary, the present results suggest that the impact of response styles in applied settings is probably better described by a molehill than a mountain. The analyses demonstrated the importance of reverse-keyed items to control for the negative influence of ARS. The future will show whether the gap between the applied camp and the methods camp can be bridged such that practitioners take response styles into account where necessary and that psychometricians develop and refine the tools required to do so.
Footnotes
Appendix
Acknowledgements
The author would like to thank Thorsten Meiser for comments that substantially helped to improve this article.
Declaration of Conflicting Interests
The author(s) declared no potential conflicts of interest with respect to the research, authorship, and/or publication of this article.
Funding
The author(s) disclosed receipt of the following financial support for the research, authorship, and/or publication of this article: This work was supported by the University of Mannheim’s Graduate School of Economic and Social Sciences funded by the German Research Foundation.