



Abstract
Contamination of responses due to extreme and midpoint response style can confound the interpretation of scores, threatening the validity of inferences made from survey responses. This study incorporated person-level covariates in the multidimensional item response tree model to explain heterogeneity in response style. We include an empirical example and two simulation studies to support the use and interpretation of the model: parameter recovery using Markov chain Monte Carlo (MCMC) estimation and performance of the model under conditions with and without response styles present. Item intercepts mean bias and root mean square error were small at all sample sizes. Item discrimination mean bias and root mean square error were also small but tended to be smaller when covariates were unrelated to, or had a weak relationship with, the latent traits. Item and regression parameters are estimated with sufficient accuracy when sample sizes are greater than approximately 1,000 and MCMC estimation with the Gibbs sampler is used. The empirical example uses the National Longitudinal Study of Adolescent to Adult Health’s sexual knowledge scale. Meaningful predictors associated with high levels of extreme response latent trait included being non-White, being male, and having high levels of parental support and relationships. Meaningful predictors associated with high levels of the midpoint response latent trait included having low levels of parental support and relationships. Item-level covariates indicate the response style pseudo-items were less easy to endorse for self-oriented items, whereas the trait of interest pseudo-items were easier to endorse for self-oriented items.
Survey research methodology is a multidisciplinary field that integrates principles and practices from statistics, sampling theory, psychology, computer science, and many others. One important aspect to evaluating the validity of inferences made from surveys is an understanding of individuals’ cognitive response processes. Early work (e.g., Strack & Martin, 1987; Tourangeau, 1984; Tourangeau & Rasinski, 1988) laid out four general stages in the cognitive response process for answering survey questions: (1) interpreting the question, (2) retrieving relevant inputs or a prior judgment from memory, (3) integrating information to form a judgment, and (4) reporting a response. Survey analysis typically assumes one substantive trait of interest (TOI)—the focus of traditional total-score or latent trait methodologies—is driving responses to each of these stages. However, responses to ordinal survey items may be driven by factors beyond the latent TOI, introducing construct-irrelevant variance, limiting the validity of inferences drawn from item and scale scores.
Research into the sources of construct-irrelevant variance has seen growth in the area of individuals’ response style, which is the tendency of a respondent to use a response scale in a systematic way, regardless of the content of the items and survey (Paulhus, 1991; Plieninger & Meiser, 2014). Baumgartner and Steenkamp (2001) recognized and summarized seven important response styles. Of these, extreme response style (ERS; Cronbach, 1946) has attracted the most attention in the response style literature (Jin & Wang, 2014). ERS denotes a systematic tendency to endorse the outermost, or extreme, options on either end of the scale. For example, on a 5-point ordinal scale representing 1 = strongly disagree through 5 = strongly agree, Options 1 and 5 would be considered extreme. Options 2 = disagree and 3 = neither agree nor disagree, and Option 4 = agree are nonextreme. An individual who consistently chooses an extreme option, regardless of whether they are high or low on the substantive trait, would have high levels of ERS. In contrast, midpoint response style (MRS) is the systematic tendency to use the midpoint response category. The middle category of a 5-point scale is 3 = neither agree nor disagree and the consistent selection of this midpoint would indicate high levels of MRS.
All response styles, such as ERS and MRS, are important considerations because the presence of response style can confound interpretation of scores (Bolt & Johnson, 2009; Jin & Wang, 2014) by introducing bias in the total score with regard to the primary substantive TOI (Leventhal & Stone, 2018). Specific potential consequences of ignored ERS and MRS include score inflation, reordering individuals along the scale, spurious correlations between constructs, distorted factor structures, and differential item functioning not related to content of the item (Thissen-Roe & Thissen, 2013). Therefore, the consequences of unaccounted-for response styles may mask, or over-state, true relationships among measures and affect the substantive conclusions in survey analysis.
Few studies have documented the empirical effects of failing to incorporate response style. van Vlimmeren et al. (2017) illustrate the importance of accounting for response style, showing that latent TOI levels differed substantially before and after controlling for response style. In another study, Danner et al. (2015) found that failing to account for response style systematically affects the variance of personality items and biases the association with criterion variables. A third study found the presence of acquiescence response style can distort the intended factorial structure of a questionnaire by introducing bias to the item variances and covariances (Rammstedt et al., 2010). Jin and Wang (2014) reported that ignoring ERS by fitting standard item response theory (IRT) models resulted in biased parameter estimates.
Another study (Adams et al., 2019) made use of a multidimensional nominal response model (MNRM; Bolt & Johnson, 2009) to examine response styles at the level of individual respondent. They found considerable heterogeneity of response styles in an empirical example, cautioning that unexpected (i.e., not identified nor addressed) response styles can confound measurement of the identified response style(s) and the TOI. Furthermore, accounting for response styles can influence the precision with which the TOI is estimated (Adams et al., 2019). Collectively, the impact of response styles on measurement of the TOI is clear. What is lacking relates to the correlates and predictors of response styles, at the item- and person-level, and whether an understanding of response style predictors can help mitigate the effects of response style contamination.
Measurement of Response Style
Jackson and Messick (1958) stress the development and evaluation of methods accounting for response styles. Multiple approaches exist to measure and assess response styles (see Van Vaerenbergh & Thomas, 2013). Classical methods count how often a participant selects a particular response category, such as the extreme categories. The primary limitation of this approach is that it confounds the measurement of response styles and the trait(s) of interest. For example, a person providing many high scores on a set of items could be an extreme responder but could also be very high on the TOI. The classical approach cannot disentangle response style and the substantive trait; as such, there is no direct way of correcting the TOI measure for response style bias in the classical approach (Bolt et al., 2014). Multidimensional item response theory (MIRT) models simultaneously measure the TOI and response styles, such as ERS and MRS, to address these shortcomings. MIRT models approaches to response style can be categorized as either threshold-based approaches or response–process approaches (Böckenholt & Meiser, 2017).
Threshold-based approaches to ordinal items assume that individuals with higher levels of the underlying TOI latent trait(s) will endorse higher response categories across survey items. The threshold-based approach to modeling response styles captures individual differences in the use of response categories by varying the thresholds for each individual (Böckenholt & Meiser, 2017). The threshold approach has been extended to multidimensional models. For example, the MNRM (Bolt & Johnson, 2009) builds on a unidimensional threshold-based approach to account for response styles. Based on the nominal response model, the MNRM includes a second latent trait specified as a response style (Bolt & Newton, 2011) and can simultaneously accommodate multiple response styles.
Item Response Trees for Response Style Measurement
Alternatively, item response tree (IRTrees) are a form of noncompensatory, multidimensional IRT models. They are a flexible approach that explicitly models a multiple-stage decision-making process (Böckenholt, 2012). For a five-category ordinal item, one hypothesized decision-making process is that an individual responds using three distinct decisions, as illustrated in Figure 1. Each decision is driven by a separate trait (
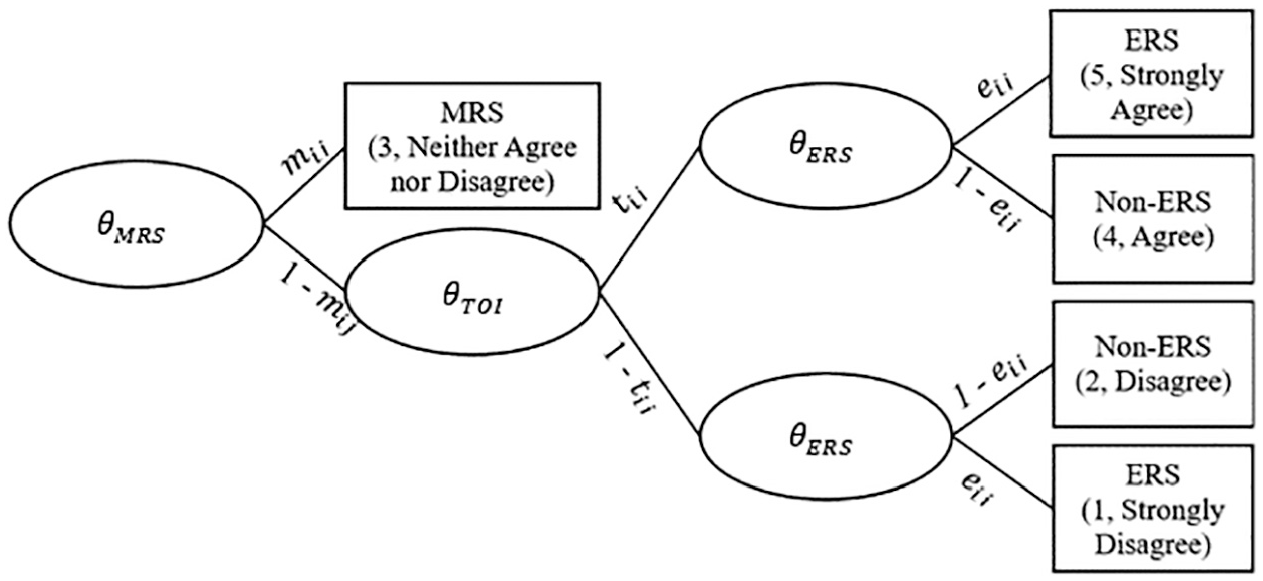
Item response tree (IRTree) model accounting for midpoint response style (MRS), the trait of interest (TOI), and extreme response style (ERS) for a 5-point ordinal item. Observed responses are denoted by rectangles and decision stages by ovals. In each decision stage, the latent trait underlying the decision is denoted by the corresponding theta symbol.
The probability of each Likert-type item response category can be specified by tracing the path in Figure 1. For example, the probability of person i responding to item j in the lowest category, strongly disagree (

where
Pseudo-Item Coding Matrix.

Note.
Utilizing the unidimensional 2PL, a generalized IRTree model (Jeon & De Boeck, 2016), for person i endorsing the pseudo-item j in the kth decision stage, is given by:

where
Heterogeneity in Response Styles
One potential advantage of flexible IRTree models is that they can simultaneously estimate relations among response style and predictors, which allows for the use of covariates to explain heterogeneity in response styles. Previous research found response styles differ across geographic regions, ethnicities, and nationalities (de Jong et al., 2008; Thissen-Roe & Thissen, 2013) and may be attributable to differences in language, education level, interpretation of response scale anchors, and cultural customs (Harzing, 2006). For instance, de Jong et al. (2008) used a tree-like IRT model and found ERS is positively related to national-cultural individualism and masculinity. Individual respondent characteristics have also been examined for their relationship to response styles, but the results have been inconsistent. In one example, women tended to have higher levels of extreme response tendencies than men (e.g., de Jong et al., 2008), but Peterson et al. (2014) found males tended to have higher extreme response tendencies than females. Other positive correlates with the propensity for extreme responding include both younger and older individuals (de Jong et al., 2008), taking a survey face-to-face rather than web based (Liu et al., 2016), responding to survey items quickly, and simplistic thinking tendencies (Naemi et al., 2009). In the United States, studies have shown that African Americans and Hispanics tend to give more extreme responses than Caucasians (e.g., Bachman & O’Malley, 1984). Jin and Wang (2014) found that model fit improved with the addition of person covariates explaining response styles of a generalized IRT model and that number of siblings was a significant predictor of ERS.
There has been less research into the correlates with MRS. In two studies, respondents showed a higher propensity toward choosing the midpoint response options when the survey was delivered in their second language (Harzing, 2006; Gibbons et al., 1999) and a higher propensity toward extreme responses when the survey was delivered in the respondents’ native language. In addition, paper-and-pencil and web-based surveys tended to elicit more midpoint responses when compared to telephone surveys (Harzing, 2006). East Asian respondents have been shown to give more midpoint responses than North American respondents (Culpepper & Lowery, 2002).
Fewer studies explored item-level characteristics that may explain MRS and ERS. Park and Wu (2019) found that individuals tended to avoid using the lower extreme category regardless of whether the item was positively or negatively worded. Bandaloset al. (2019) examined whether item labeling, with complete or endpoint-only categorical labels, affected extreme and midpoint responses. They found that items with endpoint-only labels tended to elicit more extreme responses as well as more midpoint responses. Böckenholt (2019) reported improved model fit with the addition of an item-level covariate.
Covariate IRTrees for Response Style Heterogeneity
The research settings and populations differ across these studies, as do the methodologies used to measure response styles. Many of the studies that explored response style heterogeneity relied on the classical approach, performing a post hoc comparison of response style levels rather than incorporating predictors directly into the model. While both the threshold-based and tree-like approaches can theoretically incorporate covariates, only a few studies have attempted to explain response style heterogeneity in a generalized IRT (e.g., Jin & Wang, 2014) framework, which includes IRTrees. Jin and Wang’s (2014) approach is limited because their model explores only one response style at a time—ERS—with only person covariates. In the IRTree framework, a few studies incorporated item-level covariates (e.g., Bandalos et al., 2019; Park & Wu, 2019), but not item- and person-covariates in the same model. There is a need to evaluate IRTree model performance with both person- and item-covariates for multiple response style traits.
To expand on previous work, the response process model in Equation 2 extends to incorporate item- and person-level covariates. The covariate IRTree (Jeon & De Boeck, 2016), conceptually an extension of the linear logistic test model (Fischer, 1973), is
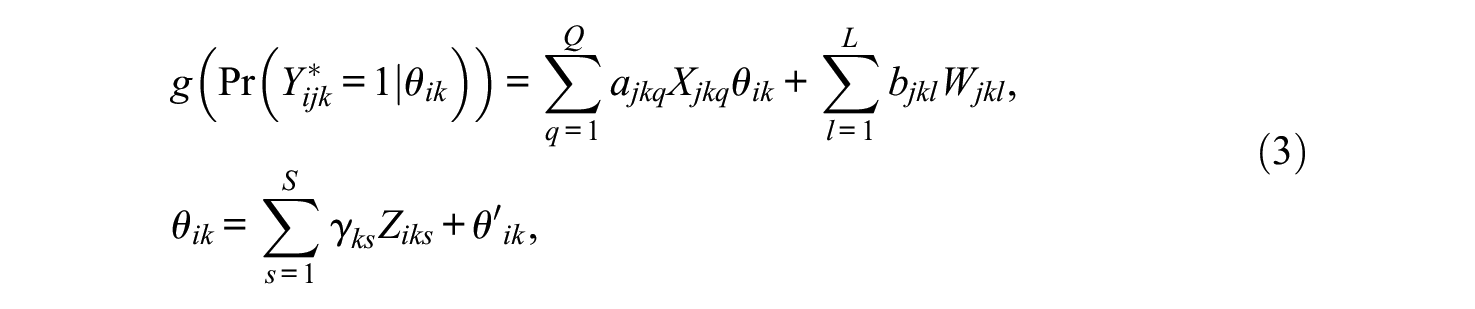
where
We illustrate the model with a simple example for item j in the k = ERS decision stage, a single person-level covariate used to explain the ERS latent trait level, and a single item-level covariate used to explain easiness of endorsing the ERS pseudo-item. The person covariate is dummy coded, representing, in this example, whether the person’s biological sex is male (coded 0) or female (coded 1). The item covariate is continuous, representing the number of words in the item prompt. Because we are only focusing on one item for illustrative purposes and single person- and item-level covariates, the summation symbols are dropped.

In Equation 4,
This study demonstrates use of the covariate IRTree model using multiple person covariates, extending work from Jin and Wang (2014) and Jeon and De Boeck (2016), neither of which used covariates to explain latent trait parameters. We also present a simulation study evaluating adequacy of the Bayesian Markov chain Monte Carlo (MCMC) estimation method for parameter recovery. After demonstrating adequate parameter recovery, we provide an empirical example using the National Longitudinal Study of Adolescent to Adult Health (Add Health; Harris et al., 2009) six-item sexual knowledge scale with multiple covariates to predict item easiness. The specific research questions are
Method and Results
Simulation: Parameter Recovery
A relatively well-known limitation of noncompensatory MIRT models is the inability to accurately estimate model parameters (Wang & Nydick, 2015). Thus, it was important to ensure adequate recovery of parameters prior to interpretation of parameter estimates. Jin and Wang (2014), using MCMC estimation, performed one of the more comprehensive parameter recovery studies for response style models. However, their model contained only one response style (i.e., ERS) and was not a tree-like model. Jeon and De Boeck (2016) conducted a small simulation study evaluating a two-dimensional generalized IRTree fit to 24 three-category responses (N = 316) using maximum-likelihood estimation and found that item parameters were recovered quite well. Plieninger and Heck (2018) compared their proposed acquiescence model to a 1PL version of the unconditional generalized three-dimensional IRTree model presented earlier (N = 250). They found adequate recovery of difficulty parameters using MCMC estimation. Researchers evaluating a noncompensatory MIRT model—similar to the generalized three-dimensional IRTree model, albeit a 1PL parameterization—found MCMC estimation outperformed Bayesian and non-Bayesian specifications of the Metropolis–Hastings Robbins–Monro algorithm, especially in conditions with high intertrait correlations (Wang & Nydick, 2015). Given these findings and our relatively high intertrait correlations, we elected to use MCMC estimation for the current study.
In addition to Wang and Nydick’s (2015) evaluation of estimation algorithms, they further suggested sample sizes of 1,000 are required for adequate parameter recovery of noncompensatory MIRT models without missing data. Recoding of items into pseudo-items results in missing data in the TOI and ERS pseudo-items (see Table 1) when the midpoint pseudo-item is endorsed and recovery of item parameters may be compromised. Accordingly, we considered the following sample sizes: (N = 1,000, 2,000, 4,000).
The magnitude of latent trait intertrait correlations can affect parameter recovery (Wang & Nydick, 2015). Previous empirical studies (including the current) have generally found similar correlations among traits: weak to moderate negative relation between MRS and TOI, strong negative relation between MRS and ERS, and weak positive relation between TOI and ERS (e.g., Ames & Myers, 2020; Böckenholt, 2017; Plieninger & Heck, 2018). Nonetheless, others have found near zero correlations among latent traits (Myers & Ames, 2019); thus, we evaluated conditions with uncorrelated and correlated latent traits.
We further considered the magnitude of relations among the continuous covariate and the latent traits that represented no, moderate, and strong relations (
Person parameters and the continuous covariate were simulated from a multivariate standard normal distribution:
Generating Item Parameters for IRTree Model.

Note.
The covariate IRTree model was fit with Mplus using MCMC estimation with the Gibbs sampler (Muthén & Muthén, 1998-2017). For model identification, latent trait means are fixed to zero and latent trait variances are fixed to one. Two chains were estimated with the first 25,000 iterations from each chain discarded as burn-ins and the posterior distribution consisted of the last 25,000 iterations from each chain. Convergence was assessed via visualization of trace plots and evaluation of the potential scale reduction factor convergence criteria (Gelman & Rubin, 1992). The minimum potential scale reduction factor convergence criterion was set to 1.02, which corresponds to less than 4% of the variability in the posterior being between-chain variability. Weakly informative priors were used for the item parameters:
The accuracy of parameter estimates was evaluated via coverage, average bias, root mean square error (RMSE), and relative bias. Coverage was computed as the proportion of 95% credible intervals that contained the generating parameter value. Average bias of the item parameters, within each of the
Results of Simulation Study
Item Parameter Recovery
A series of between-subjects factorial analyses of variance were conducted to evaluate the effect the simulation conditions on estimation bias. Given the purpose of the study was to identify conditions that influenced parameter recovery to the greatest extent, we did not evaluate statistical significance of the analyses of variance but rather the effect size
Discrimination
The trait related to the covariate, magnitude of the relation with the covariate (
Proportion of Variance (
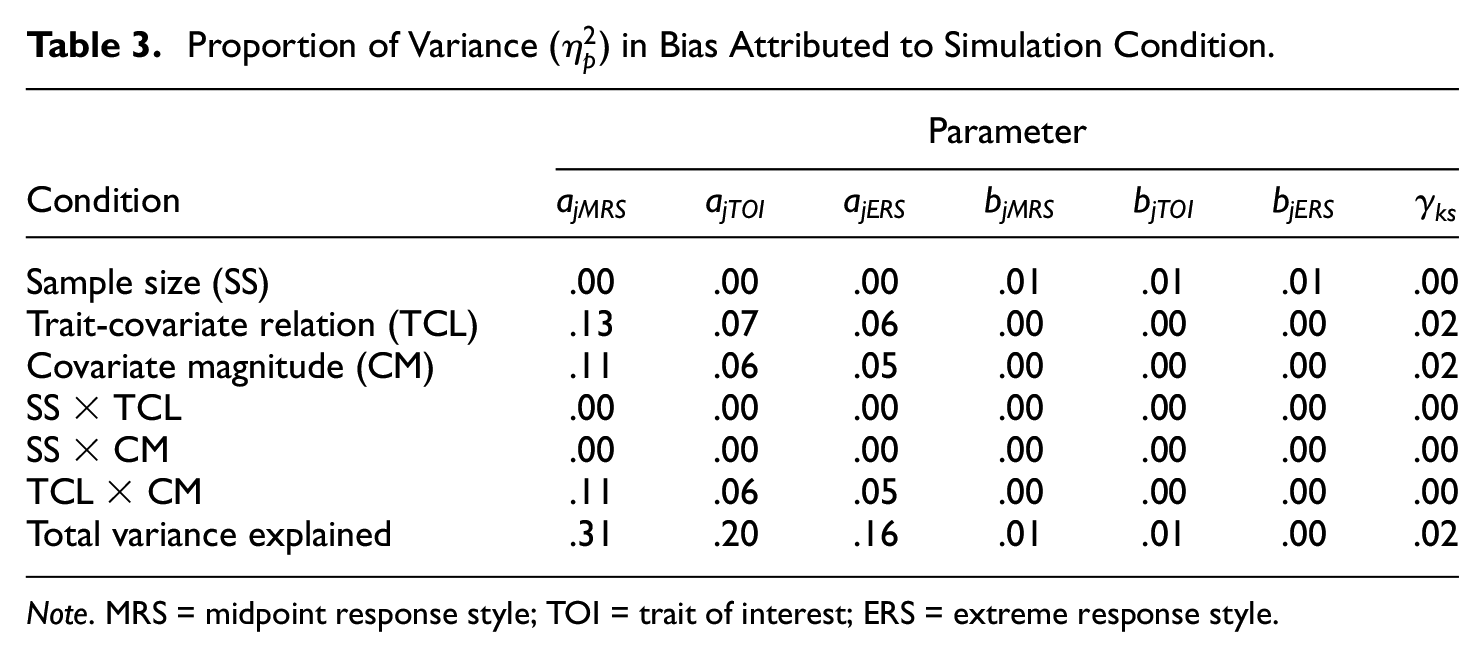
Note. MRS = midpoint response style; TOI = trait of interest; ERS = extreme response style.

Item parameter average bias, relative bias, and root mean square error (RMSE) across sample sizes, latent traits, and magnitude of slope coefficient (
In terms of relative bias, the magnitude of the relation with the covariate had the largest effect on discrimination parameter estimates with the large magnitude influencing parameter estimates the most and no relation influencing parameter estimates least. Nonetheless, discrimination parameter estimates were within or near the commonly used ±10% relative bias heuristic for small bias across all conditions. Coverage of the discrimination parameters decreased as the magnitude of the relation to the covariate and sample size increased and was essentially equivalent across dimensions. In conditions where the covariate was related to the relevant latent trait, average coverage across dimensions was
Intercept
Sample size accounted for 1% of the variance in intercept parameter estimation bias across MRS, TOI, and ERS conditions. Nonetheless, the average bias among intercept parameters was approximately 0 across all conditions and dimensions. The largest relative bias (~5~) was associated with the TOI intercepts in the
Covariate
The slopes among the latent traits and the covariate (
Empirical Example
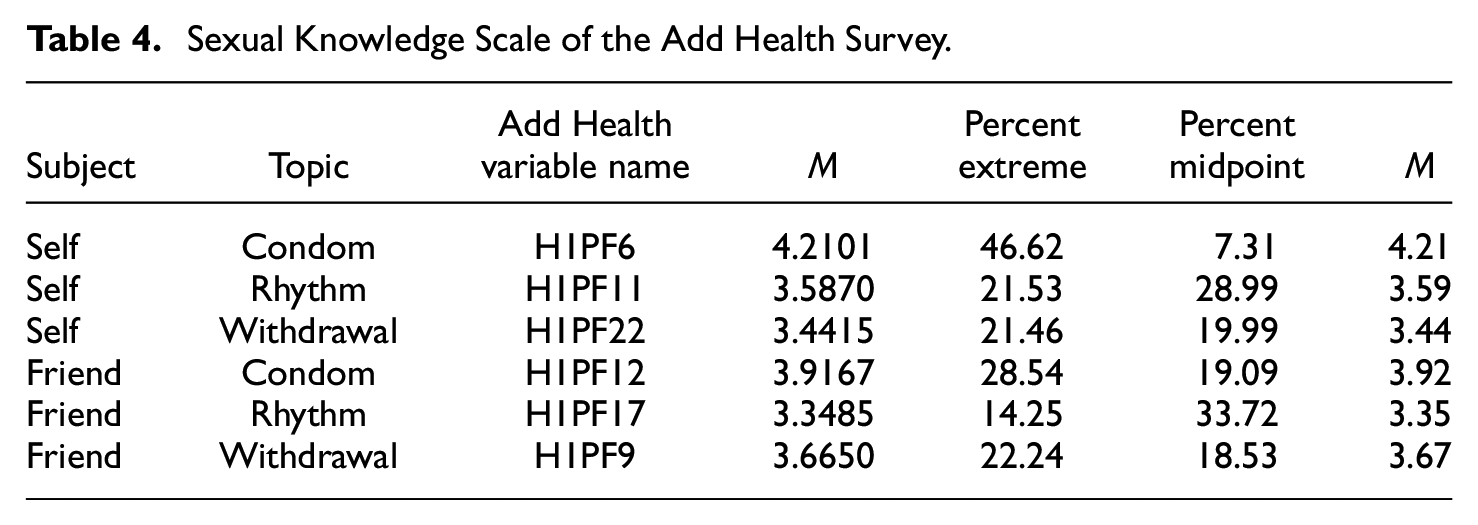
We use data from the National Longitudinal Study of Adolescent to Adult Health (Add Health) survey (Harris et al., 2009). Add Health began with an in-school questionnaire administered to a nationally representative sample of students in Grades 7 to 12 in 1994-1995 (Wave 1). Our primary focus is on a six-item scale of sexual knowledge (see Table 4 for items and Add Health database variable names, with means and category percentages). Items include a subject (self, friend) and topic (condom, rhythm method, withdrawal method) component. For example, the friend-item asks, “Your closest friends are quite knowledgeable about the withdrawal method of birth control,” whereas the self-item asks, “You are quite knowledgeable about the withdrawal method of birth control” when referring to birth control. Response options include a 5-point rating response format going from strongly disagree = 1 to strongly agree = 5. We chose to include both the self- and friend-items because of the close link in adolescence between friends’ behavior and an individual’s sexual behavior (Smith et al., 1985), implying a strong positive relationship between an adolescent individual’s self-reported sexual behavior and the sexual behavior of their friends.
Sexual Knowledge Scale of the Add Health Survey.
Description of the Sample
All respondents in the random sample had complete data at Wave 1 for the sexual knowledge scale and covariates (N = 2,666 respondents). Response percentages and are provided in Figure 3. The item with the lowest mean (3.35) was the friend-rhythm item, which also had the lowest percentage of extreme responses (14.25%) and highest percentage of midpoint responses (33.72%). The item with the highest mean (4.21) was the self-condom item, which also had the highest percentage of extreme responses (46.62%) and lowest percentage of midpoint responses (7.31%).
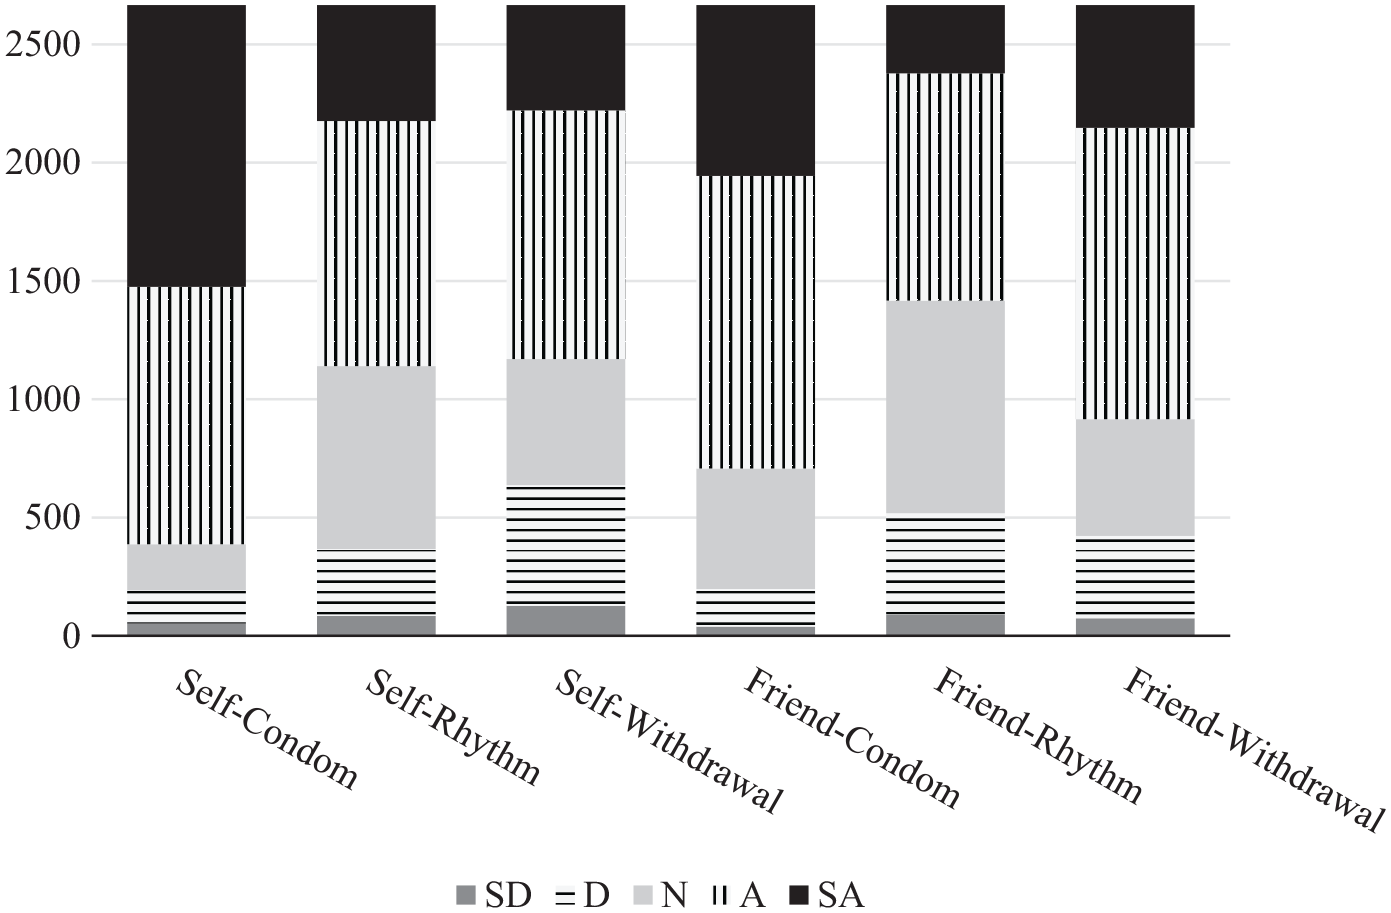
Percentage of respondents in each category.
Covariates
We chose whether the respondent was Caucasian (variable name H1GI6A) and biological sex (variable name BIO_SEX) as dichotomous person-level covariates. We use the parental support and relationship (also from Add Health) scale score as a continuous person-level covariate, computed as the average of nine items that ask respondents their level of agreement to statements such as “Most of the time, your father is warm and loving toward you.” High scale scores indicate higher perceived levels of parental support and a closer relationship with parents. The sample was 71.94% White, 49.89% female, average age of 15.75, and the average parental relationship scale score was 4.09 out of 5.00. The item-level covariate is whether the item is self-oriented or friend-oriented.
Estimation
All data analyses and model-fitting were performed using MCMC in the SAS (SAS Institute Inc., 2017) MCMC procedure. Prior distributions for the item parameters were weakly informative (i.e.,
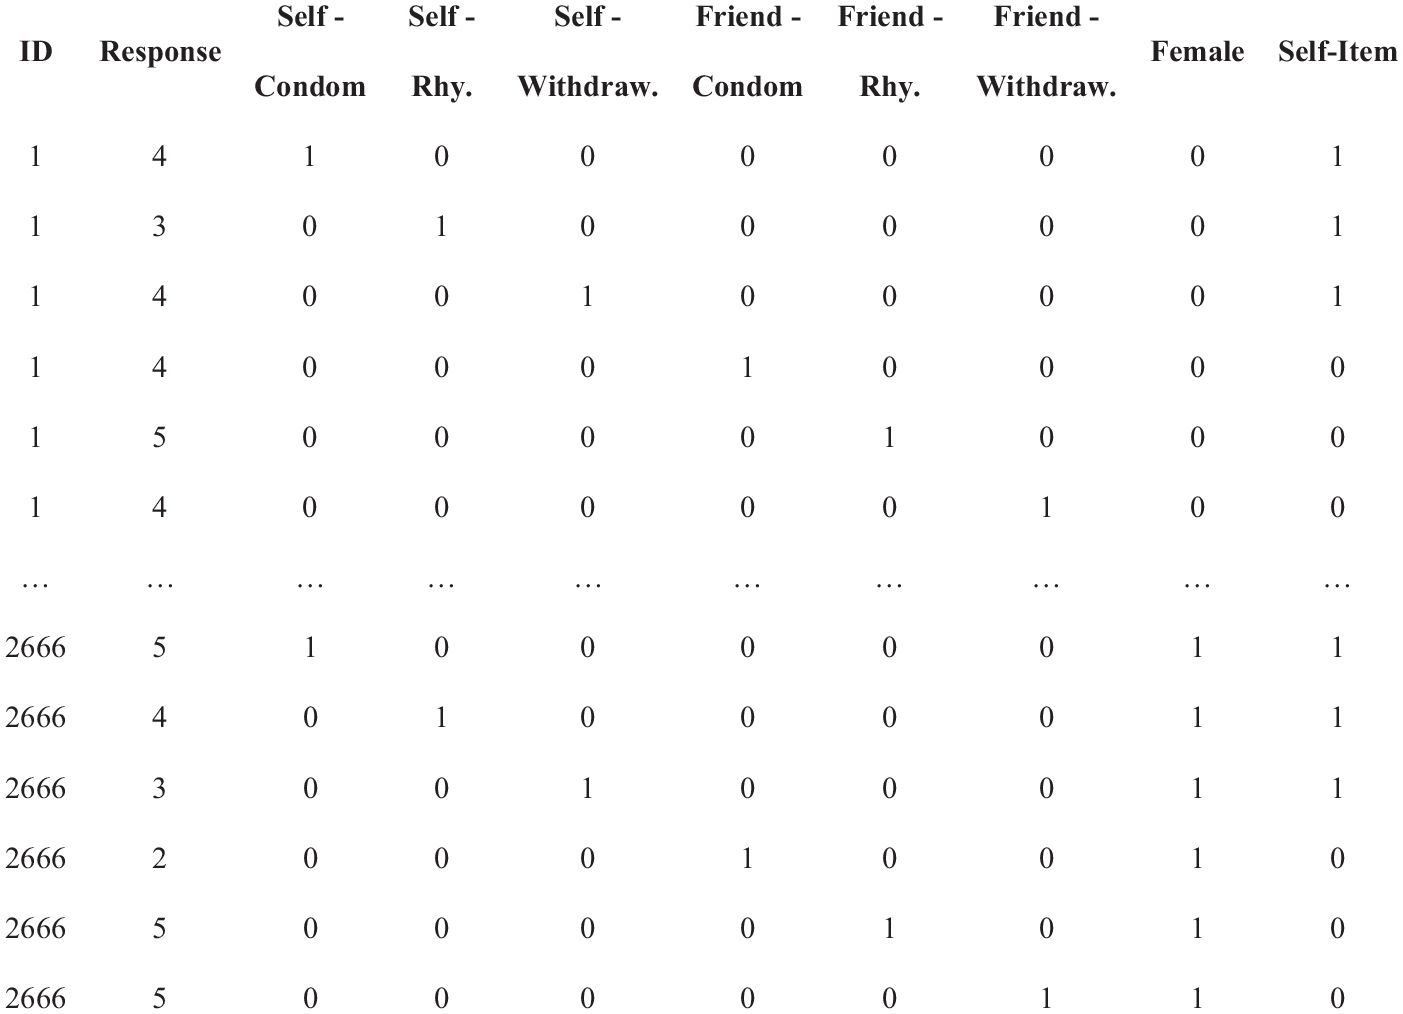
Long form example data with one person covariate (female), one item covariate (self item), the observed response (response), and item indicators (self-condom through friend-withdraw).
Results, Empirical Example
Unconditional IRTree
To investigate the presence of ERS and MRS in the Add Health responses, we first fit an unconditional (i.e., no covariates) IRTree to the Add Health data (see Table 5). In the ERS decision stage, the discrimination parameters ranged from 1.946 to 3.629, indicating the presence of ERS in the data. The item easiness parameters in the ERS decision stage indicated the items were relatively difficult to endorse for the extreme options with the exception of Item 6. Item 6 had the highest percentage of extreme responses (45.7%; see Table 2), reflected in
In the MRS decision stage, the discrimination parameters ranged from 1.591 to 2.649, indicating the presence of MRS in the data. The item easiness parameters in the MRS decision stage indicated the items were relatively difficult to endorse for the midpoint options. In this decision stage, Item 6 was the most difficult (
Add Health Results: Unconditional IRTree.
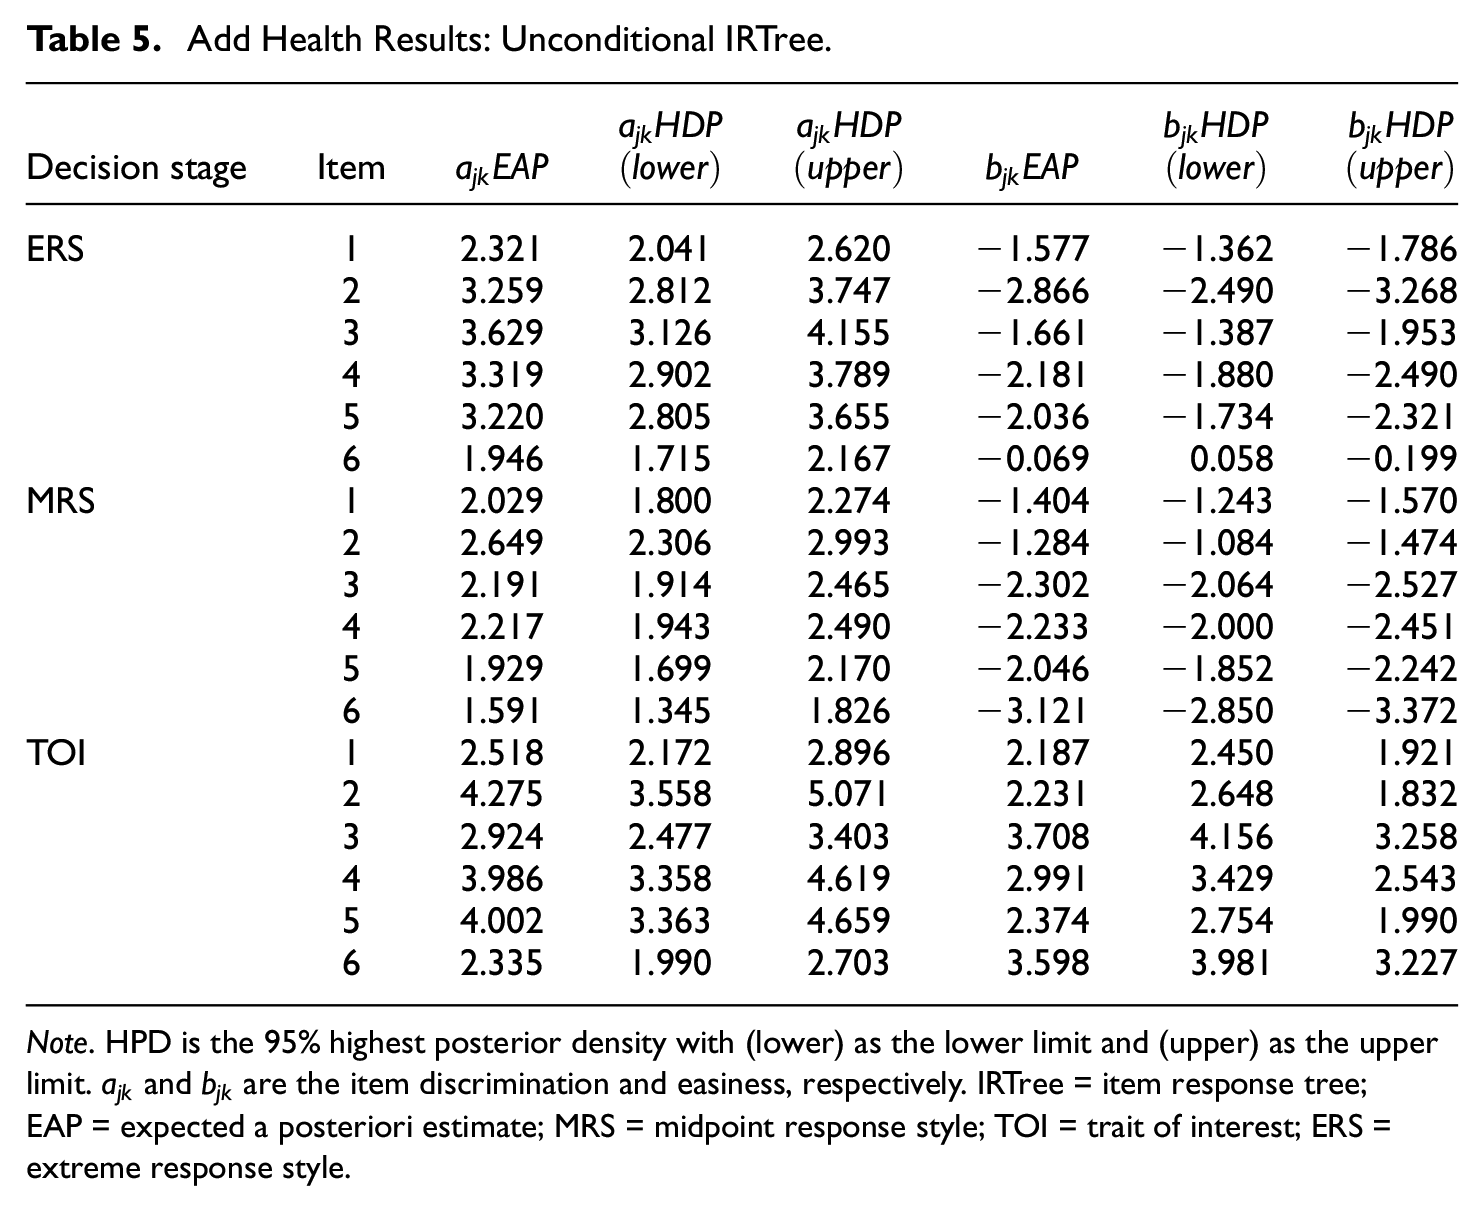
Note. HPD is the 95% highest posterior density with (lower) as the lower limit and (upper) as the upper limit.
Covariate IRTree
We used person-level covariates to predict person parameters and an item-level covariate to predict item easiness. Table 6 presents the parameter estimates for the covariate regression weights of this analysis. The deviance information criterion (DIC) for the unconditional model was 32,299.84 and the DIC for the covariate IRTree model was 31,495.72, a difference of 804.12, indicating the covariate IRTree provided a better fit of the data to the model (Zhang et al., 2019). We computed DIC using the marginal likelihood, which does not use latent variables as parameters “in focus” of the computations (Merkle et al., 2019).
Covariate Weights.
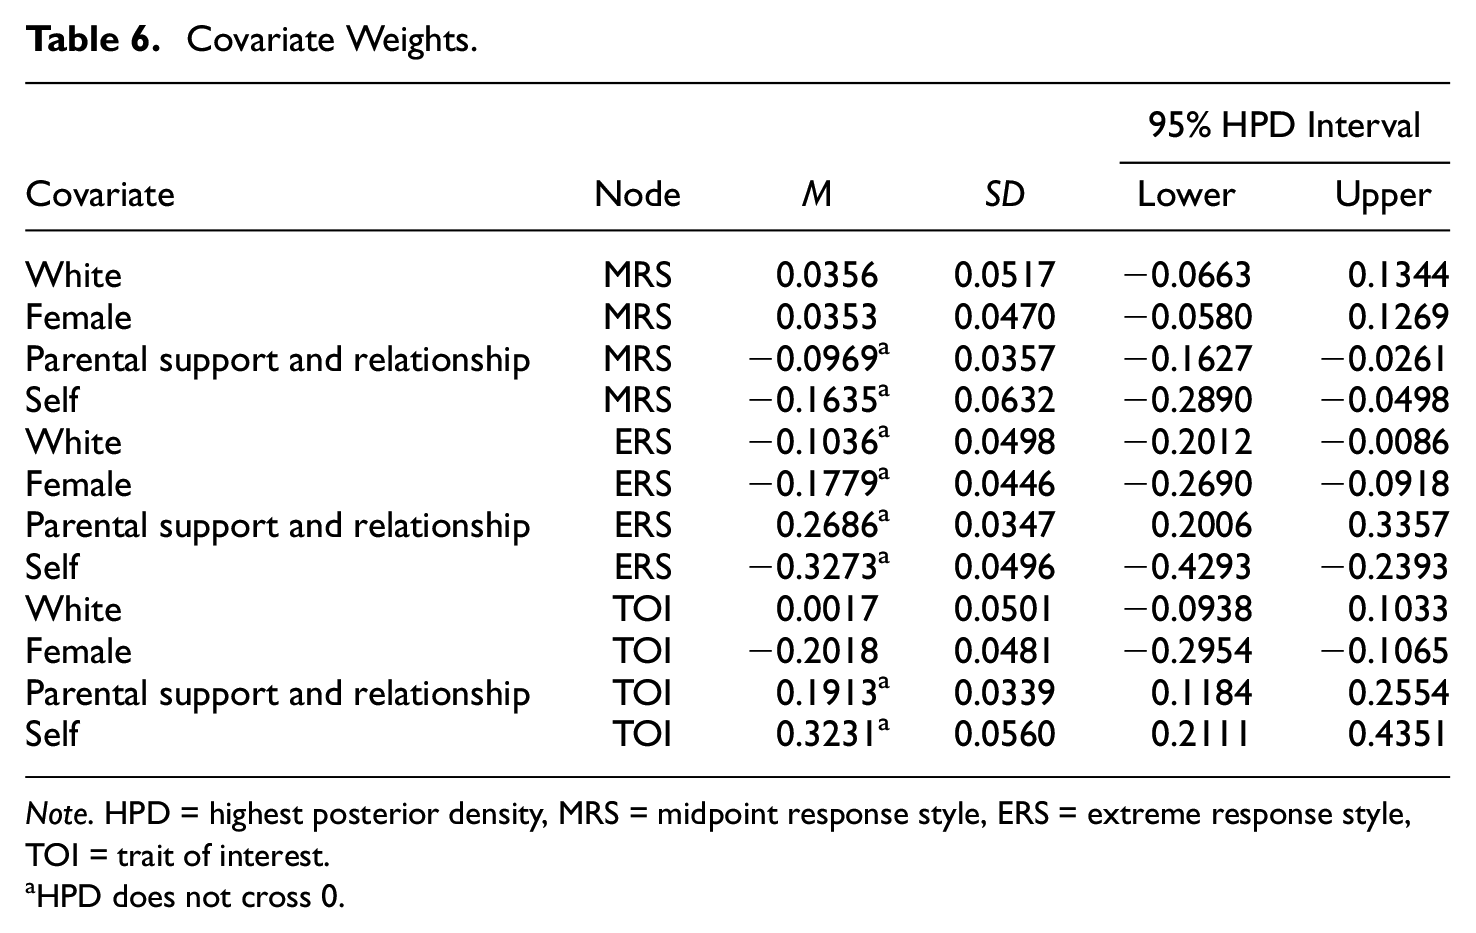
Note. HPD = highest posterior density, MRS = midpoint response style, ERS = extreme response style, TOI = trait of interest.
HPD does not cross 0.
In the midpoint decision stage, being White had a negligible impact on levels of the MRS trait (expected a posteriori [EAP] = 0.0356), as did being female (EAP = 0.0353). We define negligible as the HPD crossing zero. Higher levels of parental support and relationship were associated with slightly lower levels of the MRS trait (EAP = −0.0969, 95% HPD: −0.1627 to −0.0261). Endorsing the midpoint category was more difficult in the self-oriented items than the friend-oriented items (EAP = −.1635, 95% HPD: −0.2890 to −0.0498). In the extreme response decision stage, White respondents tended to have lower levels of the ERS trait (EAP = −0.1036, 95% HPD: −0.2012 to −0.0086) than non-Whites. Female respondents tended to have lower levels of the ERS trait (EAP = −0.1779, 95% HPD: −0.2690 to −0.0918) than males. Higher levels of parental support and relationship were associated with higher levels of the ERS trait (EAP = 0.2686, 95% HPD: 0.2006 to 0.3357). Endorsing the extreme categories was more difficult in the self-oriented items than the friend-oriented items (EAP = −0.3273, 95% HPD: −0.4293 to −0.2393).
In the sexual knowledge TOI stage, being White had a negligible impact on levels of the TOI trait (EAP = 0.0017). Female respondents tended to have lower levels of the TOI trait (EAP = −0.2018, 95% HPD: −0.2954 to −0.1065). Higher levels of parental support and relationship were associated with higher levels of the TOI trait (EAP = 0.1913, 95% HPD: 0.1184 to 0.2554). Endorsing the sexual knowledge TOI was easier in the self-oriented items than the friend-oriented items (EAP = 0.3231, 95% HPD: 0.2111 to 0.4351).
Discussion
This study has presented a covariate IRTree as a method to estimate and explain response styles. We conducted one parameter recovery simulation, which demonstrated adequate parameter recovery. Applied researchers should rest assured that item and regression parameters should be estimated with sufficient accuracy when sample sizes are greater than approximately 1,000 and MCMC estimation with the Gibbs sampler is used. Nonetheless, it would be prudent to evaluate conditions not explored in the current study. With regard to parameter estimation, the biggest area of concern is likely the missing data associated with the TOI and ERS pseudo-items. Parameters associated with TOI and ERS traits were generally estimated less precisely than parameters associated with the MRS trait, as the pseudo-item coding does not result in missing MRS pseudo-items. Altogether, these findings suggest that the Bayesian estimation option in Mplus provides a fast, flexible, and user-friendly approach to estimating the unconditional and covariate IRTrees. Mplus syntax for estimating this three-dimensional IRTree model is included in the Supplemental Appendix (available online).
The empirical example illustrated the flexibility of the model, incorporating person- and item-level covariates. In addition, a mix of continuous and dichotomous predictors were used. Meaningful predictors of higher levels of ERS latent trait included being non-White, being male, and having high levels of parental support and relationships. Previous research found mixed results on the role of gender and race on proclivity for providing extreme responses (Thissen-Roe & Thissen, 2013), but these findings agree with Bachman et al. (2010) and Meisenberg and Williams (2008) who found males provided more extreme responses than females. One concern with using parental support and relationships scale scores is that the scale is also prone to response style contamination. To investigate this hypothesis, we estimated an unconditional IRTree for the parental support and relationships scale and correlated the ERS traits across the sexual knowledge and parental support scales. The resulting correlation is large and significant (
Meaningful predictors of higher levels of MRS latent trait included having low levels of parental support and relationships. Finally, higher levels of sexual knowledge were associated with being male and having high levels of levels of parental support and relationships. Focusing on gender predictor, the findings are consistent with previous studies. For example, Leland and Barth (1992) found that males knew more about using condoms correctly and the use of condoms’ role in preventing sexually transmitted diseases. Previous research has found that young adults who discuss sexual activity and contraception use with a parent or guardian are more likely to use contraception consistently (Amialchuk & Gerhardinger, 2015; Crosby et al., 2002), affirming the positive relationship found between parental support and relationships and the sexual knowledge TOI.
Item-level covariates indicate the response style pseudo-items were less easy to endorse for self-oriented items, whereas the TOI pseudo-items were easier to endorse for self-oriented items. The difference between self- and other-oriented items indicates that self-oriented items elicit fewer extreme and midpoint responses. There are a few potential explanations. Projection of friends’ behavior has been shown to overestimate the similarity of the friend’s behaviors with their own (Mirande, 1968), which may potentially explain the relative easiness in endorsing the extreme pseudo-items, particularly at the higher end. It is relatively easier for respondents to endorse the TOI for the self-items, removing response style contamination, possibly indicating that the projection bias other researchers have noted might be attributable to response style differences between friend- and self-items.
Limitations
This study did not use covariates to predict or explain the item discrimination parameters. Incorporating item-level discrimination covariates, such as whether the item is negatively worded or self-oriented, could provide survey development guidance. If item features can be used to explain, for example, whether an item is able to discriminate between individuals with high and low response styles, then the inclusion or exclusion of those features could limit the effects of response style contamination through intentional survey design. Future research should intentionally manipulate features such as response option labels and item wording, among other features, to accomplish this task.
Another limitation is the noncompensatory nature of the IRTree model framework of focus in this article. In compensatory models, the latent abilities interact such that low levels of one latent trait can be offset by an increase in higher levels of another latent trait. By contrast, noncompensatory models do not have an interaction like this. Low levels of one latent trait cannot be completely offset through an increase in other traits. For example, consider the strongly disagree and strongly agree categories. The noncompensatory nature of the IRTree model implies these extreme responses cannot be obtained by high, or low, levels of the TOI alone—the respondent must have high levels of ERS in order to provide responses to these categories. This assumption may be unreasonable. That is, the relation between TOI and ERS may be compensatory in nature. Myers and Ames (2019) provide an initial exploration into the compensatory model for response styles, but there is still considerable work to be done in that area.
Despite these limitations, this study presented a generalized IRTree with covariates that can be useful for investigating the multiple decision stages of respondents to ordinal items. The empirical application to the Add Health data set demonstrated the presence of MRS and ERS response styles in the data. For those respondents with high response style scores, using a total score or latent trait from a unidimensional IRT model, such as the graded response model, will be misleading. In the context of Add Health, the presence of high levels of ERS and MRS could influence the findings on the effectiveness of interventions and bias the conclusions regarding correlates with sexual knowledge. The covariate IRTree is an important methodological tool that explains response style heterogeneity and detects the presence of response styles in the data. The model is flexible and can account for covariates at the item and respondent levels, proving useful in a variety of applications.
Supplemental Material
Supplementary_File_Appendix – Supplemental material for Explaining Variability in Response Style Traits: A Covariate-Adjusted IRTree
Supplemental material, Supplementary_File_Appendix for Explaining Variability in Response Style Traits: A Covariate-Adjusted IRTree by Allison J. Ames and Aaron J. Myers in Educational and Psychological Measurement
Footnotes
Declaration of Conflicting Interests
The author(s) declared no potential conflicts of interest with respect to the research, authorship, and/or publication of this article.
Funding
The author(s) received no financial support for the research, authorship, and/or publication of this article.

Supplemental Material
Supplemental material for this article is available online.
References
Supplementary Material
Please find the following supplemental material available below.
For Open Access articles published under a Creative Commons License, all supplemental material carries the same license as the article it is associated with.
For non-Open Access articles published, all supplemental material carries a non-exclusive license, and permission requests for re-use of supplemental material or any part of supplemental material shall be sent directly to the copyright owner as specified in the copyright notice associated with the article.
