
Abstract
Meta-analysis is a significant methodological advance that is increasingly important in research synthesis. Fundamental to meta-analysis is the presumption that effect sizes, such as the standardized mean difference (SMD), based on scores from different measures are comparable. It has been argued that population observed score SMDs based on scores from different measures A and B will be equal only if the conjunction of three conditions are met: construct equivalence (CE), equal reliabilities (ER), and the absence of differential test functioning (DTF) in all subpopulations of the combined populations of interest. It has also been speculated the results of a meta-analysis of SMDs might differ between circumstances in which the SMDs included in a meta-analysis are based on measures which all met the conjunction of these conditions and that in which the conjunction of these conditions is violated. No previous studies have tested this conjecture. This Monte Carlo study investigated this hypothesis. A population of studies comparing one of five hypothetical treatments with a placebo condition was simulated. The SMDs in these simulated studies were based on true scores from six hypothetical measures. The scores from some of these measures met the conjunction of CE, ER, and, the absence of DTF, while others failed to meet CE. Three meta-analyses were conducted using both fixed effects and random effects methods. The results suggested that the results of meta-analyses can vary to a practically significant degree when the SMDs were based on scores from measures failing to meet the CE condition. Implications for future research are considered.
Keywords
Meta-analysis is a significant methodological advance. It is increasingly important in research synthesis, has been placed at the top of evidence hierarchies for identifying evidence-based practices (e.g., Rubin & Bellamy, 2012), and the number of published meta-analyses is rapidly growing (Borenstein, Hedges, Higgins, & Rothstein, 2009; White, 2009). As pointed out by Bond, Wiitala, and Richard (2002), the ideal circumstance for cumulating effect sizes (EFSs) from studies is when either standard measures or the same measures are used in each study, so raw score mean differences can be cumulated. However, since researchers frequently use different measures, the meta-analyst must cumulate EFSs based on scores from different measures with unique and therefore noncomparable metrics (Bond et al., 2002; Lord, 1980).
Consequently, fundamental to meta-analysis when different measures are used is standardization (Bond et al., 2002; Lipsey & Wilson, 2001, p. 4). The presumption is that standardized EFSs, such as the standardized mean difference (SMD), based on scores from different measures are comparable. Borenstein et al. (2009), identified the linear relationship between scores from different measures that was part of Hedges & Olkin’s (1985) model of the SMD as a basis for the comparability of SMDs based on scores from different measures. In Hedges and Olkin’s (1985) model it was assumed that two measures A and B were congeneric, so the true scores from measures A and B,

where,
Recently, Nugent (2012) argued that population, or subpopulation, observed score SMDs based on scores from different measures A and B will be equal only if three conditions are met:
The measures A and B are congeneric, as in Hedges and Olkin’s (1985) model, so Equation (1) holds. Nugent (2012) referred to this as the construct equivalence (CE) condition.
The reliability coefficients for the observed scores from the measures A and B are equal,
Conditions (1) and (2) hold in all subpopulations of the combined population,
If both CE and ER (i.e., the conjunction,
It was argued that when this form of measurement equivalence holds, the population observed score SMDs,
Nugent (2011, 2012) speculated that if the conjunction of Conditions (1) through (3) fails to hold for scores from different measures, the SMDs for a given population, or subpopulation, comparison based on scores from the different measures will be neither equal nor comparable in the sense of being completely interchangeable. In a sequence of simulations Nugent (2009, 2013) investigated the consequences of violation of the conjunction of Conditions (1) through (3), by CE failing to hold, and both CE and ER failing to hold, for
a single population SMD for a study of a hypothetical treatment and
the difference between two population SMDs comparing two hypothetical treatments
based on scores from different measures. Nugent (2009) showed that the population true score SMD for a hypothetical study based on scores from a suppositious measure, and the true score SMD for the same study but based on scores from a second conjectural measure, were the exact same when CE as defined by Equation (1) held for the scores from the two measures. The simulation further showed the SMDs for the hypothetical study but based on scores from these two suppositional measures differed when CE did not hold. Findings showed the magnitude of the difference between the SMDs for the hypothetical study but based on scores from the two conjectural measures increased as CE was increasingly violated as indicated by the correlation between the true scores from these two measures decreasing further and further from 1.0.
In a subsequent model based simulation Nugent (2013) investigated the extent to which the difference between two population SMDs, at both true score and observed score levels, for two conjectural studies (Studies 1 and 2) varied when the SMDs were based on scores from different pairs of k = 8 measures i and j, some of which violated the conjunction,

varied from +.14 to −.13 (see Nugent, 2013, figure 8, p. 93). Results further showed as simultaneous violations of both CE and ER increased in magnitude, with
Nugent (2011, 2013) speculated the variability in the SMDs for a given study, and the variability in the differences between, and rank ordering of, SMDs for two hypothetical studies, found in these simulations as a consequence of violations of CE and ER could propagate through a set of n SMDs in a meta-analysis to negatively affect the results of the meta-analysis. It was basically conjectured a meta-analysis is conducted which includes n studies comparing two different treatments for depression and that (a) measures A or B are used in each of the n studies, and (b) the scores from measures A and B meet,
Purpose of Current Simulation
While simulations have investigated the effects of violations of the combination of Conditions (1) through (3) on a single SMD, and on the difference between two SMDs, none have investigated the conjecture that the results of a meta-analysis of a set of studies can vary as a consequence of violations of this conjunction. To address this absence, the current simulation investigated the question: To what degree do the results of a meta-analysis differ between circumstances in which the SMDs included in the meta-analysis are based on scores from measures which (a) meet CE, and (b) fail to meet CE, as defined by Equation (1)? The main objective was a test of counterfactuals:
Suppose a meta-analysis of n studies comparing five different treatments is conducted, and all of the SMDs in the meta-analysis are based on true scores from either of measures A or B, and the scores from these two measures meet CE as defined by Equation (1). How will the results of the meta-analysis differ, and by what magnitude, if the SMDs are instead based on true scores from not only measures A or B, but also on scores from measures C through F which fail to meet CE, as defined by Equation (1), with respect to each other as well as with respect to measures A and B?
The ER condition was assumed to hold in the simulations, with the reliabilities held constant at 1.0 so the SMDs were true score level, in order to focus on the consequences of violations of CE, as defined by Equation (1), on the results of a meta-analysis. It was also assumed none of the hypothetical measures showed differential test functioning in any subpopulations of population P defined below. The current study builds upon and extends the Nugent (2009, 2013) simulations by simulating and comparing the results of meta-analyses in which (a) CE holds for all measures used in the included studies with the results of meta-analyses in which (b) CE is violated in various ways for some of the measures used in the included studies.
Method
Simulated Populations
A population of persons,
A population of hypothetical studies of
Hypothetical Measures
Hypothetical Measure A
True scores on a hypothetical measure A were simulated for each subpopulation using the random number generator in SPSS version 21. Higher scores on measure A were presumed to indicate lower levels of the mental health problem, and vice versa. The true scores for each subpopulation were normally distributed and with the same variance. The simulated normality of distributions and equality of subpopulation variances for measure A were used to be consistent with the assumptions in the Hedges and Olkin (1985) model. True scores from hypothetical measure A (and hypothetical measures B through F discussed below) were used as opposed to observed scores in order to remove the effects of measurement error from the simulation results and focus on the effects of violations of CE as defined by Equation (1) on the results of meta-analyses.
Hypothetical Alternate Measures
True scores were also simulated for five hypothetical alternate measures, B through F, for subpopulations P0 through P5. Presumed measures of the same construct can have different formats (e.g., Likert type, etc.), numbers of items, item wordings, item measurement characteristics, scoring procedures and ranges of possible scores, and/or utilize different methods, such as self-report or other-report. These differences can influence item responses (Benson & Hocevar, 1985; Bishop, 1987; Bishop, Tuchfarber, & Olendick, 1978; Rosinski, 1989; Swain, Weathers, & Niedrich, 2008; van der Linden, 2011); and the true scores from the different measures, the relationships between their unique true score metrics, and the true score distributions will likely be different (Lord & Novick, 1968; Zikar & Broadfoot, 2009).
Accordingly, the true scores from the hypothetical alternate measures were conceptualized as coming from measures with different formats, numbers of and types of items, and so forth, such that the relationships between the true scores from measure A and the true scores from these alternate measures varied. The true scores from hypothetical measures A and B were conceptualized as congeneric, so were related by a specific case of Equation (1) as shown in the appendix. The reliabilities of the scores from measures A and B were assumed to be 1.0, and were simulated such that no differential test functioning existed for scores from measures A or B in any subpopulations of P, so these scores met
The differences between the numbers of items and/or the item characteristics and/or the informants between measures A and measures C and D were conceived such that portions of the
The relationships between the true scores on measure A and the true scores on measures C and D, shown in the appendix, were simulated so as to violate CE as defined by eqn. (1), but to “measure the same thing” in the sense defined by Hanson, Harris, Pommerich, Sconing, and Yi, (2001, p. 3), who wrote, “Two scores are said to measure the same thing if the true score on one is a function of the true score on the other (i.e., given one true score the other true score is uniquely determined), otherwise they are said to measure different things.” By Hanson et al.’s (2001) definition, the scores from two measures i and j represent the “same thing” if,

where
The non–rank order preserving relationships between true scores from hypothetical measure A and measures E and F were conceptualized as arising as a consequence of the true scores from measures E and F containing true score variance from two latent constructs as well as the scores coming from different informants, such as family members or service providers. The relationships between the true scores from measures A and measures E and F are shown in the appendix. The relationships between the true scores from measure A and measures E and F did not meet either the strong form of CE as defined by Equation (1), or the weaker form defined by Equation (3). The relationships between the true scores from measures A through D are shown in the uppermost portion of Figure 1, between the true scores from measures A and E in the middle graph, and between the true scores from measures A and F in the bottom graph. The correlations, both Pearson and Spearman, between the true scores from simulated measures A through F are shown in Table 1. No assumptions of validity were made for the scores from the hypothetical measures. No assumption was made that the true scores from any one of the hypothetical measures were any more or less valid as a representation of a construct of interest than the true scores from any of the other hypothetical measures.
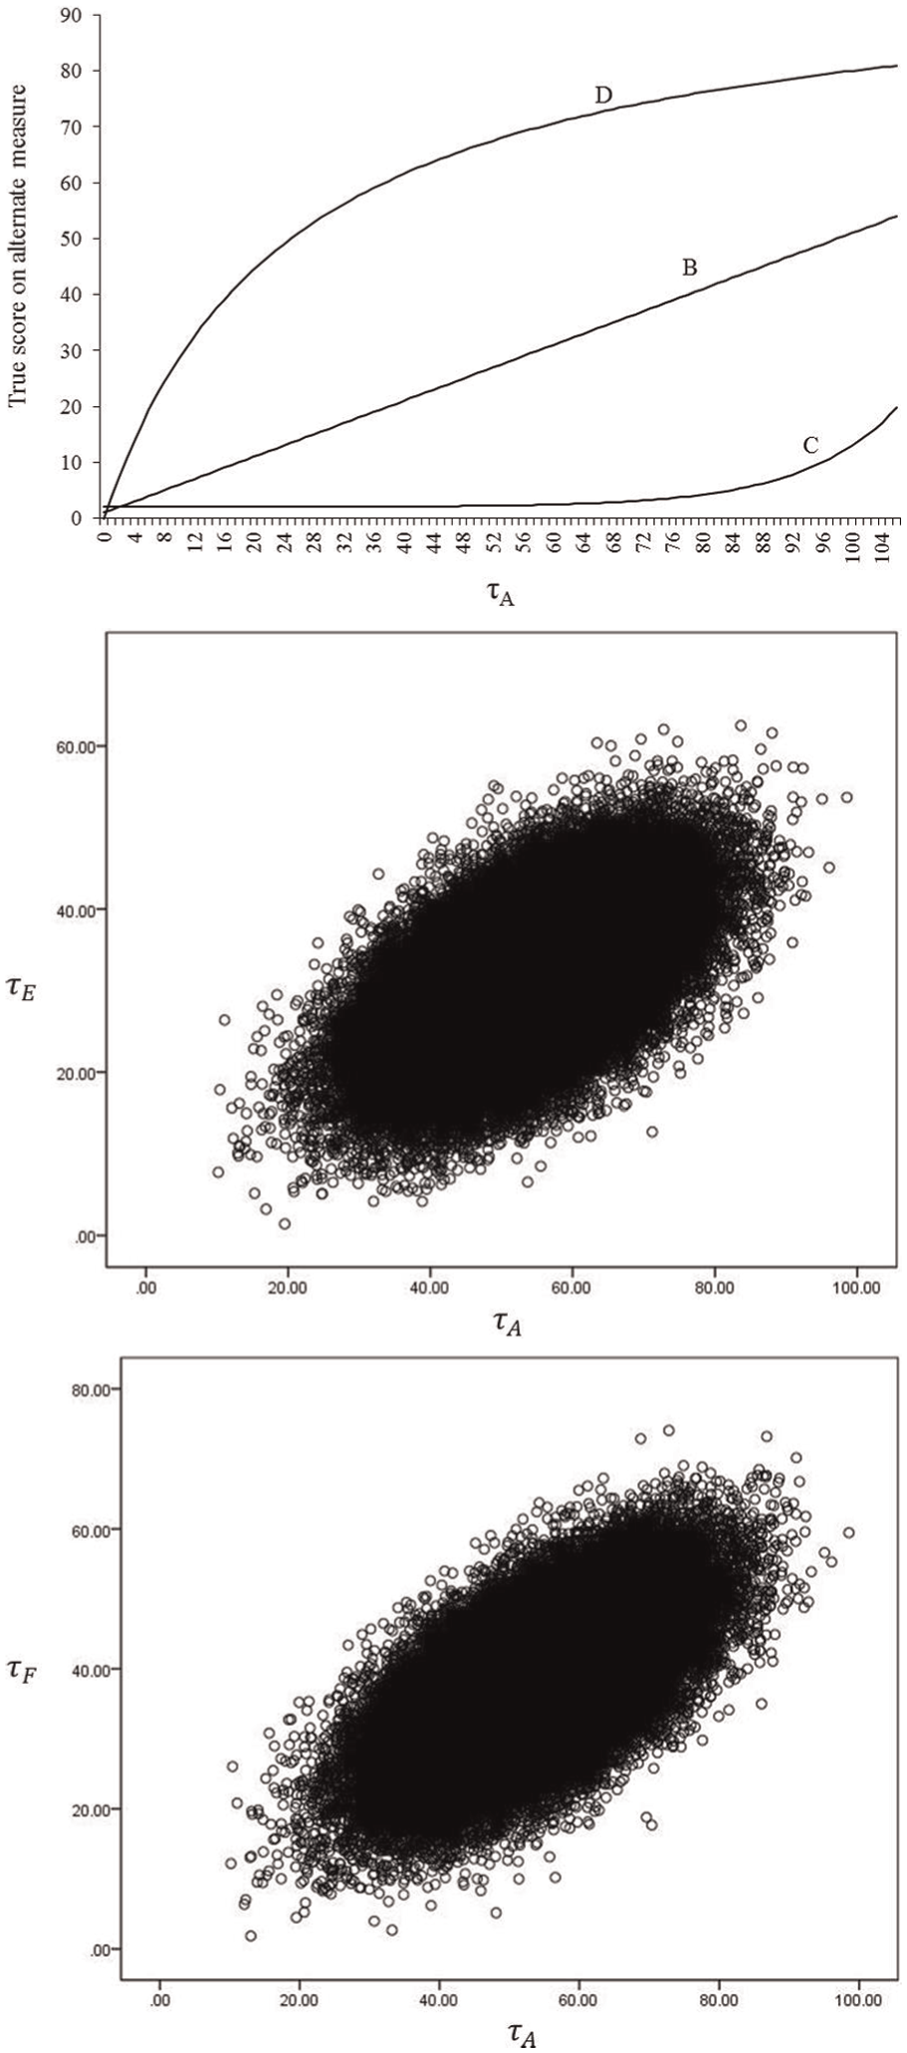
Relationships between true scores from hypothetical measures A through D (top), A and E (middle), and A and F (bottom).
Pearson and Spearman Correlations Between Simulated True Scores for Hypothetical Measures A Through F.
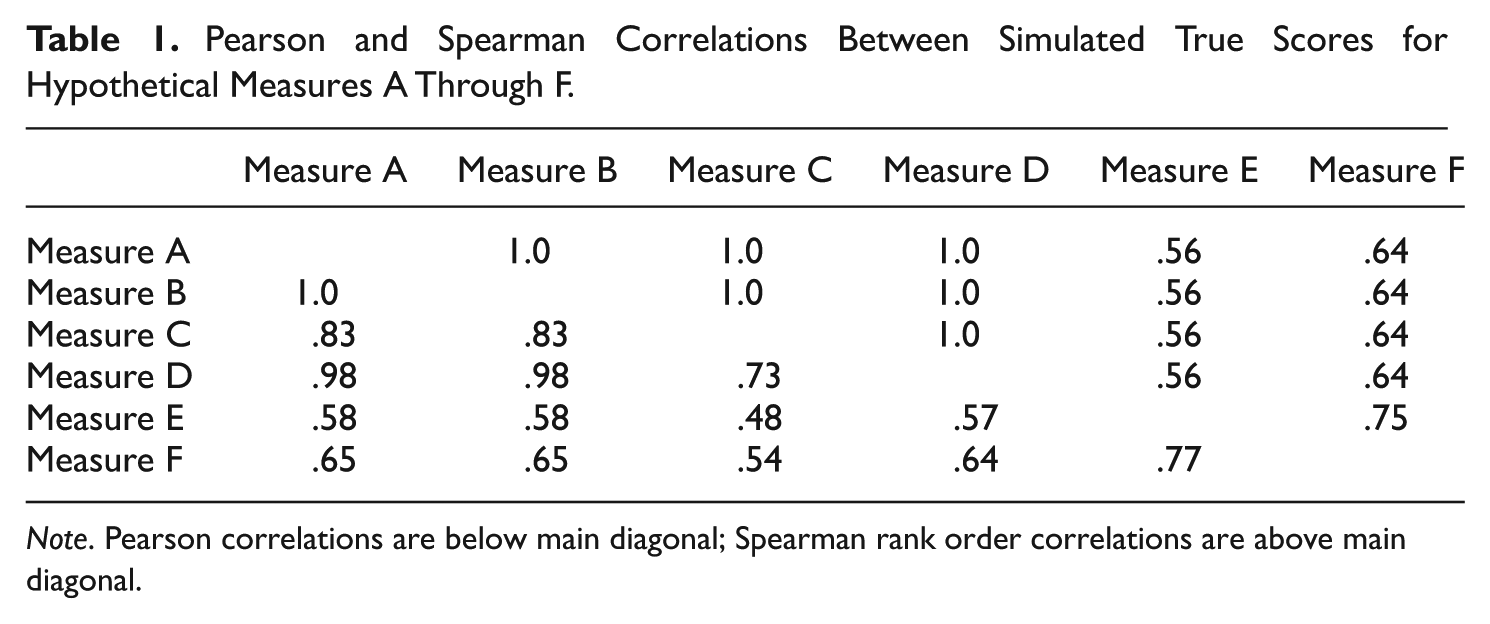
Note. Pearson correlations are below main diagonal; Spearman rank order correlations are above main diagonal.
Subpopulation True Score SMDs
The subpopulation true score SMDs for Treatments 1 through 5 can be seen in Table 2. The true score SMD for comparing subpopulation P1 with P0 based on the scores from measure i (i = A, B, …, F) is the SMD for Treatment 1 and is symbolized as,
Subpopulation True Score Standardized Mean Differences (SMDs) Comparing the Hypothetical Sub-Populations P1 Through P5 With Sub-Population P0 Based on the Contrived Measures A Through F. a
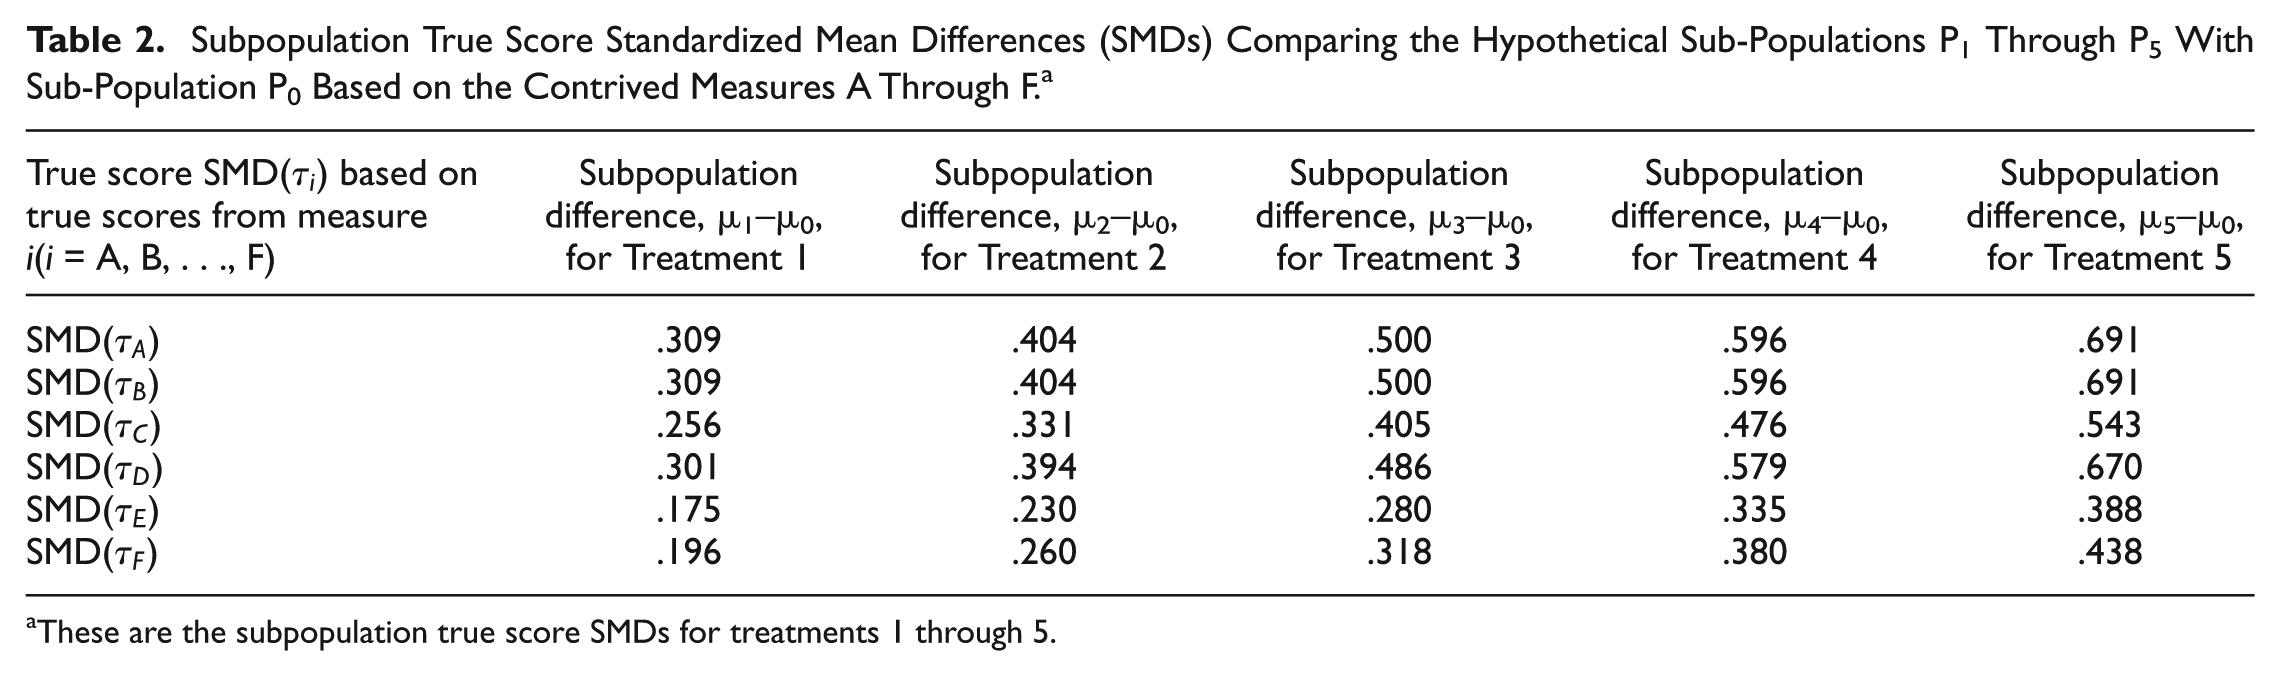
These are the subpopulation true score SMDs for treatments 1 through 5.
Plausibility of Relationships Between Scores from Simulated Measures
An important matter is the extent to which the simulated relationships between true scores on the hypothetical measures correspond to the relationships between true score from extant measures used in research. Ultimately, this issue is an empirical question. One approach to assessing the plausibility the modeled relationships correspond with actual relationships is to compare the correlations between the simulated scores in Table 1 with empirical correlations found between scores from various extant measures of, presumably, the same constructs.
The cross-method validity coefficients in table 3.1 of Meyer (2002, pp. 77-78) for measures of various constructs for children and adolescents ranged from .03 to .42. De Los Reyes et al. (2015) found, in a meta-analysis of 341 studies with 1,218 data points, a mean correlation of .28 (95% confidence interval, .22 to .33) between scores from different measures, based on different informants, of children’s and adolescents’ internalizing and externalizing problems. Achenbach, McConaughy, and Howell (1987) reported mean correlations between scores for children’s internalizing and externalizing problems based on different informants ranging from .28 to .84. Achenbach, Krukowski, Dumenci, and Ivanova (2005) reported mean correlations between scores from different informants for measures of adult psychopathology between .30 and .68. Reported correlations between scores on the Beck Depression Inventory (BDI; Beck, Steer, & Garbin, 1988) and scores on the Hamilton Rating Scale (HRS; Hamilton, 1960) have ranged between .56 and .89 dependent on the population of patients (Moberg et al., 2001; Sean, Woolley, Brown, Ghahramanlou-Holloway, & Beck, 2008; Steer, Beck, Riskind, & Brown, 1987).
In terms of correlations between scores from different self-report measures of presumably the same construct, Stiles and McGarrahan (1998) reported correlations between scores on the Geriatric Depression Scale (GDS; Sheikh & Yesavage, 1986) and other self-report measures of depression ranging from .58 to .89. Duckworth and Kern (2011) reported a mean correlation of .50 between different self-report measures of self-control. Achenbach et al. (1987) reported a mean correlation between different self-report measures of child and adolescent psychopathology of .85. Nugent (2004) reported correlations between three self-report measures of depression ranging from .59 to .87.
The similarity between these empirical correlations and those in Table 1 suggests the relationships between the simulated scores from the hypothetical measures are plausibly consistent with the relationships between scores from different measures of presumably the same construct used in current research.
Monte Carlo Simulation
Six-thousand random samples were drawn from population
Sample estimates of the true score SMDs for comparing the hypothetical treatments with the placebo were computed based on the scores in each of the random samples using the formulas from Borenstein et al. (2009), and Lipsey and Wilson (2001), generating Monte Carlo sampling distributions of estimated SMDs based on the scores from each of the hypothetical measures. Thus, for each random sample there were six estimated true score SMDs, one each based on scores from the hypothetical measures A through F. For example, for Treatment 1 there were six estimated SMDs:
Simulated Meta-Analyses
A simple random sample of 60 simulated studies was drawn from the hypothetical population of studies, 12 for each treatment; that is, 12 in which Treatment 1 was compared with the placebo; 12 in which Treatment 2 was compared with the placebo; and so forth. The mean sample size in simulated studies comparing Treatment 1 with the placebo was 242.9 (SD = 10.83); in studies comparing Treatment 2 with the placebo, 235.6 (SD = 14.31); in studies comparing Treatment 3 with the placebo, 230.7 (SD = 12.89); in studies comparing Treatment 4 with the placebo, 236.2 (SD = 14.34); and in studies comparing Treatment 5 with the placebo, 229.6 (SD = 16.66). The total number of simulated studies in each meta-analysis, 60, was in the 70th percentile of the distribution of numbers of studies in the meta-analyses examined by Lipsey and Wilson (1993).
Three meta-analyses were conducted. These meta-analyses were conceptualized as conducted by researchers interested in the relative magnitudes of the effect sizes for the five different treatments relative to the placebo. In the first, it was assumed that all 60 SMDs were based on scores from either of hypothetical measures A or B. The second meta-analysis was counterfactual to the first. In this second meta-analysis, the 12 studies of hypothetical Treatment 1 were based on scores from measures A, B, and D. In the 12 studies of Treatment 2 the SMDs were based on scores from measures C, E, and F. In the 12 studies of Treatment 3, the SMDs were based on scores from measures A and B. In the 12 studies of Treatment 4, and the 12 studies of Treatment 5, the SMDs were based on scores from measures E and F. In the third meta-analysis, counterfactual to the first two, the SMDs for Treatment 1 were based on scores from measure A or B. The SMDs for Treatment 2 were based on scores from measure C; for Treatment 3, measure F; and for treatments 4 and 5, measure E.
The purpose of the three meta-analyses was to investigate the extent to which the results of the first meta-analysis, in which all SMDs were based on true scores meeting CE, compared with the results of the two counterfactual meta-analyses in which some SMDs were based on scores from measures meeting CE, while others were based on scores from measures which failed to meet CE. The simulated meta-analyses, including subgroup analyses, were conducted using both fixed effects and random effects analysis methods described by Borenstein et al. (2009) and Lipsey and Wilson (2001).
Results for Sampling Distributions
Sampling Distributions
The sampling distributions for all estimated true score SMDs were tested for normality using the one sample Kolmogorov-Smirnov test. Results for all sampling distributions were consistent with normality. Tests of bias of the means of the sampling distributions were conducted using a single sample t test with a critical alpha set at .002 in order to protect for inflated type I error across the 25 statistical tests. Only the means of the sampling distributions for the SMDs,
Complete Interchangeability
A measure of the overlap (OVL) of two distributions was defined by Reiser and Faraggi (1999) as,

where
The Monte Carlo estimated sampling distributions of estimated true score SMDs based on true scores from simulated measures A and B all overlapped 100%. The means of the Monte Carlo sampling distributions of estimated true score SMDs for a given treatment–placebo comparison based on scores from hypothetical measures A and B were equal, and the standard deviations (hence standard errors of the means) were equal. The sample estimated SMDs based on scores from hypothetical measures A and B were equal:
Results of Meta-Analyses
Simulated Meta-Analyses Number One
The results of the overall test of homogeneity of the SMDs comparing the different treatments, with all SMDs based on scores from either measure A or measure B, was,
These results are shown graphically in Figure 2 by the diamond-shaped markers in the leftmost portion of the figure. The diamond-shaped points mark the estimated mean SMDs for the different hypothetical treatments identified on the horizontal axis. The vertical bars attached to each diamond point mark 95% random effects confidence intervals (CIs) for the estimated mean SMDs. The results of statistical tests of the differences between the estimated mean SMDs for the different treatments are shown in Table 3, with fixed effects results in normal font, and random effects results in boldface. These results are for all meta-analyses in which the SMDs were based on scores from measures A and/or B. The results of the meta-analysis were invariant across any combination of SMDs based on scores from measures A and/or B used in the hypothetical studies.
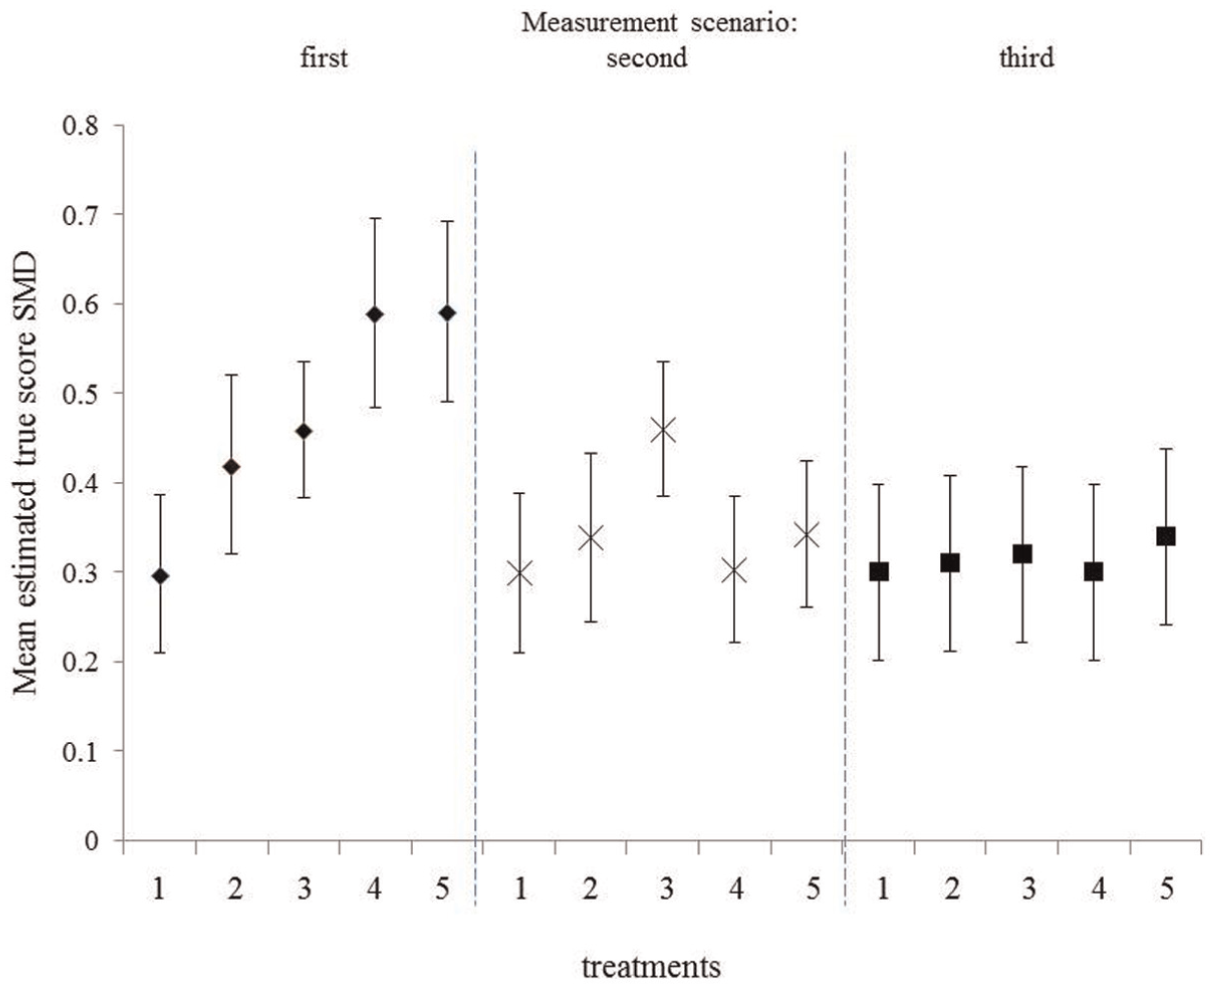
Results of three meta-analyses for five hypothetical treatments.
Results of Comparisons of Standardized Mean Difference (SMD) Effect Sizes for Treatments 1 Through 5 Based on True Scores From Either Hypothetical Measure A, B, or a Combination of A and B in the Simulated Studies.
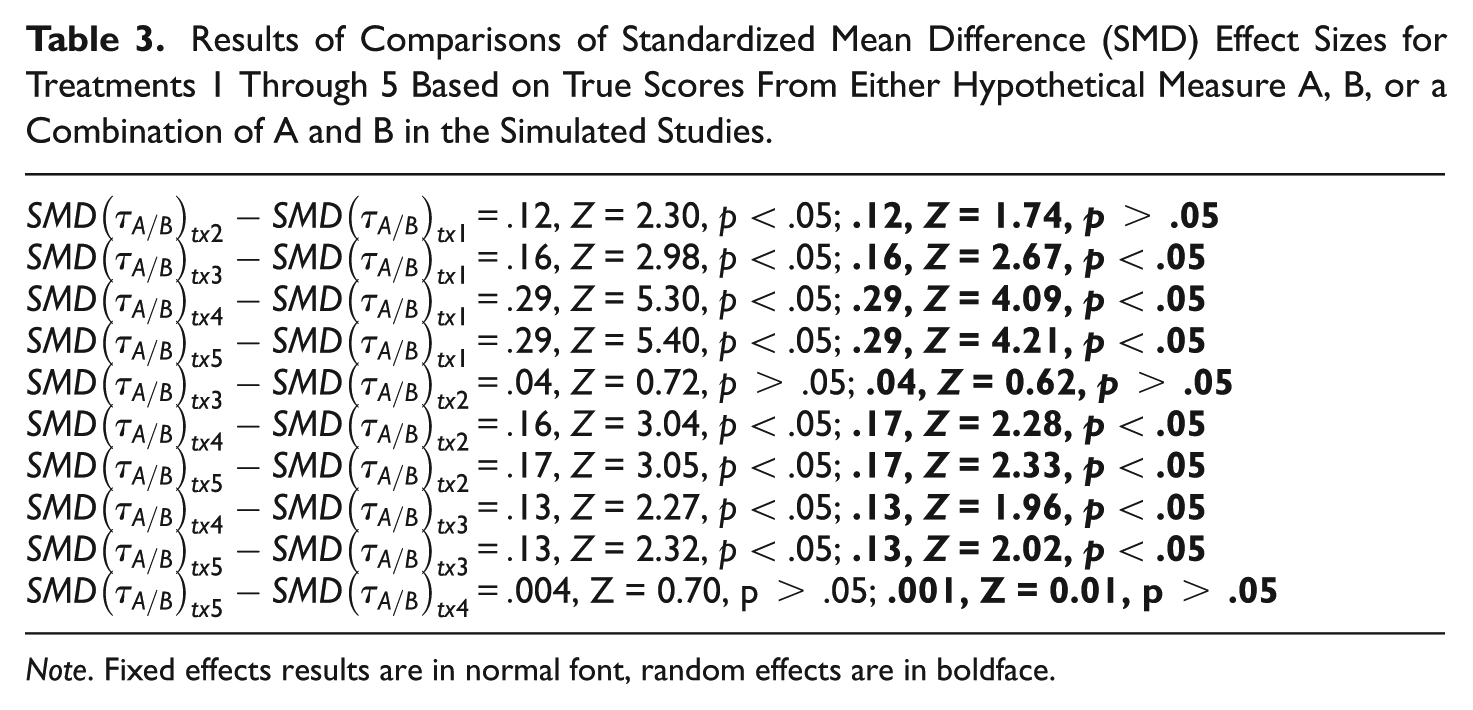
Note. Fixed effects results are in normal font, random effects are in boldface.
Counterfactual Meta-Analysis One
The results of the counterfactual overall test of homogeneity of SMDs comparing the different treatments, with the SMDs based on scores from measures B, D, C, E, and F, was,
These results are shown graphically in the middle portion of Figure 2 by the X markers, along with 95% random effects CIs for the estimated mean SMDs for the different treatments. The results of statistical tests of differences between SMDs for the different treatments are shown in Table 4, with fixed effects results in normal font, and random effects in boldface.
Results of Comparisons of Standardized Mean Difference (SMD) Effect Sizes for Treatments 1 Through 5 Based on True Scores From Hypothetical Measures A/B, C, D, and E.
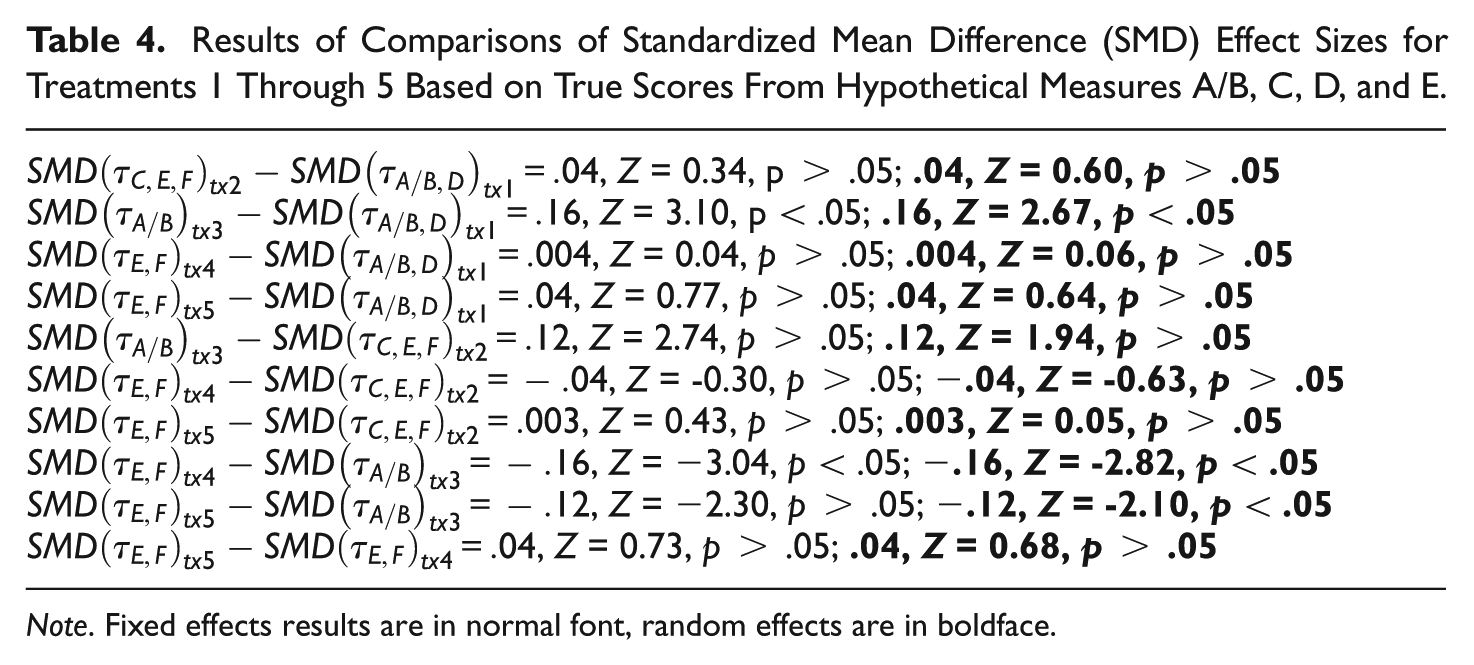
Note. Fixed effects results are in normal font, random effects are in boldface.
Counterfactual Meta-Analysis Two
The results of the counterfactual analysis two overall test of homogeneity of the SMDs comparing the different treatments, with the SMDs based on scores from measures A or B, C, E, and F, was,
Summary of Results
The results of these three meta-analyses can be summarized as follows. The first meta-analysis suggested that Treatments 3, 4, and 5, relative to placebo, were superior to Treatment 1 relative to placebo; Treatments 4 and 5 were superior to Treatment 2; and treatments 4 and 5 were superior to Treatment 3. The second meta-analysis suggested that Treatment 3 was superior to Treatment 1; and in findings contradictory to those of the first meta-analysis, Treatment 3 was superior to both Treatments 4 and 5. Meta-analysis three suggested all the five treatments were equally effective. The finding that Treatments 3, 4, and 5 were equally effective was contradictory to the results of the first two meta-analyses.
The only differences between these three meta-analyses were the measures on which the SMDs were based. The differences in results summarized here, and shown in Figure 2, were due to violations of CE, as defined by Equation (1).
Limitations
There were limitations in the current Monte Carlo study. First, the generalizability of the results to current meta-analyses is unclear. The congruence between the correlations amongst the simulated true scores and the empirical correlations between scores from extant measures of the same constructs were consistent with the relationships between simulated measures being representative of relationships between true scores from existing measures used in research. However, this congruence does not necessarily imply the representativeness of the simulated relationships to the relationships between true scores from extant measures of the same constructs. There remains a degree of uncertainty as to the extent to which the relationships between true scores simulated in the current study actually exist between extant measures of presumably the same construct.
The current simulation focused on true score SMDs so as to control for the effects of measurement error and focus on the effects of violations of CE as defined by Equation (1). Consequently, the results of this simulation were limited to true score SMDs. While Nugent’s (2013) model–based simulation results suggested that simultaneous violations of both CE and ER may lead to even greater variability of the results of meta-analyses than violations of CE alone, future Monte Carlo studies of the effects of violations of both CE and ER on the results of meta-analyses need to include measurement error and focus on observed score SMDs.
A final limitation concerns the focus in the current simulation on the SMD EFS. The consequences of violations of Conditions (1), (2), and (3) on the results of meta-analyses of EFSs other than the SMD are speculated to be similar to those found in the current study. However, future research needs to include investigation of the effects of violations of these three conditions on meta-analyses in which EFSs other than the SMD are used.
Discussion and Conclusion
The findings of this simulation study add to previous research by demonstrating that the results of meta-analyses of SMDs representing effects of different treatments can vary as a function of the measures the SMDs were based on when CE as defined by Equation (1) was violated. These findings were consistent with Nugent’s (2011, 2013) speculations. Sources of this variation appeared to be (a) differences in the relative and rank ordering of persons’ true scores on the different measures, which led to differences in shapes of distributions of true scores from the different measures and (b) construct irrelevant variance in the true scores from measures associated with latent constructs other than the construct of interest. These differences propagate through to estimated true score SMDs, producing differences in magnitude of SMDs for the same study but based on scores from different measures. The negative effects on the results of meta-analyses appeared to be most substantial when the distributions of true scores from the different measures differed markedly; when the relative and rank ordering of true scores for persons differed markedly for the different measures; and when the true scores from the different measures contained variance associated with constructs other than the construct of interest. Further research is needed to better explicate the conditions under which violations of CE as defined by Equation (1) have the most significant impact on the results of meta-analyses.
The results of the simulation suggested there may be practical consequences for meta-analytic results as a consequence of violations of CE as defined by Equation (1). First, the effects of violations of this form of CE can lead to attenuation or inflation of homogeneity Chi-square statistics. This may lead to erroneous conclusions about homogeneity of EFSs. In some cases, the erroneous conclusion may be that the SMDs are homogeneous, while in others the erroneous conclusion may be the presence of heterogeneous SMDs.
The results of comparisons of differences between mean SMDs may also differ as a result of violations of CE as defined by Equation (1). Consequently, the results of a meta-analysis may be an artifact of the particular measures that happened to have been used in the studies included in the meta-analysis. The relative differences between, and the rank ordering of, estimated mean SMDs for different treatments may differ merely as a function of the measures the SMDs are based on. Use different measures in the studies in the meta-analysis and the results of the meta-analysis may be quite different. Thus, the findings suggested violations of CE as defined by Equation (1) could lead to contradictory and erroneous conclusions about the relative ordering of SMDs, and consequently of the relative efficacy of different interventions, from subgroups analyses. Nugent’s (2013) results suggest measurement error may amplify these problems. Future simulations need to focus on the effects of violations of both CE and ER on the results of meta-analyses of observed score SMDs to confirm this possibility.
The results of this simulation suggest the need for research investigating the extent to which the effects associated with violations of CE, as defined by Equation (1) and found in the current study, can be found in extant meta-analyses. One example is studies investigating whether multiple SMDs, based on different measures, representing a given treatment effect are estimates of the same SMD EFS. The purpose of such studies would be to investigate the possibility the SMDs for the treatment effect based on the different measures differ because of violations of CE as defined by Equation (1). For example, suppose a study included in a meta-analysis used three measures of depression, the GDS, BDI, and HRS. If CE as defined by Equation (1) held for the scores from these three measures, the sample estimated SMDs for the treatment effect based on the scores from these measures will be estimates of the same SMD EFS. If the correlations between the scores from these three measures are available, the test procedure described by Hedges and Olkin (1985, pp. 210-213) could be used to test the hypothesis the SMDs based on each of these three measures were estimates of the same population SMD. Rejection of this statistical hypothesis would be evidence suggesting CE as defined by Equation (1) did not hold for the scores from these measures in the study and as a result the estimated SMDs differed, much like the SMDs in Table 2 for a given treatment differed, when based on the measures which failed to meet CE as defined by Equation (1).
A second example is studies investigating whether the results of an extant meta-analysis differs as a consequence of the SMDs in the included studies being based on different measures of the same construct. For example, suppose a meta-analysis contains n studies and all of the studies employed multiple measures of the same construct. This meta-analysis could be redone, with SMDs in the studies based on different combinations of measures. If the results could be shown to vary as a consequence of which measures the SMDs are based on in the different studies it would be consistent with the results of the current simulation study and with Nugent’s (2011, 2013) speculations.
The models of the SMD explicated by Hedges and Olkin (1985) and Nugent (2012) in effect state that a specific form of measurement equivalence must hold across a set of measures in order for SMDs based on scores from the different measures to be comparable to a degree allowing a meta-analysis to be conducted. The results of the current Monte Carlo study offer insight into the practical consequences for the results of a meta-analysis if the CE, as defined by Equation (1), aspect of the measurement equivalence fails to hold. Research is needed to further illuminate the consequences for the results of meta-analyses if the form of measurement equivalence defined earlier fails to hold for the measures on which SMDs in a meta-analysis are based.
Footnotes
Appendix
The true scores on measures A and B were related by the linear equation
The relationship between the true scores on measures A and C was given by
and between the true scores on measures A and D by
The relationship between the true scores from measures A and E was given by
where the scores
where the scores
Declaration of Conflicting Interests
The author(s) declared no potential conflicts of interest with respect to the research, authorship, and/or publication of this article.
Funding
The author(s) received no financial support for the research, authorship, and/or publication of this article.