
Abstract
A readily applicable procedure is discussed that allows evaluation of the discrepancy between the popular coefficient alpha and the reliability coefficient of a scale with second-order factorial structure that is frequently of relevance in empirical educational and psychological research. The approach is developed within the framework of the widely used latent variable modeling methodology and permits point and interval estimation of the slippage of alpha from scale reliability in a population under investigation. The method is useful when examining the consistency of complex structure measuring instruments assessing higher order latent constructs and, under its assumptions, represents a generally recommendable alternative to coefficient alpha. The outlined procedure is illustrated using data from an authoritarianism study.
Keywords
Reliability is a major psychometric quality index commonly used in the educational and behavioral sciences. Coefficient alpha (e.g., Cronbach, 1951) is frequently used to appraise the reliability of multicomponent measuring instruments that are highly popular in these and cognate disciplines. Meanwhile, a large body of research on the properties of alpha has accumulated that explicates the conditions under which this coefficient can be considered sufficiently informative about scale reliability in studied populations. In particular, Raykov (1997) showed that under restrictive yet testable conditions, coefficient alpha has minimal population slippage from scale reliability, which is negligible for most empirical purposes (see also Raykov & Marcoulides, 2015; Raykov, West, & Traynor, 2015). When these conditions do not hold, however, alpha can be seriously misleading (e.g., Sijtsma, 2009), as can also be the closely related index “alpha if item deleted” that is currently often used by researchers involved in scale construction and development.
Despite these limitations, the continued popularity of coefficient alpha and the last-mentioned index across various disciplines remains extensive. There seems to be also a tendency among some applied scientists to use alpha as a coefficient presumably informing about reliability with measuring instruments possessing complex structure that cannot be even approximately considered unidimensional. A particular type of such measuring instruments taps into several interrelated constructs that load on a second-order factor common to them. These instruments are likely to be of relevance in empirical research when validity considerations and especially construct underrepresentation concerns may lead scholars to include components related to more than one latent variable in an instrument being developed. For example, a mathematics ability test could consist of one part evaluating algebra ability, another assessing geometry ability, a third measuring trigonometry ability, and a fourth comprising problems assessing abstract thinking ability; thereby, these four abilities may load on a second-order factor representing the targeted mathematics ability (e.g., Raykov, Marcoulides, & Menold, 2017). In situations like this, the reliability of the overall scale score is oftentimes of particular interest. However, as may be implied from Novick and Lewis (1967), it would in general be incorrect to use coefficient alpha then despite its still high popularity as an index of overall scale consistency. The reason is that with uncorrelated measurement errors alpha is a lower bound of reliability, with the population discrepancy of the former from the latter possibly being of marked magnitude (e.g., Raykov, 1997; for the correlated error case, when that slippage of alpha can be considerable, see for instance Bollen, 1980, and Raykov & Marcoulides, 2011).
The present note aims to contribute to the study of the population discrepancy between coefficient alpha and scale reliability, focusing specifically on measuring instruments possessing second-order factorial structure. To this end, we discuss a latent variable modeling (LVM; e.g., B. O. Muthén, 2002) procedure, which allows point and interval estimation of the population slippage of alpha from the reliability coefficient pertaining to the overall sum score (or mean) of the components of such instruments. The goal of the article is also to raise awareness about what may be considered at times nearly indiscriminate use of coefficient alpha in some areas of empirical educational and psychological research, particularly with tests, scales, or inventories possessing a second-order latent structure, where alpha can be seriously misleading as a lower bound of reliability. The discussed method is illustrated on data from a study involving measurement of the multidimensional concept of authoritarianism (e.g., Beierlein, Asbrock, Kauff, & Schmidt, 2014, and references therein).
Background, Notation, and Assumptions
To achieve the aims of this note, we assume that a set of (approximately) continuous measures are given (cf. Raykov et al., 2018). We will denote them as y1, y2, . . . , yp (p > 1) and presume that they represent the components of a measuring instrument whose sum score reliability is of interest to evaluate. Given the concerns of the article, we posit the following second-order factorial structure for these p components:

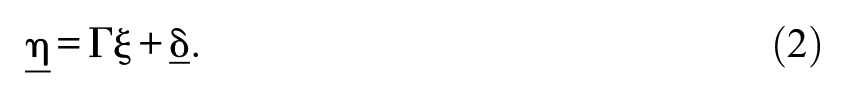
In Equations (1) and (2), which represent the general model underlying this article,
Evaluating the Population Slippage of Coefficient Alpha From Reliability of Measuring Instruments With Second-Order Factorial Structure
As discussed in detail in Raykov et al. (2017), Equations (1) and (2) imply that it would not be appropriate, strictly speaking, to view as unidimensional the instrument comprising the components
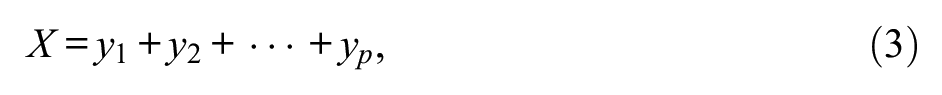
or the weighted sum

using weights wj that are known beforehand or estimated.
The well-known coefficient alpha (α) is defined as (e.g., Crocker & Algina, 2006):

where Var(·) denotes variance of the random variable within parentheses. As can be readily seen from Equation (5), alpha is “agnostic” of a second-order factor structure that could be associated with the components yi (i = 1, . . . , p). In fact, even though each of the variances participating in the right-hand side could be expressed then in terms of the parameters of the second-order factor model (Equations 1 and 2), those expressions like the fact that underlying is a second-order structure are irrelevant for the value of alpha in a given sample or population of concern.
Measuring instruments possessing second-order factorial structure have attracted considerable interest in recent decades by methodologists and substantive researchers. In particular, as discussed in Raykov and Marcoulides (2012) the reliability of the overall sum score X is then representable as (see Equations 1 and 2, and recall the uncorrelated error term assumption for the first-order factor indicators)

where θj = Var(εj), Lj are the sums of the first-order factor loadings of the components pertaining to the jth factor ηj, ψj = Var(δj) are the associated latent disturbance variances, γj are the loadings of the jth first-order factor η j on the second order factor ξ (recall also the earlier made assumption of all factor variances being 1; j = 1, . . . , q; see below and the appendix).
From Equations (5) and (6), it follows with some straightforward algebra that the population discrepancy Δ between coefficient alpha and the scale reliability coefficient for the setting of relevance in this article is
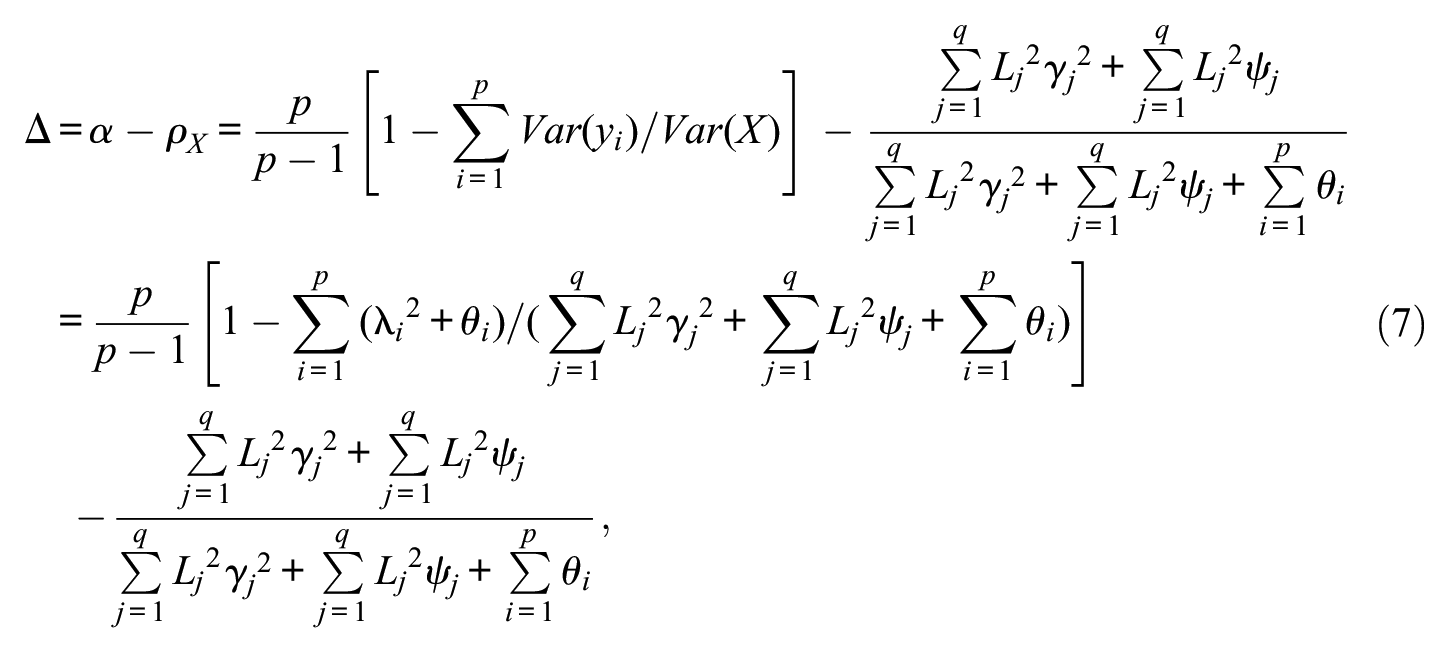
where for notational simplicity λ i denote the loadings of the components yi on their pertinent factors (and the unit latent variance assumption is made use of; i = 1, . . . , p). We note that in the present setting the discrepancy Δ is in general positive. This follows from a main result in Novick and Lewis (1967), which states that with uncorrelated errors population alpha is a lower bound of scale reliability unless the scale components are essentially tau-equivalent (i.e., evaluating the same common true score with the same units of measurement) when it equals reliability (see also Raykov & Marcoulides, 2011).
From the right-hand side of Equation (7), we realize that the population slippage of alpha from scale reliability for instruments with second-order factorial structure is a nonlinear function of parameters of the model defined in Equations (1) and (2). Thus, when that model is plausible for a studied population, after fitting it to sample data from the latter using LVM a researcher can point and interval estimate this slippage. Specifically, substituting the estimates of the model parameters into the right-hand side of Equation (7) we obtain the estimate of the population slippage of alpha as

where a hat denotes estimate of the parameter underneath (see Equation 7). In particular, when the popular maximum likelihood (ML) method of parameter estimation is used (with observed variable normality; e.g., Bollen, 1989), Equation (8) renders the ML estimator of the population slippage of coefficient alpha from the reliability coefficient of the overall scale score X, due to the invariance property of ML estimators (e.g., Casella & Berger, 2002).
In an empirical study the point and interval estimates of the population discrepancy Δ between alpha and scale reliability, which are obtained with the discussed procedure, will be very informative when a researcher is interested in evaluating the extent to which use of coefficient alpha can be misleading and underestimating reliability of scales with second-order factorial structure (with uncorrelated error terms). In the next section, we illustrate this LVM-based method using empirical data from an authoritarianism study. We exemplify there the degree to which being concerned with coefficient alpha rather than scale reliability itself can misinform a researcher using measuring instruments with a higher order latent structure.
Illustration on Empirical Data
For the aims of this section, we use data from a study of n = 238 members of an online panel representing a sample of German adults (Internet users), which was concerned with examining right-wing authoritarianism. For further details on this study, we refer to Raykov et al. (2017), who used another portion of that data set for the purpose of illustrating a method for evaluating latent criterion validity. As discussed in the last source, authoritarianism as a second-order factor is measured in this empirical study by the so-called Short Scale of Authoritarianism (SSA) consisting of nine indicators (items) that cover three latent dimensions referred to as Aggression, Submission, and Conventionalism (see Table 1 in Raykov et al., 2018, for specifics regarding these items and dimensions).
To illustrate the LVM procedure for evaluation of the population discrepancy between coefficient alpha and scale reliability discussed earlier in this article, we fit to the used data set the model defined by Equations (1) and (2) with p = 9 and q = 3 (see the appendix for the needed Mplus source code). This model includes a total of four latent constructs—the above three first-order factors of Aggression, Submission, and Conventionalism with three indicators each, and their second-order factor Authoritarianism. Since the nine observed variables (SSA components) were evaluated each using a 5-point numeric fully verbalized rating scale with no extreme skewness, they are considered for the illustration purposes of this section as approximately continuous measures on which the robust ML method of model testing and parameter estimation is applied (cf. DiStefano, 2002; see also Raykov & Marcoulides, 2011). To deal with a notable proportion of missing data in the manifest measures and counteract possible violations of the missing at random (MAR) assumption underlying this method, we also include as an auxiliary variable the score from the so-called Left-Right Self-Placement (LRSP) scale (e.g., Enders, 2010; see also Raykov et al., 2018, for rationale behind this auxiliary variable choice).
The described model, when fitted to the data from these nine SSA measures, was found to be associated with the following tenable fit indices: chi-square (χ2) = 28.773, degrees of freedom (df) = 24, p value (p) = .229, and root mean square error of approximation (RMSEA) = .043 with a 90% confidence interval (0, .073). The resulting parameter estimates in it are presented in Table 1.
Parameter Estimates, Standard Errors, t Values, and Two-Tailed p Values Associated With Fitted Model (Software Output Format).
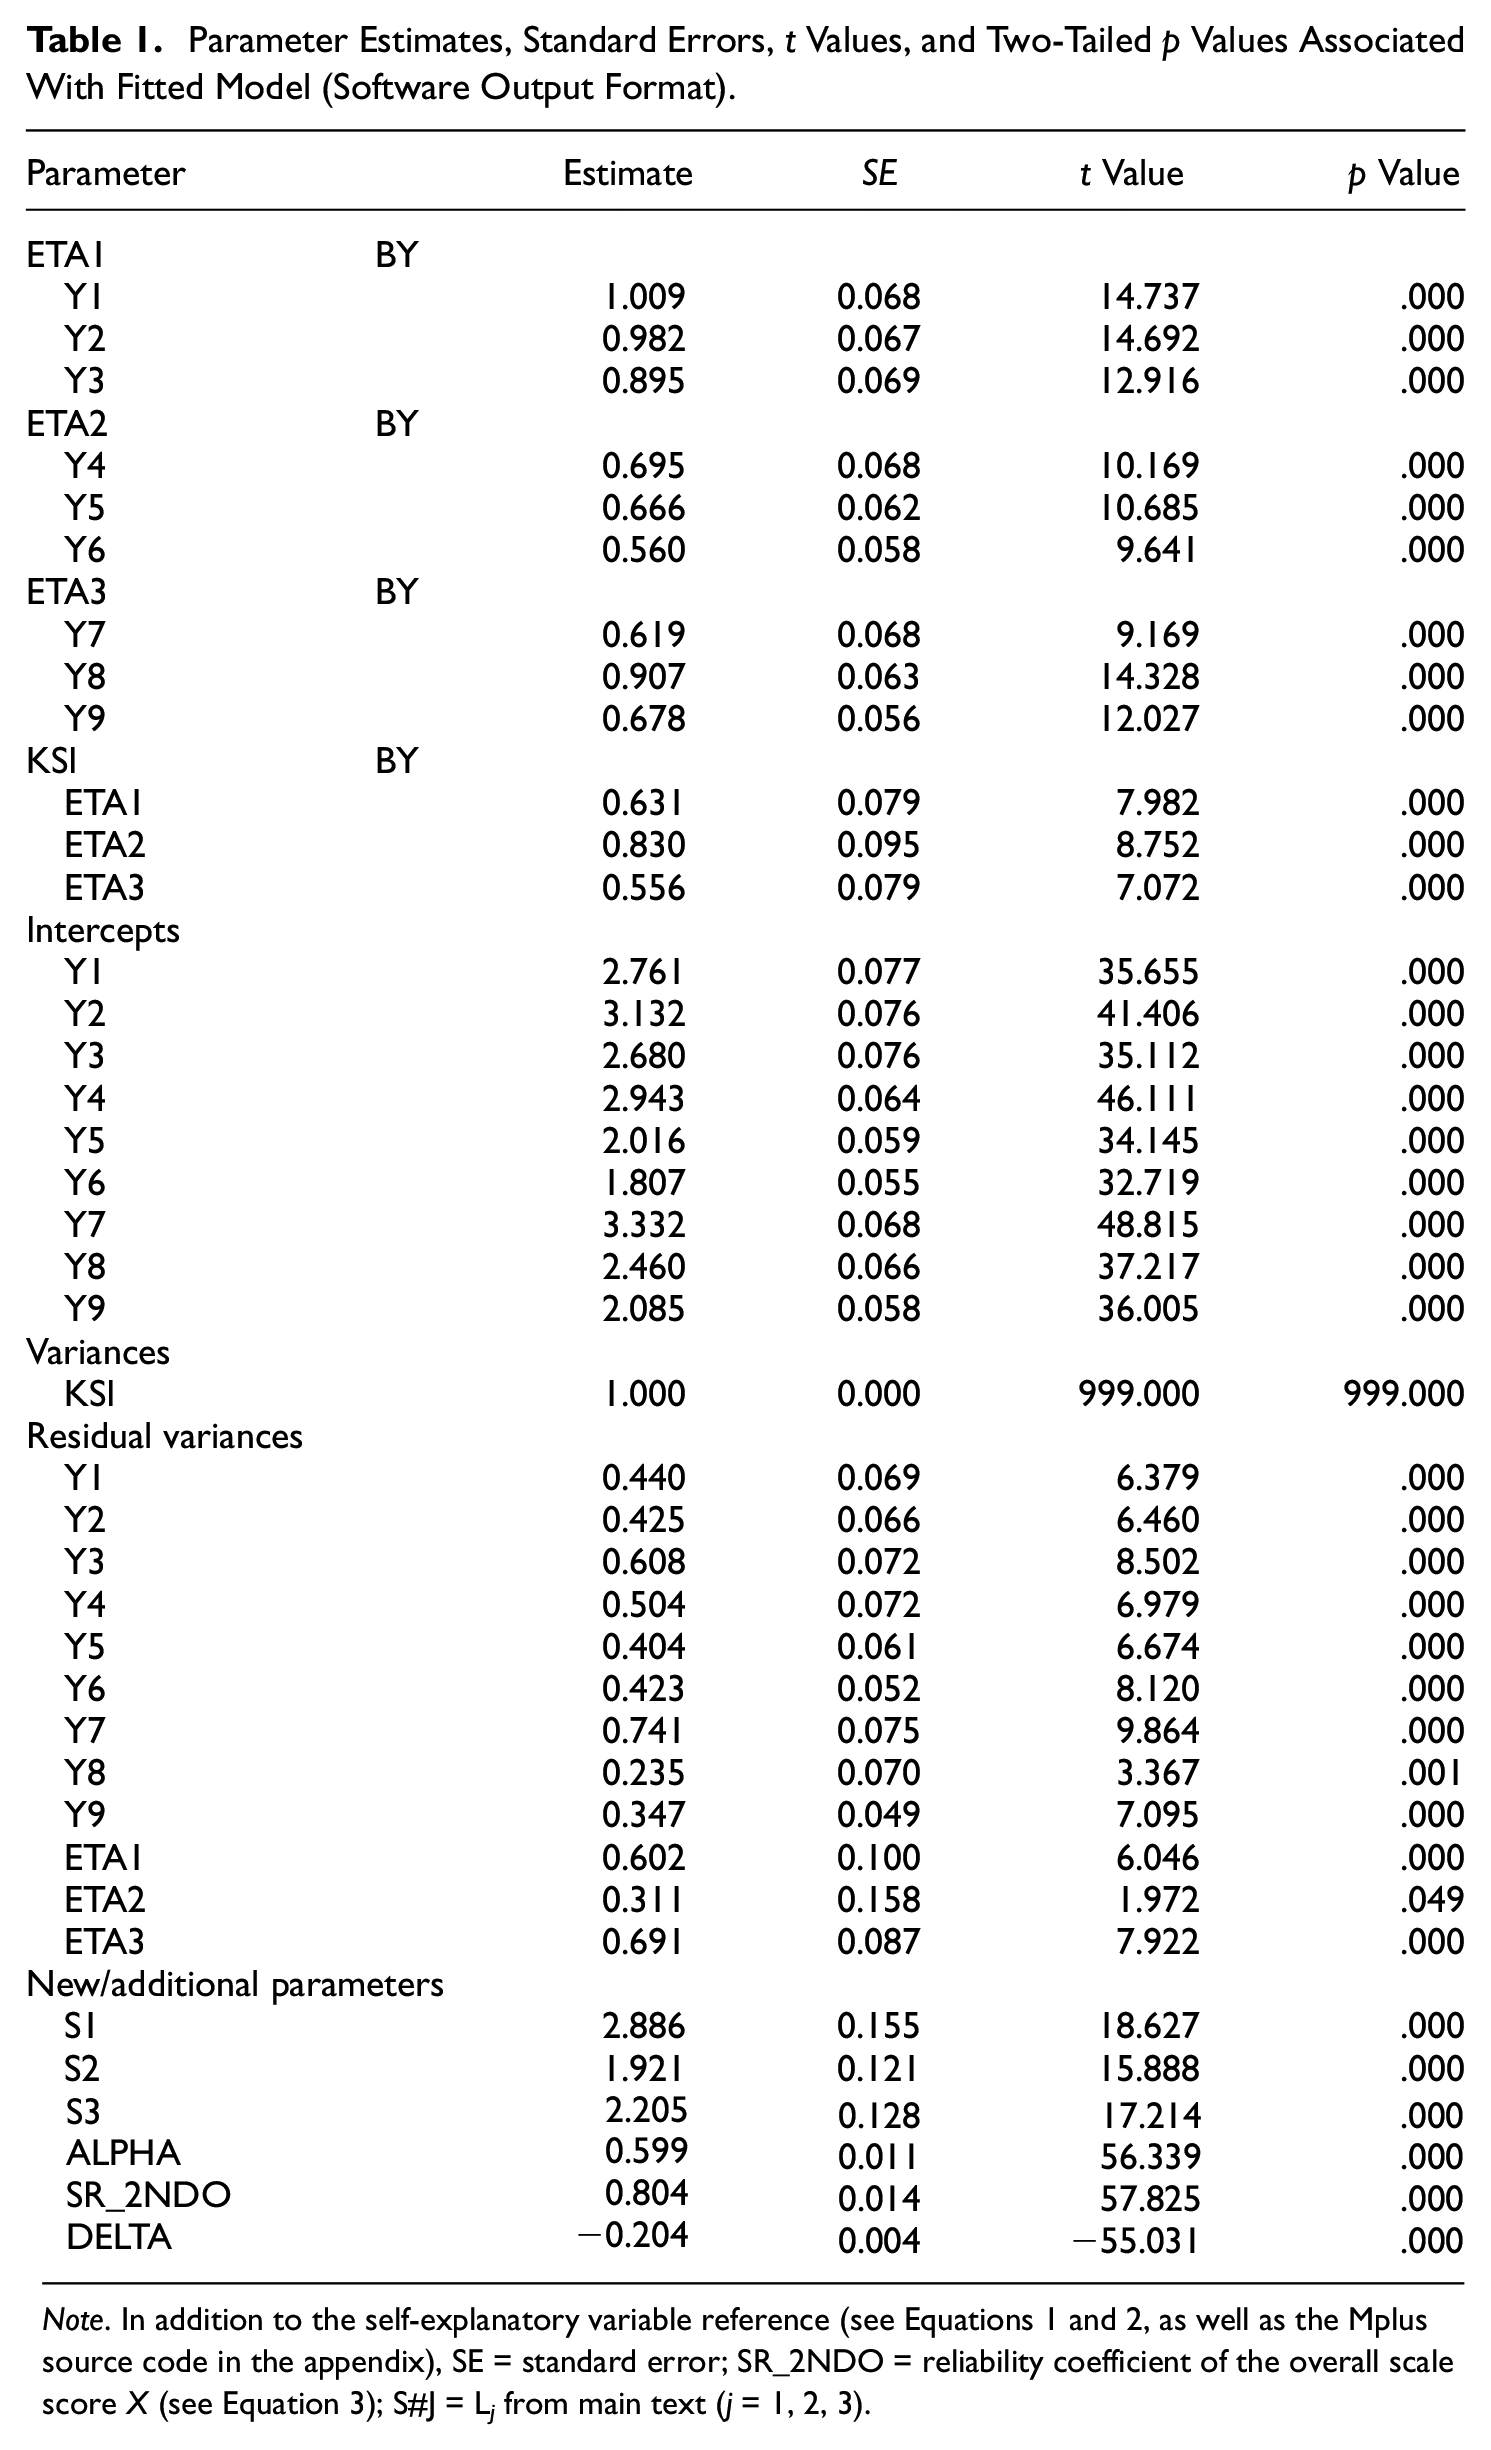
Note. In addition to the self-explanatory variable reference (see Equations 1 and 2, as well as the Mplus source code in the appendix), SE = standard error; SR_2NDO = reliability coefficient of the overall scale score X (see Equation 3); S#J = L j from main text (j = 1, 2, 3).
In this plausible model, of particular interest are the estimates of coefficient alpha as well as scale reliability, and especially their difference. As seen from the last three rows of Table 1 the estimate of coefficient alpha, .599, is markedly lower than that of the authoritarianism scale reliability, .804. Their discrepancy is thereby estimated as
Conclusion
This note was concerned with a LVM procedure for point and interval estimation of the population slippage of the popular coefficient alpha from the reliability coefficient of a scale with a second-order factorial structure. The article also aimed at raising awareness about use of coefficient alpha in lieu of scale reliability itself in empirical settings with this type of complex latent structure (and uncorrelated measurement errors; see below). Specifically, under the assumptions made in the article (see Equations 1 and 2 and surrounding discussion), use of coefficient alpha cannot be generally recommended for the purpose of evaluating scale reliability. Rather, an application of Equation (6) is recommended then for point and interval estimation of reliability of measuring instruments with second-order factor structure (see next and Raykov & Marcoulides, 2012).
Several limitations of the discussed approach are worthwhile pointing out here (cf. Raykov et al., 2018). One, the procedure assumes (approximately) continuous individual scale components (first-order factor indicators). In case of indicator normality, as mentioned above use of ML estimation is appropriate and yields ML estimates of the alpha to reliability discrepancy, as well as of the overall scale’s reliability and coefficient alpha if of interest (see the second term in the right-hand side of Equation 7, and Raykov & Marcoulides, 2012). With up to mild deviations from normality, which do not result from piling at scale end for an individual component(s), it may well be recommendable to use the robust ML method (MLR; L. K. Muthén & Muthén, 2017), possibly also with components having as few as 5 to 7 response options (e.g., DiStefano, 2002; see also the appendix). We encourage however further research on the robustness of the MLR method in such situations. With fairly large samples, weighted least squares (WLS) estimation is also available with nonnormal continuous instrument components (e.g., Bollen, 1989). Also, the outlined procedure is best used with large samples, owing to the fact that its application rests on ML, robust ML, or WLS estimation, with all of them grounded in asymptotic statistical theory (e.g., B. O. Muthén, 2002). Future research will hopefully contribute to the development of possible guidelines for determining sample sizes at which one could rely on that large-sample theory.
Moreover, we assumed that observations (studied persons) were independent, that is, not clustered or nested within (higher order) Level-2 units, such as schools, clinicians, interviewers, physicians, neighborhoods, cities, and so on. One may conjecture that the robust ML estimation method may also have some robustness to limited violations of this classical independence assumption, especially when the degree of nonnormality is not pronounced. We are not aware, however, of sufficient research in this area that could help determine the extent and conditions under which one may trust such a potential recommendation. Alternatively, one may consider standard error and overall goodness-of-fit corrections in the presence of clustering effect, which would not affect the point estimates but will affect the interval estimates of reliability, alpha, and their discrepancy (e.g., L. K. Muthén & Muthén, 2017). Furthermore, the present article implicitly assumes relatively limited population heterogeneity which permits one to consider single-class (as opposed to mixture) modeling as used throughout the article. Similarly, the developments in this note assumed no cross-factor loadings for the first-order factor indicators, but its method is also readily applicable in the latter case after a minor modification to appropriately include cross-loadings in the second term of Equation (7).
We reiterate that the plausibility and identification of the model defined by Equations (1) and (2), which underlies this article, is essential when its procedure is used in applications (cf. Raykov et al., 2018). Where these conditions are not satisfied, the method cannot be generally recommended as it may yield misleading parameter estimates, standard errors, and statistical test results with respect to scale reliability, coefficient alpha, and their discrepancy. Lack of identification of the overall model may be expected with an insufficient number of indicators for one or more of the first-order factors (and/or a sufficiently small number of the latter), and may be resolved by adding appropriate parameter constraints that reflect substantively plausible parameter relationships in studied populations (e.g., Raykov & Marcoulides, 2006). Last but not least, as indicated on several occasions in the note, it rests on the assumption of uncorrelated error terms associated with the indicators of the first-order factors. Hence, the outlined procedure cannot be recommended when two or more such errors correlate, but can be readily extended to accommodate correlated errors by including their covariances in the denominator of the second term of the right-hand side of Equation (7) (see also Bollen, 1980).
In conclusion, this article offers to empirical educational, behavioral, and social scientists a readily applicable means for point and interval estimation of reliability of scales that possess second-order factorial structure as well as its difference from the popular coefficient alpha. The note also contributes to raising the awareness particularly among applied scientists of the fact that coefficient alpha can be seriously misleading if used for the purpose of reliability estimation for complex structure multiple-component measuring instruments, in particular with second-order factor structure.
Footnotes
Appendix
Acknowledgements
Thanks are due to B. Rammstedt for helpful support.
Authors’ Note
This research was in part conducted while T. Raykov was visiting the Leibniz Institute for the Social Sciences, Mannheim, Germany.
Declaration of Conflicting Interests
The author(s) declared no potential conflicts of interest with respect to the research, authorship, and/or publication of this article.
Funding
The author(s) received no financial support for the research, authorship, and/or publication of this article.