



Abstract
In large-scale low-stake assessment such as the Programme for International Student Assessment (PISA), students may skip items (missingness) which are within their ability to complete. The detection and taking care of these noneffortful responses, as a measure of test-taking motivation, is an important issue in modern psychometric models. Traditional approaches based on questionnaires and item response theory may have different limitations. In the present research, we proposed a new way by directly using “participant-own-defined” missing item information (user missingness) in a zero-inflated Poisson model. An empirical study using the PISA 2015 data (eight representative economies in two cultures) and another simulation study were conducted to validate our new approach. Results indicated that our model could successfully capture test-taking motivation. We also found that the Confucian students had lower user missingness irrespective of item positions as compared with their Western counterparts.
In large-scale national or international tests with low stakes to participating students such as the National Assessment of Education Progress (NAEP) and Organisation for Economic Cooperation and Development’s (OECD’s) Programme for International Student Assessment (PISA), students’ motivation in taking the tests is always a great concern to people organizing the project and researchers interpreting the results based on such tests. In a broader sense, test-taking motivation refers to students’ motivation to perform well on a given test (e.g., Arvey et al., 1990; Baumert & Demmrich, 2001). More specifically, it has been widely used as an indicator of test-takers’ attitudes toward the test, which substantially affects students’ test performance (ability estimation), and hence, the results and policy implications so obtained from these large-scale assessment projects.
Traditionally, direct (e.g., participants’ self-reported motivation) and indirect (e.g., analyses of participants’ nonresponse answer patterns) measures of test-taking motivation have been developed (Arvey et al., 1990; Holman & Glas, 2005). In the present study, we proposed a new strategy to analyze test-taking motivation by focusing on “user missingness” while jointly taking into consideration other influential factors that may lead to noneffortful responses. In this article, we first reviewed the substantial literature on test-taking motivation measures and the rationale that led to our new strategy. Then, we proposed the proper measurement and statistical methods used to analyze the missingness information. An empirical study with PISA 2015 data and a simulation study were used to exemplify and validate how user missingness with other influential factors could be deployed to measure test-taking motivation in a low-stakes, large-scale program.
Test-Taking Motivation and Its Measures
Test-taking motivation can be regarded as a specific form of achievement motivation, which refers to the motivation to perform well, in this specific case, on a given test (Arvey et al., 1990). It is different from general aptitudes toward tests (e.g., general text anxiety) in that with test-taking motivation, we focus specifically on the test that the participants had just taken or would be taking (Chan et al., 1997). It also shows the “willingness of working on test items and investing persistence in testing situations” (Baumert & Demmrich, 2001). Such a disposition was brought to researchers’ attention first in the field of organizational psychology (Arvey et al., 1990; Schmit & Ryan, 1992) and subsequently in various testing conditions, particularly low-stakes ones, such as in the NAEP, PISA, and IEA’s (International Association for the Evaluation of Educational Achievement’s) Trends in International Mathematics and Science Study (TIMSS). During the assessment, there is consistent evidence that across a variety of contexts, for elementary school to college students and job applicants, motivation is important in eliciting performance that accurately reflects the level of examinees’ competence (Baumert & Demmrich, 2001; Eklöf, 2007; Kiplinger & Linn, 1995; Nagy et al., 2018; O’Neil et al., 2005; Weirich et al., 2016).
Direct and indirect approaches have been popularly used in the traditional measures of test-taking motivation. Directly, we can use participants’ self-reported measures of test-taking dispositions (e.g., attitude to take the test, Arvey et al., 1990) or a recorded behavior during the test (e.g., time students spent on answering the items; Wise & Kong, 2005). Indirectly, we can also analyze the participants’ nonresponse or missingness information in the test using the item response theory (IRT) models so as to eliminate noneffortful responses and to achieve more precise ability estimation (e.g., Holman & Glas, 2005; Rose, 2013; Rose et al., 2017).
Self-Reported Approaches
Among participants’ self-report measures to assess test-taking motivation and attitudinal disposition, the Test Attitude Scale (TAS) developed by Arvey et al. (1990) has been quite popular. This instrument measures the attitude, opinion, and concentration on the employment test participants have just taken. Scale scores on motivation, lack of concentration, belief in tests, comparative anxiety, test ease, external attribution, general need achievement, future effects, and preparation are provided (Arvey et al., 1990). These nine factors have been developed to reflect test takers’ expressed effort and motivation on the test, the degree of concentration, perceived test ease, among others (Schmit & Ryan, 1997).
The psychometric properties of the TAS have been supported empirically (Chan et al., 1997; Schmit & Ryan, 1992). The first five domains of TAS were found to be reliable across different situations (Schmit & Ryan, 1992, 1997). Schmit and Ryan (1997) also showed that comparative anxiety, motivation, and literacy scales could predict future job withdrawal. A withdrawal model showing the relation between intention and job withdrawal was subsequently proposed. Other factors such as problems of scheduling, lack of preparation, evaluation of fairness, and minor group might also indirectly affect withdrawal (Schmit & Ryan, 1997).
Despite the promising properties, the use of TAS had been challenged. First, the theoretical basis of the TAS is weak because it is based on a factor analysis approach that depicts a global, unidimensional structure of test-taking motivation only (Chan & Schmitt, 1997; Chan et al., 1997; Schmit & Ryan, 1992). Second, TAS is administered after the assessment. It is possible that participants’ responses to the survey (TAS) on test-taking motivation can be affected by their perceived difficulty and performance in the test (Chan & Schmitt, 1997; Schmit & Ryan, 1992).
Researchers are eager to put test-taking behavior under a strong motivational theory framework, so as to relate test-taking behavior to a much wider range of psychological constructs. The Valence, Instrumentality, Expectancy Motivation Scale (VIEMS) was one of such attempts. It has been developed by Sanchez et al. (2000) basing on the expectancy-value theory (see, Wigfield & Eccles, 2000). Test-taking behavior is decomposed into three weakly related dimensions, with the dimension valence moderately related to the TAS. The VIEMS could be administered before taking a test, which increases its popularity. It has been validated and used in a wide variety of situations, with higher test-taking motivation empirically shown to be related to higher academic performance and other motivational concepts (e.g., self-concept and value; Eklöf, 2006, 2007; Hausknecht et al., 2004; Penk et al., 2014). Other test-taking motivation scales have also been developed by Penk et al. (2014), Sundre and Kitsantas (2004), Wolf and Smith (1995), and Sundre (1999).
Measures Based on Analyses of Effort and Item Responses
Wise and his colleagues (Wise & DeMars, 2005; Wise & Kong, 2005) challenged the self-report approach. First, the proportion of examinees who respond truthfully when filling out this kind of self-reported questionnaires is unclear. Examinees’ perceived performance on the test, irrespective of how accurate it may be, will distort their responses on how hard they have tried. The better they perceive they have done in the test, the greater the tendency they would believe that they have put in more effort. Second, self-report instruments assume that test-takers who report low effort have answered truthfully in the self-report instrument but contradictorily have not seriously tried their best on the test just minutes earlier. Perhaps, these test-takers have been serious in both the questionnaire and the test, or not serious in either. Their response being serious in one but not in the other, could be an intentional or unintentional misrepresentation of the truth. Third, a self-report measure of effort administered after a test precludes the possibility of potential changes in effort that may have occurred during the course of the test (e.g., work harder in the beginning, but less hard toward the end; Wise & DeMars, 2005; Wise & Kong, 2005).
Rather than measuring the test-taking motivation, an alternative paradigm is to measure the test-taking effort during the test instead. Examinees’ motivation, or now more specifically their effort refers to ‘‘a student’s engagement and expenditure of energy towards the goal of attaining the highest possible score on the test” (Wise & DeMars, 2005). It is assumed that individuals with high motivation would likely expend high effort on their test. So the focus shifts from unobserved disposition (motivation) to manifest behavior (a measure on effort spent). In line with the previous literature, withdrawal behavior has been used as one of the most direct measures of effort in taking a test (e.g., Arvey et al., 1990; Schmit & Ryan, 1997). Specifically, researchers compare an examinee’s item response pattern with a theoretical measurement model. The analyses of the behavior and answering patterns during the test will provide information on the examinee’s test-taking motivation.
Wise and Kong (2005) classified and focused on two answering patterns: solution behavior and rapid-guessing behavior. They assumed that a test-taker who seriously worked on an item would carefully check and answer the item. In contrast, if time ran out, they would rapidly guess on the item, resulting in little time and effort spent on the latter part of the test. Thus, Wise proposed the response time effort (RTE) as a new measure of test-taking motivation. The RTE was a person-fit technique derived from a psychometrical approach that identified examinees with aberrant response patterns. These uncommon behaviors included cheating, creative responses, careless responses, and lucky guesses. These patterns were also highly related with self-reported effort with RTE scores and self-reported effort showing very similar motivational effects (Wise & Kong, 2005).
Among the factors influencing the RTE, position effect which could be derived as the order effect (Hambleton et al., 1974), is often examined together with other item characteristics and demographic factors (Setzer et al., 2013; Weirich et al., 2014). In achievement testing, particularly, low-stakes and large-scale ones (e.g., PISA, TIMSS), administering the same set of items in different orders is a common strategy to enhance test security such as preventing copying.
The different-item-order manipulation generating alternate test forms, however, may create other complications. Individuals will likely have lower test-taking motivation at the end of the test. Studies have investigated the position effect across different kinds of tests (Albano, 2013; Debeer & Janssen, 2013; Zeller et al., 2017) and convincingly concluded that items that appear in later positions of a long test (a) would have higher difficulty, (b) would be guessed more rapidly by the examinees, (c) would have less effort from the examinees, and (d) would have lower mean performance as compared with that of the same item being placed in other earlier positions of the test (Debeer et al., 2014; Eklöf, 2007; Hartig & Buchholz, 2012; Meyers et al., 2008; Nagy et al., 2019; Weirich et al., 2016).
Complicating the issue is that there are other potential factors that may explain the position effects. For example, fatigue (performance drops due to tiredness in taking the test) and practice (familiarity with testing material/tasks improves test performance) might also exist. But generally these other potential effects were small (Hohensinn et al., 2008), and thus, it is legitimate to consider, the position effect in terms of test-taking motivation rather than as a consequence of fatigue of practice.
To examine the test-taking effort more closely, the effect has been divided into two components: initial effort and change in effort (Weirich et al., 2016). Both components might significantly affect the probability of solving an item with the current test-taking effort diminishing considerably as testing proceeded. It was also observed that participants taking low-stake tests would use more effort at the end of the test, but this positive effect on performance still could not counteract and balance the negative motivation–related position effect (Weirich et al., 2016).
Missingness and Test-Taking Motivation
Although the RTE response could help to detect the effortful responses, the filter-out technique is required to obtain precise estimation (Rios et al., 2017). With modern psychometrical methods such as IRT, item parameters could be more precisely estimated taking into consideration the effects due to test-taking motivation. Instead of using the RTE and the position effect approaches, indirect measures of test-taking motivation, such as multidimensional IRT (MIRT) models, have been used to impute missing responses (e.g., Holman & Glas, 2005; Rose, 2013; Rose et al., 2017) in order to achieve more precise estimates. In the MIRT approach, missingness is now analyzed using “not missing at random” (NMAR) designs (Rubin, 1976). The assumption is that missingness, particularly due to purposely omitted items, has been considered as a lack of test-taking effort (Liu et al., 2019; Rose, 2013). For example, persons who tend to omit items during the test session may reach the end of the test more quickly. In turn, persons who tend to answer most of the items proactively may need more time for cognitive processing and, therefore, will be more likely to fail in reaching the end of the test in time.
Omitting items and not-reaching items at the end of a test are hence quite different processes for different groups of people and consequently resulting in item nonresponses with different characteristics (Rose, 2013). If students answer the test carefully and make great effort into taking the test, they would spend more time on each item, and the missingness at the end of the test should better be considered as “not-reached” items. However, if students answer the test carelessly and rapidly guess items, their missingness perhaps should be considered as omitted items. We are arguing, therefore, it is crucial to differentiate missingness that should be considered as omitted or not-reached (Pohl et al., 2014; Rose et al., 2017).
Empirical evidence showed that in large-scale assessments, the number of not-reached items and the rate of omitted items were often negatively correlated (Culbertson, 2011; Pohl et al., 2014). In the PISA 2006, it was found that students’ proportion of correct scores based on observed item responses was negatively correlated with the rate of item nonresponses (r = −.33), indicating that easier items were more likely to be answered, whereas more difficult items were more likely to be skipped (Rose et al., 2010). Studies have shown that a joint model for omitted and not-reached items could be derived, taking into account different stochastic properties of missing responses due to omitted and not-reached items (e.g., Liu et al., 2019; Rose et al., 2017). With these new statistical modeling considerations, the bias in item parameter estimates can be reduced, and the reliability of person parameter estimates can be improved.
Detecting Test-Taking Motivation
Existing Problems and “Participant-Own-Defined” Approach
There are strengths and weaknesses associated with the aforementioned two main approaches to directly measure test-taking motivation (self-reported, analyses of effort and item response). Essentially, test-taking motivation describes students’ motivation, when taking a test, which includes the degree of concentration, seriousness, earnestness, or the students’ effort. A questionnaire could only be administered before or after the test, but with questionnaire items on behaviors during the test. The questionnaire, therefore, may not accurately reflect the true motivation during the test, let alone the social desirability in this self-reported approach.
The RTE approach based on analyses of response time appears to be more objective in comparison to the relatively more subjective questionnaire approach. The RTE, nevertheless may not be applicable to most testing situations unless it is on a computer-based platform with suitable programs capturing the necessary responding time information. Moreover, rapid-guessing behavior was observed in only a tiny percentage (1%) of item responses and this behavior had a small impact on ability estimation (Lee & Jia, 2014; Setzer et al., 2013). At the other end, it is possible that students with low test-taking motivation may spend substantial time on one particular item but still answer it poorly. This “fake” concentration cannot be detected by the RTE.
To solve the above problems, we developed and examined a third “participant-own-defined” approach that “defined” the degree of effort students expended on the tests (i.e., “user-missingness”) using information collected from the participant himself/herself. It was assumed that, if a student intentionally skipped one item or randomly selected one answer (e.g., out of the proper range)—the missingness information (participant-own-defined) was used as a direct measure of (lack of) test-taking motivation.
Such “participant-own-defined” approach had the benefit that the missingness value was measured alongside when the student was taking the test (task). Second, missingness as measured by the nonresponse (skipping an item) could be easily tracked and analyzed even in non-computer-based assessment. Third, in contrast to the RTE approach that failed to handle “fake” behavior properly (i.e., spent substantial amount of time on one particular item, failed to answer or solve it, and gave up), our “participant-own-defined” approach would handle it appropriately.
The Present Study
Definition
In the proposed approach, we used certain missing values as a measure of the intention to skip a task. It is important to have a clear knowledge of the reasons of missingness, which might include test design (students do not have to answer some questions by design), slow answering pace, or lack of concentration. These different types and reasons of missingness can be illustrated by the definition used with the PISA data below: • 5 − Valid skip; the question was not answered due to an earlier question indicating that the question be skipped; • 6 − Not reached; students did not answer the given item or subsequent items; • 7 − Not applicable; the response could not be determined due to a printing problem or torn booklet; • 8 − Invalid;” the response was outside the acceptable range; and • 9 − No response; the respondent had an opportunity to answer the question but did not respond. (OECD, 2017, p. 198)
Missingness (i.e., user missingness) as a measure test-taking motivation was operationally defined in the present study by Categories “8” and “9” above. These included omitted missingness (“9”; Pohl et al., 2014; Rose et al., 2017) and outliers with careless random responses (“8”).
Analytical Method
In high-stakes assessment, as the testing score has important implications for students’ future behavior, they are less likely to miss or skip items than in low-stakes assessment. Even in low-stakes assessment, however, missing values may still be infrequent among some participants. For these students without missing values, the “count of missing values” will be “0”. That is, any consequential analyses with this “count of missing values” will encounter the challenge of handling a lot of “0”.
In the present study, the missing values were divided into two parts: (a) the nonmissing part with no missing values for the participants and (b) the countable missing part indicating the items skipped during the test. To analyze these two parts of missing values, a new statistical method—the zero-inflated model, is needed.
Counted missingness is a count variable with a Poisson distribution. Since many of the participants have no missing data, the counting distribution contains a large number of “0” values. To handle this problem, a zero-inflated Poison distribution (ZIP; see, Lambert, 1992) is thus introduced, with the respective ZIP regression described as follows:

where the outcome yj takes any nonnegative integer value; xk is the covariate and λk is the expected Poisson count for the ith individual; π is the probability of extra zeros; and hi is the nonzero counts. Therefore, in the two parts of the ZIP regression, the first part describes the logistic regression of the binary latent inflation variable on covariates. The regression predicts the probability to assume any value other than zero. The second regression describes the Poisson regression of the count part of y on covariates. This regression predicts the value of the count outcome variable when the assumption of zero values and above is valid (Lambert, 1992; Muthén & Muthén, 2012). Taking the two parts together, the counts of zeros and nonzeros can be jointly analyzed with the total information fully utilized.
An Empirical Study With PISA Data
Objectives
The present empirical study used the ZIP model to analyze missing data as a measure of test-taking motivation. With an international large-scale data (PISA 2015), first we examined whether the ZIP model could be used to demonstrate the item position effect in this low-stakes assessment. We postulated that students would be more motivated to answer items at the beginning of the test (Hambleton et al., 1974). Second, we speculated that there would be differences in the test-taking motivation between Confucian and Western students (Li, 2002). Confucian students would more likely participate in learning activities persistently irrespective of their interest—an attitude often called “commitment” (see, Li, 2002). Empirical evidence also suggested that Confucian students might treat the test more seriously, persist in doing a task, and have fewer noneffortful responses (Chen et al., 1996; OECD, 2003; Yu, 2012).
We postulated that, even after controlling for the cultural difference in test scores, Confucian students would be more concentrated, with higher test-taking motivation in answering the test as compared with their Western counterparts. The above speculations were examined in PISA 2015, replicated in their reading, mathematics, and science achievement scores.
Participants
We selected eight countries/economies that participated in PISA 2015 with relatively good academic performance to represent the Confucian and Western cultures. Singapore, Chinese Taiwan, Hong Kong–China, and BSJG-China (Beijing-Shanghai, Jiangsu-Guangdong in China) were chosen to represent the Confucian culture. Since the Confucian regions had relatively high academic performance, we selected the large and relatively better performing Western countries as well, namely, Canada, Australia, the United Kingdom, and the United States. Our analyses involved the academic performance of 83,480 students. The sample sizes for the analyses of missingness in science, mathematics, and reading domains were 83,388, 34,252, and 34,195, respectively (see Table 1).
Descriptive Statistics of PISA 2015 Samples.
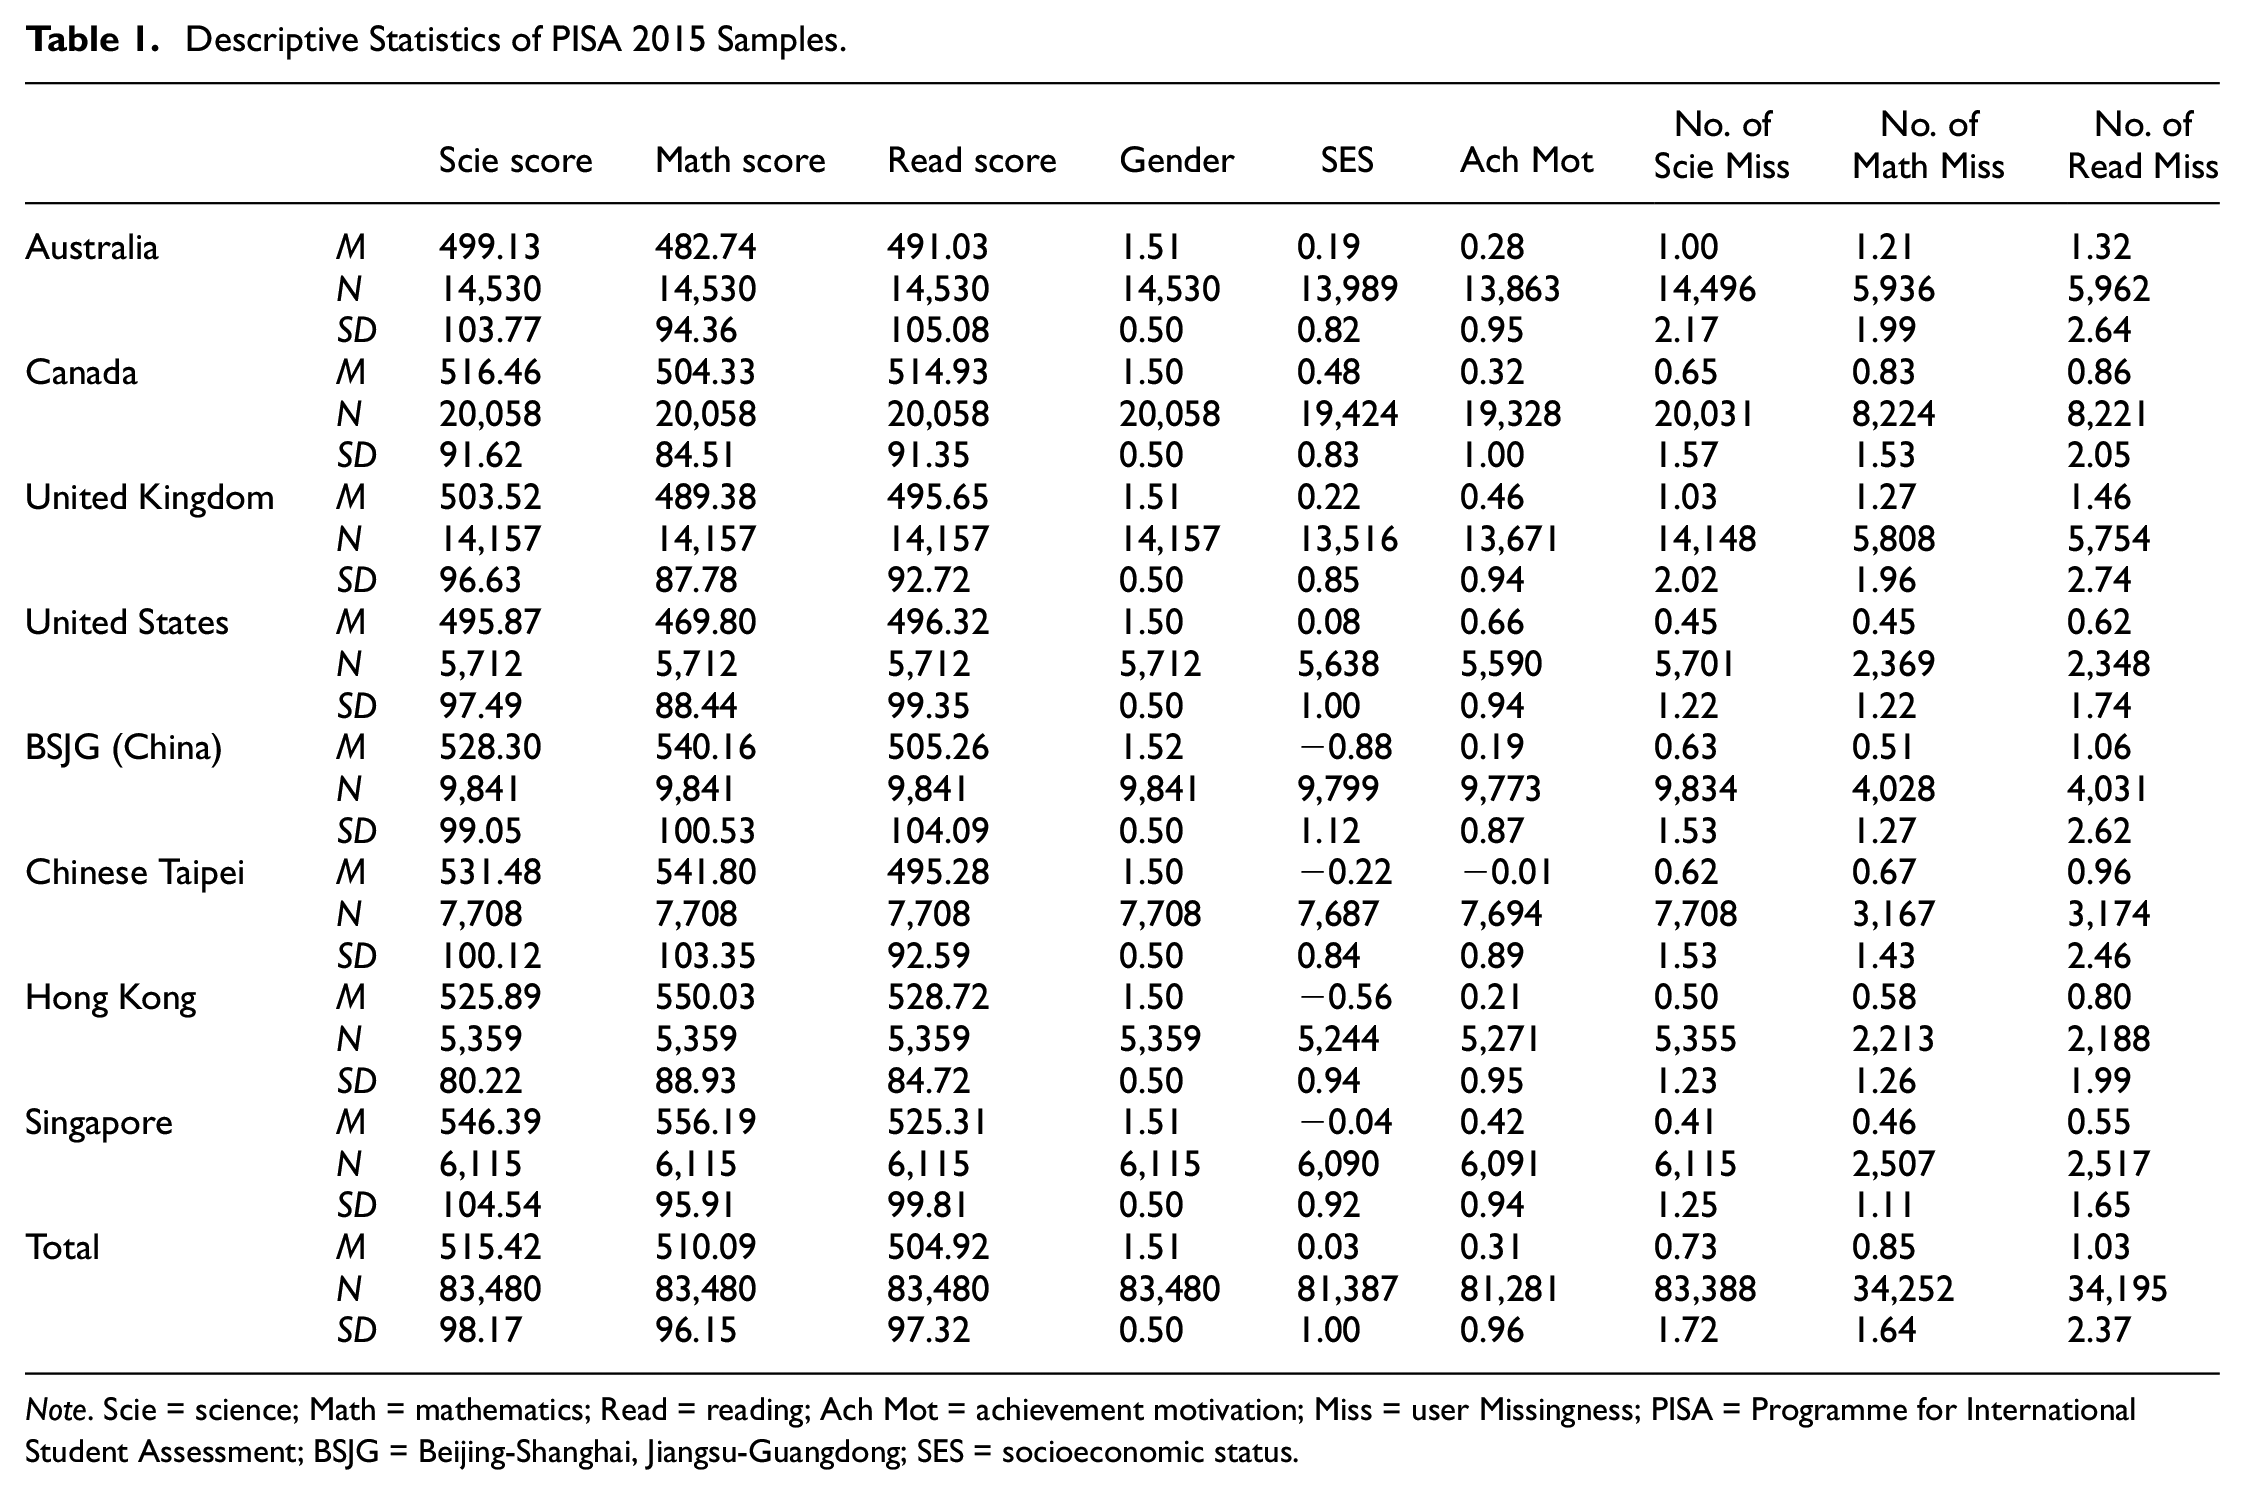
Note. Scie = science; Math = mathematics; Read = reading; Ach Mot = achievement motivation; Miss = user Missingness; PISA = Programme for International Student Assessment; BSJG = Beijing-Shanghai, Jiangsu-Guangdong; SES = socioeconomic status.
Measures
Academic Performance
Academic performance was indicated by the domain-specific literacy. For example, the main domain in PISA 2015 was science literacy, which measured “[the] knowledge of both science and science-based technology, even though science and technology do differ in their purposes, processes and products” (OECD, 2016). A two-parameter logistic model with latent regressions (indicated as “plausible values”) was used to generalize academic scores. The standardized academic performance had a mean of 500 and a standard deviation of 100 on the OECD scale (see Table 1). Other more detailed information is available in the respective technique report. In the present study, students’ domain scores in science, mathematics, and reading literacy were used.
Count of User Missingness
First, there were blank cells in the cognitive assessment associated with clusters of items not assigned to the students. These were missing by design and were not included in our subsequent counts. Second, among the five types of missing values (see definition above), for the purpose of this study, the values “8” and “9” were taken as user missingness. They represented missing values not associated with test design or item/cluster design. The science domain was administered to most students, so we used the whole sample in measuring science user missingness. For the reading and mathematics domains, only the students who were administered the respective domain were counted. That is, if the students had science and mathematics test scores only, their reading scores would not be considered missing. Therefore, there was a much larger sample size in science (the main domain in the 2015 cycle) than in the other two domains (see Table 1 for details).
Cluster Position of Cognitive Assessment
The PISA cognitive assessment took 120 minutes to complete and consisted of four clusters (each 30 minutes). After the first two clusters (i.e., 60 minutes of one domain), there was a short break of no more than 5 minutes. Then, students began the last two clusters (i.e., 60 minutes of another domain). For each of the half sessions (two clusters), one specific domain was assigned (OECD, 2016). For example, students assigned Booklet 31 would answer two clusters of science tests (60 minutes) followed by two clusters of reading tests (another 60 minutes, see Table 2). The position variable was coded according to the cluster design. For example, students answering a science test during the first half-session would have their position coded as “0”, while those answering a science test during the second half-session would have their position coded as “1”. Each student was only assigned to one position in a certain particular domain. The designs for the mathematics and reading tests were similar to those for the science tests. Detailed cluster design information can be found in the PISA technique report (OECD, 2017).
An Example of Booklet and Cluster Information in PISA 2015 (From Booklet 31 to Booklet 42).

Note. PISA = Programme for International Student Assessment. R01-R06 represent reading clusters in computer. “a” represents standard clusters and “b” represents easier clusters. S represents science clusters in computer (totally 12 clusters). In each session, one booklet contains two science clusters, which are randomly selected (see OECD, 2017, pp. 40-42).
Culture
As mentioned above, we selected two cultures—Western (coded as “0”) and Confucian (coded as “1”). The selection of the culture was based on Huntington’s (1996) clash of civilization model.
Achievement Motivation
We used the achievement motivation as a criterion. In the PISA 2015 questionnaire, achievement motivation reflected the degree to which a student wanted to perform well in general school work. It consisted of five items in 4-point Likert-type scale (e.g., “I want top grades in most or all of my courses,”“I want to be the best, whatever I do”). The scale score of achievement motivation was a standardized score with a mean of 0 and a standard deviation of 1. A higher score indicated higher achievement motivation.
Controlling Covariates
Since the missingness may be correlated with other potentially related factors, we controlled them in our analytical model. In particular, when building the ZIP model, we controlled for students’ academic performance (i.e., the PISA final score). At the same time, as in many studies focusing on academic performance, the usual covariates, that is, socioeconomic status (SES), gender, and school difference were also controlled (e.g., Liu et al., 2020; Marsh et al., 2006).
Analyses
Academic Performance
Academic performance was normally distributed. As it had a substantial between-school and between-country difference (see the intraclass correlation (ICC) value; Table 1), we used a three-level multilevel-regression model in the analyses. The null model included the individual variance, school variance, and country variance. Our analytical model could be depicted in terms of the standardized scale in the following equation:

where
Missingness
The missing value variable had little between-school or between-country difference, so a single-level analytical model was used (see Table 1). The ZIP model was used to tackle the problem of the large amount of zero counts (Equation 1). Particularly, to control for the effect of the ability of the students (where the missingness may be caused by low ability), individual students’ performance score was included as a control variable.
Software
We used Mplus 7.11 (Muthén & Muthén, 2012) for the three-level and ZIP regressions. An example program listing the syntax is shown in the appendix.
Results
General Criterion Validity
The correlation matrix (Figure 1) showed that missingness was negatively related to academic performance. Students with better performance had less missing values and this relationship was stronger among the Western students. The missingness was also slightly negatively related to the achievement motivation, which indicated that students with stronger motivation to achieve in school work would have less missingness. Academic performance was also found to be positively related to achievement motivation, which was in congruence with our expectation. All these findings suggested the appropriateness of using (a) missingness as an indicator of test-taking motivation and (b) the respective analytical model in missing value analyses. These results also provided validity support of the use of individuals’ ability as a control variable in the analyses.

Scatterplot among academic performance, missingness, and achievement motivation in PISA 2015.
Effect of Test-Taking Motivation on Academic Performance
Table 3 shows the three-level model for the three cognitive domains. The most important finding was the salient interaction effect between culture and position after controlling for the effects due to students’ gender, SES, achievement motivation, school, and country difference. Culture produced effect sizes (standard deviation changes) ranging from 0.048 to 0.082 on the effects of position. As shown in Figure 2, Confucian students maintained similar performance from the first half-session to the second in that their estimated performance level. In contrast, Western students had better performance in the first half-session than in the second half-session.
Effects of Relevant Factors on Academic Performance in PISA 2015 (Three-Level Analyses).
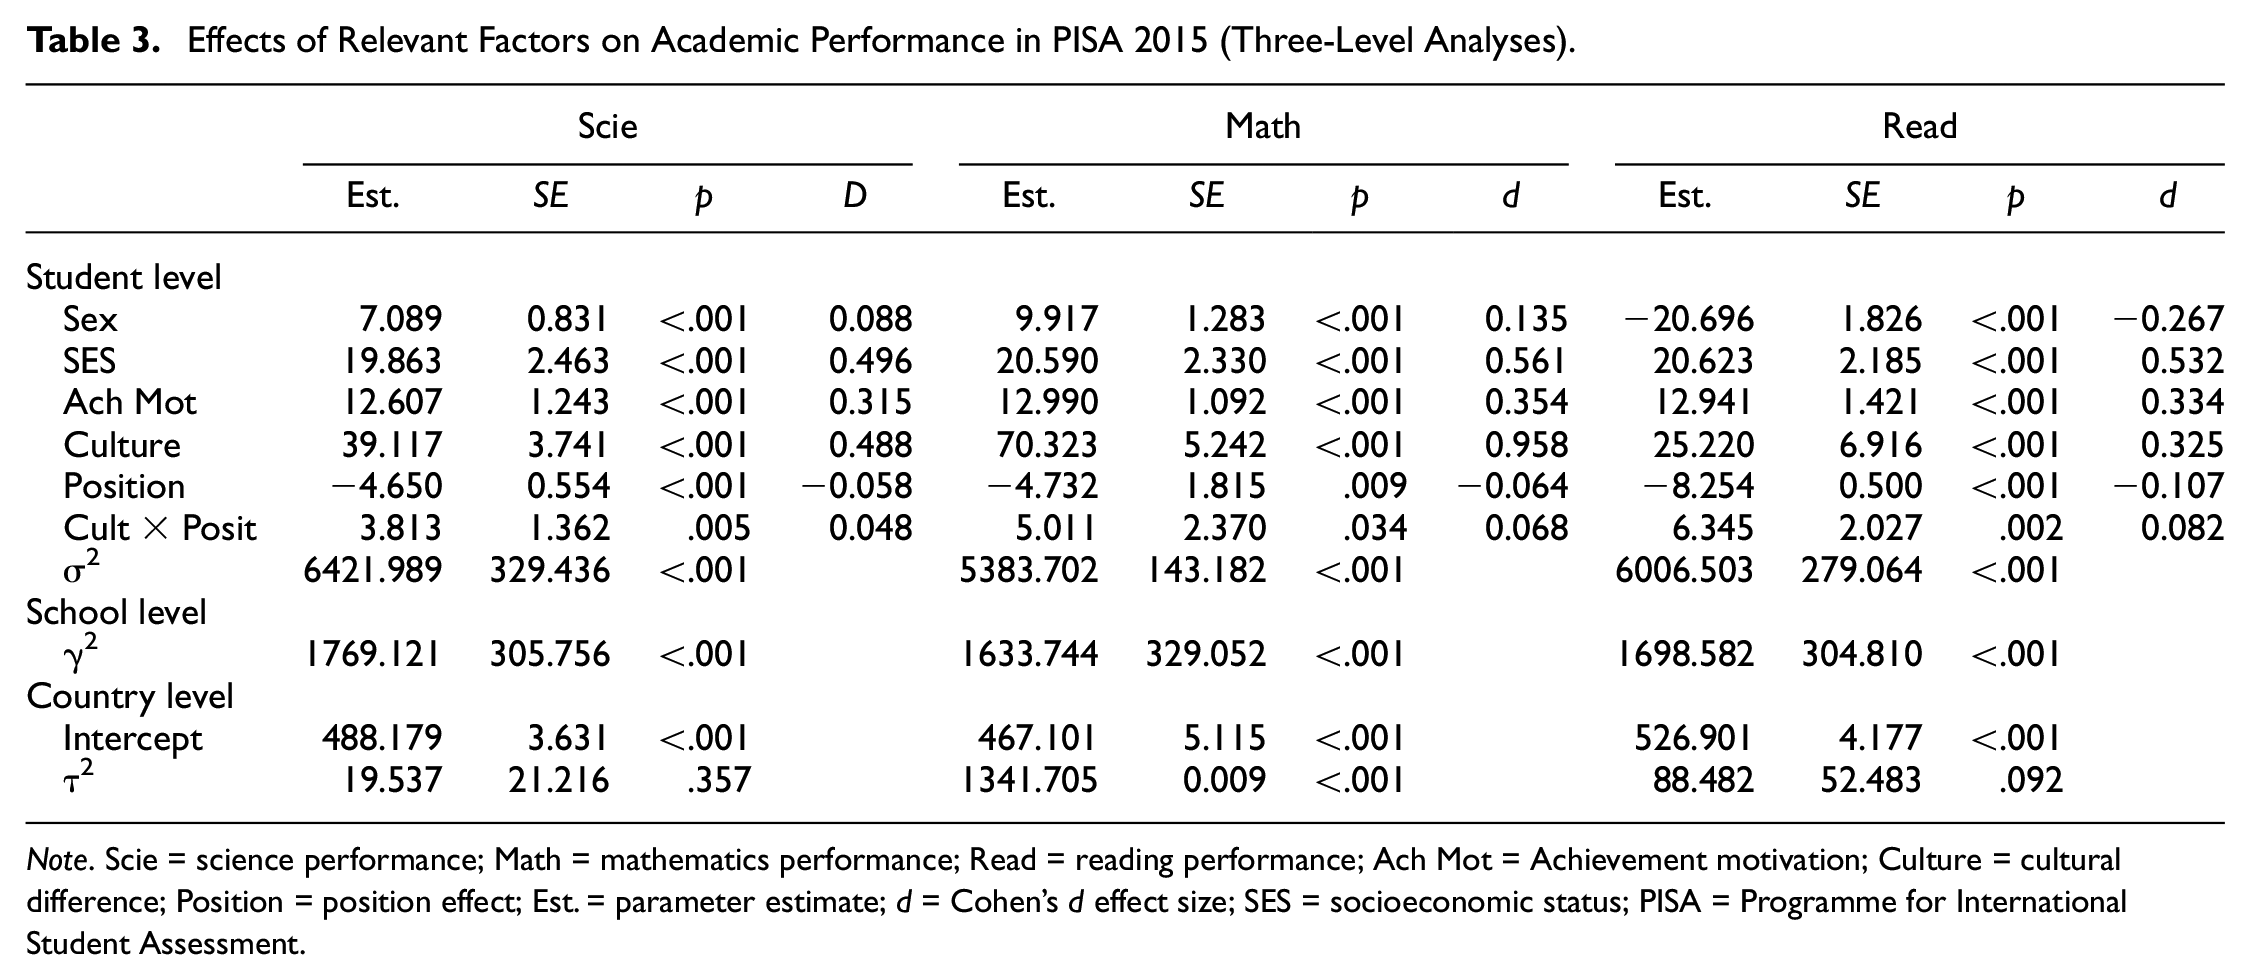
Note. Scie = science performance; Math = mathematics performance; Read = reading performance; Ach Mot = Achievement motivation; Culture = cultural difference; Position = position effect; Est. = parameter estimate; d = Cohen’s d effect size; SES = socioeconomic status; PISA = Programme for International Student Assessment.
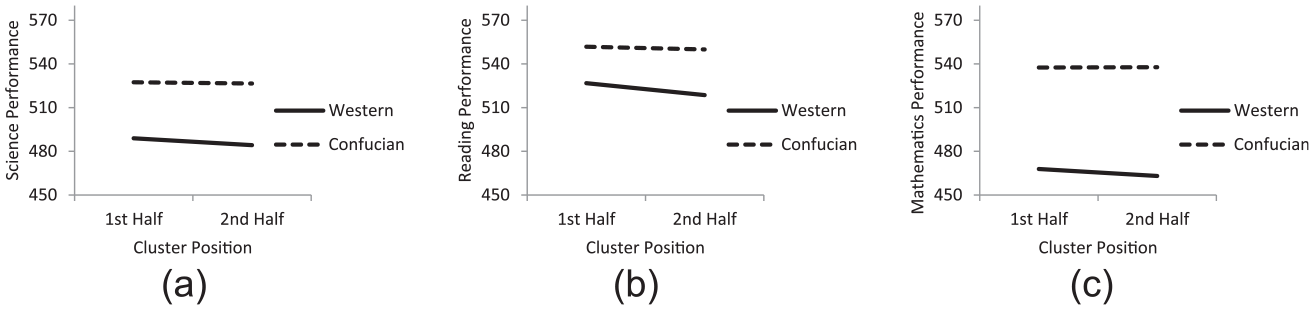
Academic performance difference by position and culture in PISA 2015.
Apart from the above interactional effects, position effects were still salient across different domains, mainly associated with the Western sample. The effect due to culture was large, with effect size (standard deviation changes) ranging from 0.325 to 0.958, indicating a strong cultural difference in terms of academic performance. This showed that the Confucian students had better performance than the Western students.
Additionally, we reaffirmed the effects of the covariates. Girls performed better than boys in the domain of reading but worse in the domain of science and mathematics. Students from high-SES families and those with stronger achievement motivation had better performance. The school difference was salient, whereas the country difference was dramatically decreased after incorporating culture as a strong predictor.
Effect of Test-Taking Motivation on User Missingness
Table 4 shows the ZIP analysis involving individual “user missingness.” The two parts of the ZIP regression indicated students with and without countable missing values. Results showed that after controlling for the ability/performance and other appropriate covariates, more highly motivated students missed less. Specifically, students who had higher achievement motivation would be more likely to have non-missingness (odds from 1.060 to 1.164, where an odds ratio larger than 1 indicates higher probability) and less likely to have missingness (odds from 0.931 to 0.969).
Effects of Relevant Factors on User Missingness in PISA 2015 (Zero-Inflated Poisson Analyses).

Note. Scie = science performance; Math = mathematics performance; Read = reading performance; Ach Mot = achievement motivation; Culture = cultural difference; Position = position effect; Est. = parameter estimate; Odds = odd ratio; SES = socioeconomic status; PISA = Programme for International Student Assessment.
The moderation effects by culture were salient especially for the science domain, where the odds ratio was 0.766 for the missingness and 1.140 for the non-missingness. This indicated that Confucian students were more likely to have nonmissing in the second half-session than Western students. Moreover, for Confucian students, missing values were less likely to occur in the second half-session as compared with Western students. The former finding was replicated in the reading domain, while no significant differences were seen in the mathematics domain. In addition, position effects showed students had more nonmissing in the first-half and more missing in the latter-half. Specifically, the position effects for the nonmissing part (odds from 0.760 to 0.858) as well as the missing part in science domain (odds = 1.245) were substantial. Figure 3 shows the effects of counted user missingness in relation to the position and the culture.

Counted user missing by position and culture in PISA 2015.
A Simulation Study to Validate the Participant-Own-Defined Missingness
A simulation study was designed to validate the “participant-own-defined” missingness approach. The data are generated using the two-part (semicontinuous) growth model (Olsen & Schafer, 2001; Muthén & Muthén, 2012; Figure 4).
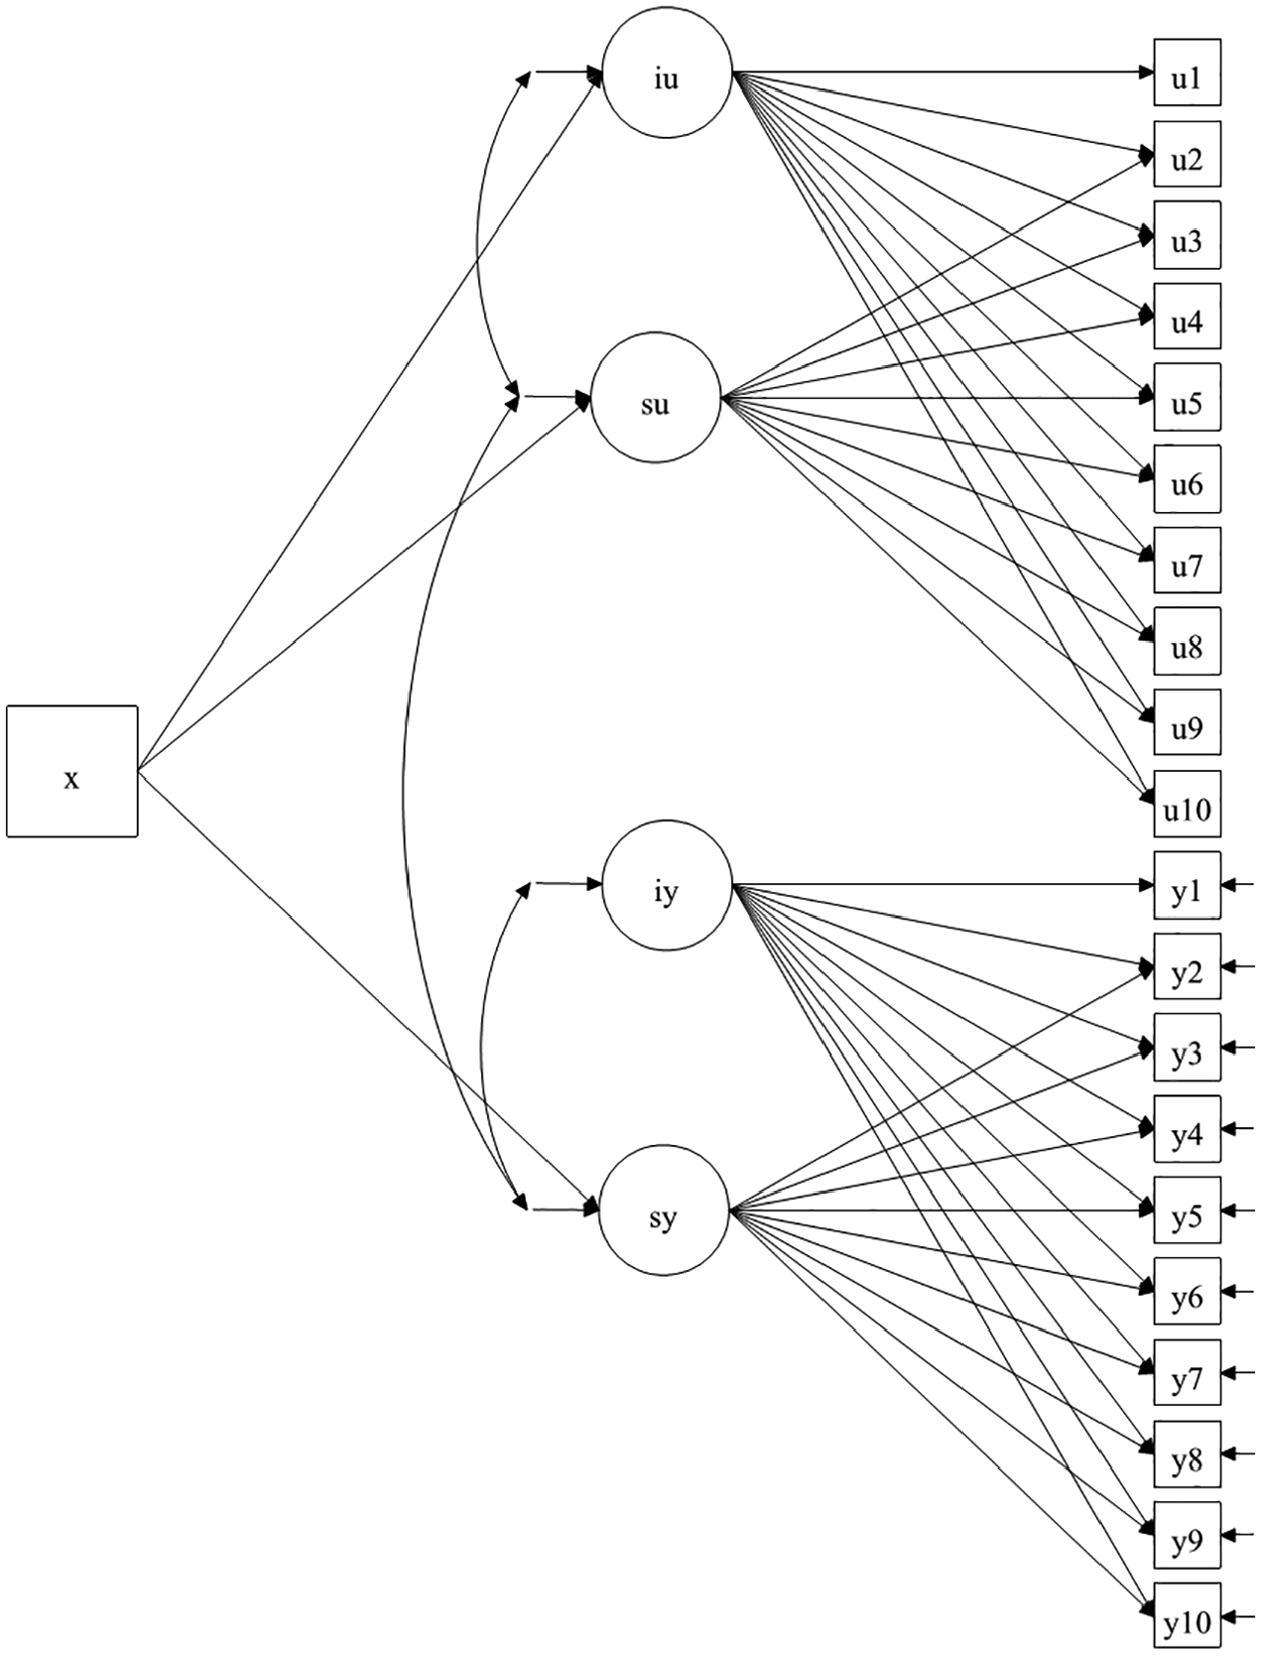
Simulation study: Data generation model (two-part growth model).
Data Generation: Two-Part Growth Model
The first part in our two-part growth model represented the ability growth. This part was defined by a 10-item test (y1 to y10, each representing the ability estimated at that particular time point) with corresponding intercept (iy) and slope (sy). The intercept was the level of individual’s (initial) ability while the slope was the change of the ability shown as the position effect. As suggested by the position effects in large-scale assessment (e.g., Setzer et al., 2013; Weirich et al., 2016), the slope (sy) of the growth part should be slightly negative (i.e., performance slightly decreased). In this first part, missing values were influenced by the second part in this two-part growth model as defined below.
In the second part, 10 binary variables (u1 to u10) were generated to represent the missing values in the growth part. User missingness was modeled in the present research with the missing value as 0 and the nonmissing ones as 1. This missing part had an intercept (iu) and a slope (su). The intercept was the initial level of missingness while the slope was the position effect of missingness (a large negative slope indicates a great increase of missingness in the latter part of testing). In addition, the test-taking motivation was generated as a covariate (x), which theoretically (as in the empirical hypotheses) influenced the missingness (iu), the position effect of missingness (su), and the position effect of ability (sy).
In terms of the simulation conditions, our main interests were on (a) the level of initial missingness (mean of iu), (b) the level of position effect (mean of su), and (c) the influence of test-taking motivation on initial missingness (“iu on x” in Mplus coding) and on its position (“su on x”). The other parameters were fixed at values as suggested by Muthén and Muthén (2012). We set the corresponding intercept and slope (“iy with sy”“iu with su”) with a low negative correlation at a starting value of −0.1. The correlation between the two intercepts (“iy with iu”) was set to be zero, while that between the two position effects was set at a medium positive correlation (“su with sy,” 0.3 for the starting value). The intercepts of the continuous (y1 to y10) and binary (u1 to u10) indicators, as well as their corresponding effects were set to be fixed at suggested values in similar two-part models (Muthén & Muthén, 2012).
We had 500 simulated participants for each of the 500 replications in each of the conditions.
Simulation Conditions
There were four conditions manipulated in the present study, each with two levels, thus, producing 16 conditions for the simulation study.
Initial Level of Missingness
Since the ZIP model was sensitive to the degree of missingness, two levels of missingness were considered. The means of iu of the high and low levels of missingness were set at starting values of 3 and 0, respectively. With these values, 315 to 460 nonmissing cases (among 500 individuals, 49.7% zero count) were generated for the high missingness level (across various conditions), while 137 to 363 (79.1% zero count) nonmissing cases were generated for the low missingness level.
Position Effect of Missingness
Since the position effect reflected whether missingness increased at the latter position in the testing, it was speculated that the number of missing value should increase as testing continued. Thus, growth for the missingness (us) should be negative, with greater negative value indicating more missingness in the latter positions. We generated two levels of position effect with starting values of −0.3 and −0.1 for the large and small effects, respectively.
Effect of Test-Taking Motivation on Missingness
The small and large effects of test-taking motivation on missingness were set at starting values of 0.3 and 0.8, respectively. The settings reflected the reasonable speculation that higher test-taking motivation was associated with a larger number of non-missingness.
Effect of Test-Taking Motivation on Position
In our design, test-taking motivation affected the position effect at low and high starting value levels of 0.1 and 0.3, respectively. Since the position effect was generally negative, a higher test-taking motivation should be associated with a larger slope which was closer to zero (i.e., smaller position effect).
Models in Evaluation
Two fitting models were used in the analyses of the simulated data. The first model was the two-part model used to generate the simulated data. As the data simulated and data fitting models were identical, the results with this model could be used as the benchmark for the second model.
The second fitting model was the ZIP model to see how well it could reproduce the population model (simulated data generation model). The two models were used to fit the same simulated data under various conditions as described above. In particular, the ZIP model estimated the effects of missingness on test-taking motivation by separating the Poisson part (count missingness) from the logistic part (non-missingness). We also separated the 10-item condition into two 5-item halves in order to estimate the position effects (the first five items as the first-half and the last five items as the second-half), as we had done in our empirical example.
Evaluation Indices
In evaluating the model fit, Akaike information criterion (AIC), Bayesian information criterion (BIC), and the sample-size adjusted Bayesian information criterion (ABIC) were used. The χ2 was available for the two-part model, and thus, was also included. In these indices, a lower value indicated a better model fit.
For parameter precision, bias was evaluated whenever the true values of the model were known (for the two-part model). A smaller absolute bias indicated a higher parameter precision. Besides, the 95% cover rate was obtained with a higher value indicating a better parameter estimation. For the conditions where the true values were unknown (ZIP model), we compared the estimated effects in evaluating the performance (validity and usefulness) of the ZIP model. As some known paths (i.e., effects) had nonzero population values, the percentages of significant path estimates could be used as an index of success in recovering these known paths, with higher values (close to 100%) indicating greater success.
Results
Results on model fits are shown in Table 5. The two-part model basically could recover the data generation model. The fit was similarly good across different conditions. In contrast, the fit of the ZIP model varied across conditions suggesting that ZIP could recover the population model in some but not all the conditions. The ZIP model fitted worse when the effects of test-taking motivation were low (vs. the high condition).
Fit of Models in the Simulation Study.

Note. Miss = user missingness; PE = position effect; Eff = effect; AIC = Akaike information criterion; BIC = Bayesian information criterion; ABIC = adjusted Bayesian information criterion; ZIP = zero-inflated Poison distribution.
Though the initial-level missingness did not seem to affect the fit of the ZIP model, the fit in conditions with larger position effects was generally better. The patterns of the changes on χ2 with various effects were similar or parallel between the two-part and ZIP models. Thus, for example, χ2 was smaller when the effect of test-taking motivation was higher or when missingness was larger.
Results on parameter estimation are shown in Table 6. On bias, generally parameter estimates were positively biased except for the condition of high test-taking effect, high missingness, and large position effect. In assessing the influence of test-taking motivation on initial missingness level, it tended to be overestimated when the influence on position effect was large. The 95% coverage showed that the two-part model generally had very good estimation precision reproducing the population model specification.
Precision of Parameter Estimates in the Simulation Study.

Note. Miss = user missingness; PE = position effect; Eff = effect.
The parameter estimates of the ZIP model are also shown in Table 6. Results reconfirmed that the higher test-taking motivation was associated with the lower total count of the missingness, which was shown as a negative prediction of the test-taking motivation covariate in the Poisson count part. It also showed that the higher test-taking motivation was associated with a lower level of missingness (more likely to be “zero”), which was shown as a positive effect on the logistic zero part.
When the test was separated into two halves, the first half had lower missingness, while the second half had higher. This effect was nevertheless not stable for the zero part and there were also some nonconvergent cases.
The percentages of significant estimates are also shown in Table 6. For conditions with a low level of missingness, the count part and the zero part showed high percentage recovery of the population model (i.e., high % of significant estimates). However, for conditions with a high level of missingness, the count part performed badly (i.e., could not recover the population model).
Discussion
Model Evaluation
In the present study, we measured test-taking motivation by using participant-own-defined missingness information. In contrast to the traditional methods with self-reported questionnaires or analyses of responding time, our proposed participant-own defined missingness approach has several advantages. Specifically, user missingness can be coded and defined using the participant-own response information right at the test. This method can easily be used with paper-based or other traditional testing methods. We also differentiate our analytical approach from the MIRT method which estimates individual ability or performance by including the missingness into the psychometric model in the adjusted ability estimations. Thus, in the MIRT approach, missingness is influenced by the latent “effortful factor,” which is contrary to our extraction of the “noneffortful factor” in the ability estimation.
The effectiveness and validity of our proposed missingness approach is supported by both the “Empirical Study With PISA Data” and the “Simulation Study.” The empirical study with PISA data showed that after controlling for students’ ability and background information, missingness was predicted by the achievement motivation as well as the position effect. That is, achievement motivation could be successfully used as a criterion of test-taking motivation in predicting missingness.
The subsequent simulation study supported the findings of our earlier empirical research with the PISA data. Specifically, test-taking motivation could effectively predict user-missingness with considerable accuracy in recovering significant paths (% of significance). Although no true (population) values of test-taking motivation on missing counts were available, at least we showed that the estimated effects using our proposed model could recover the parameters set in the two-part growth modeling rather well, especially for the position effect.
In analyzing user missingness, several issues should be noted. First, “real missing” takes up a very small proportion of the sample. Possibly, in large-scale low-stake tests such as PISA and TIMSS, real missing values usually occur but they are not that many. For example, in our analysis in the PISA 2015 science domain, among the 83,388 individuals with missing data from the selected countries and organizations, there were 58,707 individuals with “zero missing.” This means that over 70% of the participants had no missing values. If the zero counts of missingness had been excluded in the analyses, a lot of useful information would have been lost. This pattern was similar in the other domains but less severely, with 26.4% and 28.8% zero counts of missingness in mathematics and reading, respectively. In the extreme cases when there is no or very few missing participants, our proposed strategy may not work because there are all or many cases with “0” count of missing. This is indeed a limitation of our proposed participant-own-defined missingness approach, when the use of the ZIP model including the direct analyses of “zero missingness” may function much better.
Second, “zero missing” is indeed a reflection of high test-taking motivation: Individuals with no user missingness must have persisted and consciously have answered all the items with no dropping-out behavior. We should carefully treat the zeros and try to collect more information. Thus, we choose the zero-inflated model to maximize useful information.
Third, finding a good way to differentiate the inner meaning of missingness is also difficult. For example, the missingness may reflect individual’s ability (higher ability, fewer missing values), so a model controlling for relevant confounding factors is also desirable.
Factors Affecting Test-Taking Motivation
Of factors affecting test-taking motivation, we show that culture substantially moderates the position effect, which is a unique contribution of our study. The results indicate that Confucian students are more likely to persist to the end of the test, shown as an equal possibility of having missing values, while at the same time showing a minor decrease of estimated ability in terms of different positions. This supports our hypotheses that the Confucian students might be more conscious of taking a test (e.g., Li, 2002; OECD, 2003). However, the moderated effects are not consistent across domains and predictors. In the domain of science, culture moderates the position effect—for Confucian students, they persist to the end of the test, while Western students are less persistent. In the domain of mathematics and reading, this moderation effect is statistically significant in terms of ability but not in terms of user missingness. This is probably due to the test design of the PISA program. One possible reason is that science is the primary domain with more items than reading and mathematics. Students who engage in more items and spend longer time taking the test are more likely to show low test-taking motivation (Weirich et al., 2016). Another reason probably lies in the number of valid participants. Since all students participated in the science questionnaire, while only approximately half of them answered either reading or mathematics, the difference in the significance level across domains could be just an artifact of the differences in their respective sample sizes only.
In addition to the culture effect, we also find a position effect, where students are less motivated to answer the questions at the end of the test. This is shown as an increasing trend of missingness, and at the same time, a slight decrease of ability estimates. Particularly, PISA ability estimation uses an IRT approach irrespective of the NMAR missing pattern. This means that the ability estimates do not consider test-taking motivation. Our finding is in accordance with previous evidence (e.g., Nagy et al., 2019; Rios et al., 2017; Rose et al., 2017; Weirich et al., 2016). The position effect appears across the three domains, where reading showed the strongest effect. Moreover, we found that girls are more likely to persist in the domain of reading, similar to previous findings (DeMars et al., 2013). Another problem relates to SES; results indicate that students with higher SES levels are more likely to have fewer missing values. These findings indicate that students are generally not willing to answer low-stakes tests.
Limitations and Future Directions
There are still limitations that future research could explore. First and the most important, the validity of user missingness on test-taking motivation needs further exploration. A more suitable criterion based on the empirical database is needed since the achievement motivation in the present study is focused on the general achievement of school work while the test-taking motivation is focused on the effort to do a specific test. Although they share the same variance of achieving high performance, they might have different strength of effects on missingness, and hence, test performance. Further effort to differentiate these different types of motivation is still much needed. Our simulation study validates the effectiveness of user missingness, nevertheless, what really contributes to the user missingness should be carefully differentiated and modeled. Future studies may choose a more suitable criterion that directly measures test-taking motivation. Results thus obtained can be validated with the traditional approaches using questionnaires or IRT models.
Second, in our empirical example, the PISA’s guidebook provides the different types of booklets. It does not, however, provide the items belonging to a certain booklet. Therefore, a lack of detailed information on the booklets weakens the information on the position effect. Moreover, if the booklet information were available, the item position coding would have increased to four categories, which would be more close to our simulation design. The initial missingness (indicating the general test-taking aptitude) and a change of missingness (indicating the test-taking effort during the test) under the growth modeling would have been simultaneously estimated (Weirich et al., 2016). Despite we might be able to obtain more information; however, there is still a serious problem of analyzing ZIP data using general growth modeling. Technical problems would arise, and more complicated statistical modeling might be introduced.
Another issue is the observed cultural differences in empirical studies. In the three-level analysis, we show that country differences exist, as indicated by the high ICC at the country level. When culture is added as a predictor, however, the country-level ICC is substantially reduced to only .042 in science, .028 in reading, and .141 in mathematics, whereas the school difference still exists between .182 and .192. This suggests that country differences are originated from cultural factors. This affirms a traditional viewpoint that culture differences may explain more than country differences (e.g., Huntington, 1996). In future research, therefore, a better way to look into country differences may involve moving to a cultural level, which would yield much more coherent and concordant patterns across countries while interpreting the country differences in terms of their respective cultures.
Last, our simulation design can be further extended and utilized to answer other related research questions. In order to simplify the model estimation, we set most of the parameters related to ability growth to be fixed so as to focus on the missing part. Nevertheless the model definition should not only be limited to the missing part; ability growth part could be considered at the same time. Moreover, the present study uses a growth model to generate the data but uses a ZIP regression model to estimate the focused parameters. The discrepancy between the two models may lead to biased interpretation. The evaluation of the efficiency of the ZIP model as well as the comparison between the ZIP model and the traditional models are by themselves interesting topics to be further explored.
Footnotes
Appendix
Authors’ Note
Yuan Liu is also affiliated to Beijing Key Lab of Applied Experimental Psychology, School of Psychology, Beijing Normal University, Beijing, China and Key Laboratory of Cognition and Personality, Ministry of Education, Chongqing, China. The empirical data are available online from the PISA official website: 
Declaration of Conflicting Interests
The authors declared no potential conflicts of interest with respect to the research, authorship, and/or publication of this article.
Funding
The authors disclosed receipt of the following financial support for the research, authorship, and/or publication of this article: This study was supported by the National Natural Science Foundation of China (No. 31800950) and the Opening Foundation of Beijing Key Lab of Applied Experimental Psychology.