



Abstract
Considerable thought is often put into designing randomized control trials (RCTs). From power analyses and complex sampling designs implemented preintervention to nuanced quasi-experimental models used to estimate treatment effects postintervention, RCT design can be quite complicated. Yet when psychological constructs measured using survey scales are the outcome of interest, measurement is often an afterthought, even in RCTs. The purpose of this study is to examine how choices about scoring and calibration of survey item responses affect recovery of true treatment effects. Specifically, simulation and empirical studies are used to compare the performance of sum scores, which are frequently used in RCTs in psychology and education, to that of approaches rooted in item response theory (IRT) that better account for the longitudinal, multigroup nature of the data. The results from this study indicate that selecting an IRT model that matches the nature of the data can significantly reduce bias in treatment effect estimates and reduce standard errors.
Keywords
Randomized control trials (RCTs) are often used in psychology and education to make causal claims about the effects of interventions on children’s psychological and social–emotional well-being. Such RCTs frequently involve pre- and posttreatment surveys for participants in both control and treatment groups. For example, researchers might administer a growth mindset survey, conduct an intervention designed to boost growth mindset, then re-administer the survey (Donohoe et al., 2012; Yeager & Dweck, 2012). The gain of the treatment group relative to the control group (a straightforward “difference in difference” model) could then be used to estimate a treatment effect.
While item response theory (IRT) models are often used to score achievement tests, simple mean or sum scores are typically used to score surveys in disciplines like psychology and education, including in RCTs (Bauer & Curran, 2016; Flake et al., 2017; McNeish & Wolf, 2020). This choice is made despite evidence that sum scores make large, oftentimes untenable assumptions (McNeish & Wolf, 2020), including that all students have received and answered the same item set, all items are equally difficult, and items show measurement invariance. One might also fail to detect true differences in control and treatment groups with a sum score model, which assumes participants are exchangeable. This assumption could be particularly fraught due to factors that often affect RCTs like attrition of study participants. These issues are likely compounded with longitudinal data, such as pre-/postinterventions. For instance, sum scores do not account for the covariances of the latent construct over time (Bauer & Curran, 2016; Gorter et al., 2015; Kuhfeld & Soland, 2020).
Further, measurement invariance failures can be problematic in several ways for RCTs, and sum scores do not even allow one to test for such failures. Specifically, measurement noninvariance could occur between control and treatment groups, before and after intervention, or both. There is already growing evidence that such measurement invariance failures occur in the context of RCTs because participation in an intervention can actually change how respondents understand the construct before and after treatment (Fokkema et al., 2013; Oort, 2005; Oort et al., 2005; Soland, in press). Such “response shifts” are well documented in medicine and psychology. For instance, Oort et al. (2005) found that, among patients suffering from chronic and potentially life-threatening conditions, interventions actually shifted how the patients defined quality of life, resulting in measurement noninvariance between groups, and within the treatment group pre-/postintervention. Results from simulation studies confirm that such response shifts can severely bias treatment effect estimates (Soland, in press).
Sum scores are also used despite a number of IRT and other latent variable models that have been employed in the context of educational measurement (particularly large-scale assessments) that are germane to RCT pre-/postdesigns (Gorter et al., 2016). For example, a set of multidimensional IRT (MIRT) models have been developed specifically to scale tests to appropriately account for within-person covariances of scores over time (e.g., Koran, 2009; Paek et al., 2016). Similarly, multigroup IRT models have been developed that allow item and population (latent mean and variance) parameters to differ across groups, such as control and treatment study participants (e.g., Bolt et al., 2004; Huo et al., 2015; Woods et al., 2013). Without a multigroup model, scores are produced assuming full exchangeability of subjects across treatment and control groups (e.g., Lindley & Smith, 1972). That is, standard IRT scoring approaches assume that all individuals come from a single distribution, which can result in biased/shrunken score distributions when that assumption is violated. By contrast, when a multigroup IRT model is used with expected a posteriori (EAP) or modal a posteriori (MAP) scoring, population distributions appropriate to each group are used as the prior distribution. Despite the availability of IRT models developed for longitudinal and multigroup data, little evidence exists on which latent variable approach does the best job of recovering true treatment effects (Gorter et al., 2016).
In this study, simulation and empirical analyses are conducted to help close this gap in the research. The focus in both sets of analyses is on survey scales that use Likert-type items given their predominance in psychology; however, as noted in the limitations section, such analyses could (and probably should) be expanded to achievement tests, multiple choice items, or both. For the simulation study, item responses from surveys of varying lengths are simulated using a multi-timepoint, multigroup model. Item parameters are then calibrated using several approaches, including using (1) an IRT model at time one only, (2) a multigroup IRT model that ignores covariances in scores over time, and (3) a multigroup multi-timepoint MIRT model that accounts for group differences and change over time in the calibration model. Finally, survey items are scored using the item parameters from these four approaches, as well as with a sum score (rescaled to be in the same units as [3] above), and those scores are used to estimate treatment effects. Recovery of true treatment effects is examined. In the empirical analyses, we use data from a large-scale RCT in education with a pre-/postsurvey to calibrate and score the items in the same manner as in the simulation study, then see how much estimated treatment effects differ. Through these simulation and empirical analyses, the following research questions are examined, each of which is investigated in a separate simulation study:
How well are true pre-/posttreatment effects recovered when calibrating a survey in ways that do and do not account for the multigroup, multi-timepoint nature of the data?
How do results change if there are measurement invariance failures between control and treatment groups?
How do results change if there is attrition from the treatment group between the intervention and postintervention survey?
Background
Before we can evaluate the effects of an intervention, we must administer a survey measure at multiple timepoints to control and treatment groups, and then scale and score the measure based on the item responses obtained (a process referred to as calibration). One of the most common scoring approaches used in psychology and education for survey measures is to simply add up the item responses to produce a sum score. While this method may produce unbiased estimates when a set of strong assumptions hold (Bauer & Curran, 2016), it also has known limitations. As McNeish and Wolf (2020) point out, using a sum score assumes that all items are equally related to the construct of interest (e.g., all discrimination parameters are one) and that the error variances for all the items are equal. Further, a sum score model fails to account for potential differences in the severity (or in IRT parlance the “difficulty”) of the items. For example, a survey on depression would weight items on trouble sleeping and suicidality the same. Sum scores additionally assume that the measure functions identically across groups (e.g., boys do not have a higher probability than girls of endorsing an item, controlling for the underlying latent trait) as well as across time, an assumption that can be violated even in RCTs (Oort, 2005; Oort et al., 2005). Given these assumptions, sum scores tend to be much less reliable, which has consequences for uses of related scales, including for how students are classified on the basis of a scale (McNeish & Wolf, 2020).
There are a number of IRT-based alternatives that do not have the same limitations as sum scores. Under these approaches, a measurement model is fit to the item response data and then scores are produced based on the calibrated item parameters (Embretson & Reise, 2013; Wirth & Edwards, 2007). There are several choices that a researcher can make when calibrating/scoring a scale, including (a) the calibration sample used (e.g., a single timepoint from the data collected in a study or multiple timepoints), (b) the IRT model used to calibrate (e.g., a unidimensional or multidimensional model), and (c) the scoring approach used (e.g., maximum likelihood [ML] vs. EAP scoring). While questions of IRT model type and scoring approach have been examined in depth for scores at a single point in time (Kolen & Tong, 2010; Maydeu-Olivares et al., 1994), choices around the calibration sample and IRT model used for RCTs are less understood. We next describe possible calibration samples and models, including several discussed in Bauer and Curran (2016) and Kuhfeld and Soland (2020).
Approaches for Calibrating and Scoring Multigroup, Multi-Timepoint Surveys
Before turning to calibration approaches, one must first consider the samples available to calibrate. To help think through those options, Table 1 provides a 2 × 2 representation of group (control versus treatment) by timepoint (pre-/posttreatment) available to the researcher. Each cell is labeled with a letter, A to D, to aid communication. While one could hypothetically calibrate based on all cells in the table, the most sensible approaches likely involve calibrating based on A (pretreatment control scores), A and B (pretreatment scores for control and treatment groups), or using all four quadrants (all groups, all timepoints).
Possible Samples to Use in Survey Score Calibration.

The sample chosen also has implications for the type of model that can be used for calibration and scoring. Ultimately, there are three primary factors to consider in calibration: how many groups to use, how many timepoints to use, and the IRT model, which can either account for or ignore differences by group and time. Table 2 attempts to show all the different reasonable group/timepoint/calibration combinations. When only quadrant A is used (one timepoint and only the control group), a unidimensional IRT model is the only logical option. However, for any of the other combinations, more sophisticated models are available, including multigroup models, multi-timepoint/longitudinal multidimensional IRT models (hereafter simply referred to as “MIRT” models), and a combination of the two. Below, these possible approaches to calibrating the pre- and postintervention surveys (momentarily excluding using sum scores, which does not involve calibration of any kind) are discussed. For simplicity, some of the plausible calibration options from Table 2 are grouped together in what follows.
Plausible Calibration Strategies.

Note. IRT = item response theory; MIRT, multidimensional IRT.
Approach 1: Groups Pooled, Time 1 Only, Unidimensional IRT Model
The first approach considered is to calibrate the item data from a single timepoint. This model could be fit either with control participants only or both control and treatment. Once the item parameters are obtained using a unidimensional IRT model, the parameters are treated as fixed for the posttreatment survey and used to score all item responses. Mathematical details on this approach can be found in Supplemental Appendix A (available online).
There are multiple possible limitations in using just a single timepoint to calibrate scores for pre-/postinterventions (Bauer & Curran, 2016; Gorter et al., 2015; Kuhfeld & Soland, 2020). First, one is assuming that the items function similarly before and after the intervention. Second, the calibration approach contains only one observation per person and does not provide any information about whether the construct of interest covaries within persons across time. When, for example, EAP scoring is used, we assume a single population mean to which scores are shrunken. Thus, in a scenario with true population gains, the score estimates are shrunken (and therefore biased) toward a mean that assumes no change across time (Gorter et al., 2015; Kuhfeld & Soland, 2020).
Approach 2: Groups Pooled, Both Timepoints, MIRT Model
The second approach uses a longitudinal MIRT model to estimate latent change before and after treatment in an IRT framework. One should note that this approach is not likely to be used in practice given it is more complicated than the unidimensional IRT model, yet ignores the multigroup nature of the data. However, this approach is included to be thorough and because the multigroup multi-timepoint MIRT builds on it. Item response data from each timepoint are combined and calibrated simultaneously across the two timepoints. Items are calibrated such that surveys administered before and after their intervention have their own latent variable estimates. Thus, one could calibrate using this design with a multidimensional extension of the unidimensional model. Mathematical details on this approach can also be found in Supplemental Appendix A (available online).
Unlike Approach 1, the MIRT approach explicitly accounts for the overtime correlations in the model (Gorter et al., 2015; Kuhfeld & Soland, 2020). While it is expected that the scores generated under Approach 1 would have attenuated overtime correlations, this problem should be mitigated by the inclusion of this information in the MIRT model. Further, while this model typically assumes longitudinal measurement invariance, it need not. Parameter constraints over time could be relaxed such that a measurement model with partial longitudinal invariance is estimated (as is done for Question 2). This model could also be extended to account for possible serial correlation due to each item on the survey being administered repeatedly across the timepoints (Paek et al., 2014).
Approach 3: Groups Unpooled, Time 1 Only, Multigroup IRT Model
In RCTs, researchers are primarily interested in group differences (control vs. treatment). In those cases, one could produce scores using a multigroup IRT model. Such models parallel the single-group IRT model but allow for both (a) measurement noninvariance across the groups and (b) different mean and variance structures between the two groups. In most examples of EAP/MAP scoring using a unidimensional model, only students’ item responses and a single population distribution are used to produce student scores. Thus, in the context of most experiments where the outcome of interest is measured via a test or survey, scores are produced assuming full exchangeability of subjects across treatment and control groups (see e.g., Lindley & Smith, 1972). When a multigroup IRT model is used with EAP/MAP scoring, population distributions appropriate to each group are used as the prior distribution, which avoids potential biases induced by shrinking both groups to a common mean.
Approach 4: Groups Unpooled, Both Timepoints, Multigroup MIRT Model
In RCTs, researchers are not only interested in changes in time (pre-/postintervention); they are interested in group differences in changes over time. Thus, one could combine Approaches 2 and 3 to fit a multigroup, multi-timepoint MIRT model. Such a model would allow one to relax assumptions including measurement invariance before and after treatment, measurement invariance across groups, and equality of the latent means and variances across groups/over time. In many ways, this calibration approach provides the most flexibility and, perhaps, best matches the nature of data from RCTs. For example, such a model would allow pre-/postscores to have different covariances between control and treatment groups, as well as different variances at one or both timepoints. This model would also allow for different latent means pre-/posttreatment for both groups.
IRT Scoring Approaches
Thus far, most of the focus has been on calibration approaches and estimators, but with little discussion of scoring. One reason for this decision is that most of the current study focuses on calibration rather than scoring. Nonetheless, differences in scoring approaches bear mention. ML is one common approach, and it proceeds by finding the examinee’s estimate of the latent construct that maximizes the likelihood of obtaining the respondents' observed survey response data, given the item parameters and model. Benefits of ML include that it is asymptotically unbiased and its standard errors are associated with the information function (Baker, 1992). A primary limitation of ML is that estimates cannot be produced for survey respondents who use only the responses at one end of the response scale.
By contrast, Bayesian methods like EAP and MAP do not share this limitation. Rather, the posterior distribution of the latent construct levels (θ) is defined by the product of the likelihood function and the prior latent construct distribution. Bayesian methods incorporate information about the prior distribution to approximate the posterior distribution of the latent construct (Bock & Mislevy, 1982). The mean of the posterior distribution is the latent trait estimate under EAP, whereas the mode of the posterior distribution is the latent trait estimate under MAP (Yen & Fitzpatrick, 2006). The choice of a reasonable prior distribution is often important to Bayesian estimators, with the most common being the standard normal distribution. The estimates of the latent construct are shrunk toward the prior mean value, which can lead not only to biased estimates but also to overall errors that are small given shrinking to the mean (EAP) or mode (MAP) (Kolen & Tong, 2010).
Prior Comparisons of Calibration and Scoring Approaches
While a range of studies lay out the advantages of multigroup IRT models (e.g., Cai et al., 2016; Lindley & Smith, 1972) and longitudinal MIRT models (e.g., Paek et al., 2014), not many studies examine the topic of how item calibration and scoring affect recovery of treatment effect estimates. Cai et al. (2016) proposed a multilevel two-tier (MTT) item factor model that assumes conditional exchangeability and is meant to reflect the interaction of latent variable measurement models with the experimental design. As part of the empirical demonstration, they showed that sum scores produce a treatment effect of ~.2 standard deviations compared to an effect size of ~.6 standard deviations using the MTT. However, they did not compare results across calibration/scoring approaches, nor did they do any simulation analyses. In another related study, Gorter et al. (2016) found a bias in the estimated pre-/posttrend of around one standard deviation when sum scores were used, where IRT showed negligible bias. However, their study used only one IRT model that was not a multigroup model; thus, different calibration approaches were not compared.
Further, that study did not examine the impact of measurement noninvariance or attrition on results. This oversight is important given research indicating that noninvariance can occur in RCTs, including between control and treatment (so-called “response shifts”). The studies examining this issue all did so in a structural equation modeling (SEM) context. For example, research on the effect of an invasive surgery for cancer patients found that accounting for response shifts meaningfully changed estimates of physical health pre- and posttreatment (Oort, 2005; Oort et al., 2005). In psychology, there is evidence that response shifts have impacted outcomes in depression studies using the Beck Depression Inventory (Fokkema et al., 2013). There is also SEM-based simulation evidence that measurement noninvariance between control and treatment groups can bias treatment effect estimates in RCTs, and that attrition can further compound those problems (Soland, in press).
While few other studies examine how scoring affects results from RCTs, others have shown how the scoring model can impact analyses using repeated measures, and growth model estimates in particular. For example, Kuhfeld and Soland (2020) showed that using a longitudinal MIRT model with latent variables at each of the timepoints is far superior to fitting a sum score model or using an IRT model that calibrates item parameters at a single timepoint when estimating growth. They also showed that using a multigroup MIRT to calibrate and score surveys improves recovery of true growth parameters when there are distinct groups in the data (such as control and treatment participants). Other related studies have shown that calibration/scoring approaches can affect recovery of true growth parameters, including Bauer and Curran (2016) and several studies by Gorter and colleagues (Gorter et al., 2016; Gorter et al., 2020a; Gorter et al., 2020b).
Finally, studies have found somewhat mixed results on the impact that accounting for correlated errors due to administering the same items over time has on recovery of parameters relevant to understanding changes over time. In particular, Paek et al. (2014) demonstrated the importance of modeling serial correlation over multiple timepoints when producing scores for use in growth models. For example, 14% of examinees at Time 1 and 36.4% at Time 2 had more than a |.2| difference (one fifth of a standard deviation on the θ scale at Time 1) between models that did and did not properly account for serial correlation. However, Kuhfeld and Soland (2020) found a relatively small impact of serial correlation on recovery of true latent growth parameters by calibration/scoring approach.
Simulation Study 1: Treatment Effect Recovery by Calibration Approach
To help close gaps in the literature on how scoring affects recovery of treatment effects, a simulation study was conducted. A latent trait measured by the same four Likert-type items (five response categories per item) at each of two timepoints (pre- and postintervention) for two groups (control and treatment) was simulated, with a known latent mean difference of .2 logits at posttest between the groups. The generating model for the four-item survey was based on item parameters from a self-efficacy survey administered to over 1 million students annually in California (Soland, 2019; West et al., 2018), a latent mean vector, and a latent variance–covariance matrix. The generating item parameters can be found in Tables 3 and 4. The number of study participants was fixed at 2,000 simulees equally split between control and treatment groups. This relatively large N was used to have sufficient sample size to calibrate item parameters without much error. All conditions were replicated 500 times.
Generating Item Parameters for Both Groups, Four-Item Scale.

Generating Item Parameters for Group 2 (Treatment) Under Noninvariance Condition.

Note. Item parameters left blank are those that remain unchanged from Table 3.
The data for all conditions were generated using the “Simulation” mode in FlexMIRT (Cai, 2017), as was IRT calibration/scoring for the simulated data. Item parameters in the unidimensional models were estimated using ML via the Bock–Aitken EM (BAEM) algorithm, while the MIRT models were estimated via the Metropolis–Hastings Robbins–Monro algorithm (Cai, 2010a, 2010b). The latter choice was made for the purpose of computational efficiency, but some MIRT models were estimated using BAEM as a robustness check with negligible differences in parameter estimates. Estimates for most person-level scores were produced based on the calibrated item parameters using the EAP scoring approach (Bock & Mislevy, 1982). Bayesian approaches were used because shrinking to a common mean or mode rather than different means/modes for control versus treatment groups is one way that the calibration approach could introduce bias into the treatment effect estimates. However, as described below, unidimensional models were also scored using an ML approach as a robustness check.
Data were generated using a multigroup, longitudinal MIRT model as the true data-generating mechanism. For this data generation approach, true ability estimates were generated for group g at time t [t = 0, 1]
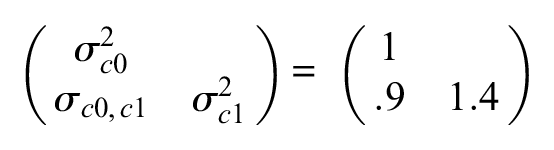
Further, these data were generated with the following true covariance structure for the control group:
For the treatment group, the true variance–covariance matrix was

These covariances were based on empirical RCT data 1 and make some important assumptions. First, the variability of posttreatment scores is lower for the treatment group. Second, the covariances between Time 1 and Time 2 are slightly lower for the treatment group. These latent means, variances, covariances, and the true item parameters were used to generate observed responses to Likert-type scale items with five response categories.
Once data were generated, the observed item responses from the 500 data sets were calibrated and scored using a subset of the approaches detailed in the “Background” section. 2 As a starting point, item parameters were calibrated at Time 1 using a unidimensional IRT model and only the control group (Approach 1), then all simulated surveys were scored using those estimated parameters. Further, two steps were taken to help ensure that these unidimensional models were not at a disadvantage. First, given improperly shrinking scores to a single mean when using EAP scoring with the unidimensional model could disadvantage it, surveys were also scored using ML in conjunction with the unidimensional model as a point of comparison. Second, for both the EAP and ML estimates of the unidimensional scores, treatment effects were re-estimated, but standardized relative to the variance of the original IRT score at Time 1. This standardization approach was taken to ensure that scaling differences were not impacting treatment effect estimates for the unidimensional IRT model, especially relative to sum scores (described below).
Next, multigroup IRT models were used. Specifically, item parameters were calibrated at Time 1 using a multigroup MIRT model, then those parameters were carried forward to score both groups at Time 2 (Approach 3). Then, the true model was used, which calibrated and scored using a multigroup longitudinal MIRT model (Approach 4). For both of these models, EAP scores were used.
Beyond using the scores produced with the above calibration approaches, true scores from the data-generating process were used, as were sum scores. A main issue with using sum scores is that they are on a different scale than the IRT-based scores. To overcome this form of scale indeterminacy, the sum scores were rescaled to place them on the same scale as the multigroup longitudinal MIRT scores (Approach 4) using a linking equation detailed by Gorter et al. (2015) and originally enumerated by Kolen and Brennan (2010).
In the last step, the various scores were used to estimate treatment effects. Those treatment effects were estimated in two ways. First, the treatment effect was calculated as
Sensitivity Analysis Using 10-Item Scale
As a robustness check, results were replicated using a 10-item scale rather than a four-item scale. This choice was made because the attenuation of a treatment effect is strongly related to scale reliability, which would likely increase with the length of the scale. Item parameters for the 10-item robustness check came from a measure of self-control used in the National Institute of Child Health and Human Development Study of Early Child Care and Youth Development (Goble et al., 2019). Generating parameters for the 10-item scale can be found in Supplemental Appendix Table A1 (available online).
Sensitivity Analysis With Serial Correlation
In addition to the above generating population model and item parameters, data were also generated to investigate the sensitivity of treatment effect estimates to the presence of serial correlation. Specifically, data were generated using the same item parameters, but adding dimensions that accounted for serial correlation due to the same item being repeated across multiple timepoints. The generating slope parameters for these serial correlation factors can be found in Supplemental Appendix Table A2 (available online). Item parameters were then calibrated using all of the same models as before, but adding serial correlation factors to the multigroup MIRT model.
Results
Before turning to recovery of treatment effect parameters, item parameter recovery was examined. All models converged across all replications. When calibrating and scoring using the data-generating model (Approach 4), item parameter recovery was excellent. A table showing estimates of those parameters across replications for Question 1 can be found in Supplemental Appendix Table A2 (available online).
Figure 1(a) shows a boxplot for the estimated treatment effects across the 500 replications by calibration/scoring approach. In addition, for all simulation studies, actual point estimates for the treatment effects, their standard deviations, bias, and proportion of significant treatment effect estimates across replications are reported in Table 5. Thus, the figures show both the median treatment effect, as well as the variability of the estimates across replications. As hoped, there is practically no bias in the treatment effect, on average, when using the true scores to estimate the impact of the evaluation. Similarly, when using a multigroup MIRT (Approach 4), there is practically no bias (mean treatment effect = .197 logits across replications).
Point Estimates of Treatment Effects by Model and Simulation Study Question.

Note. IRT = item response theory; MIRT = multidimensional item response theory; EAP = expected a posteriori; ML = maximum likelihood.
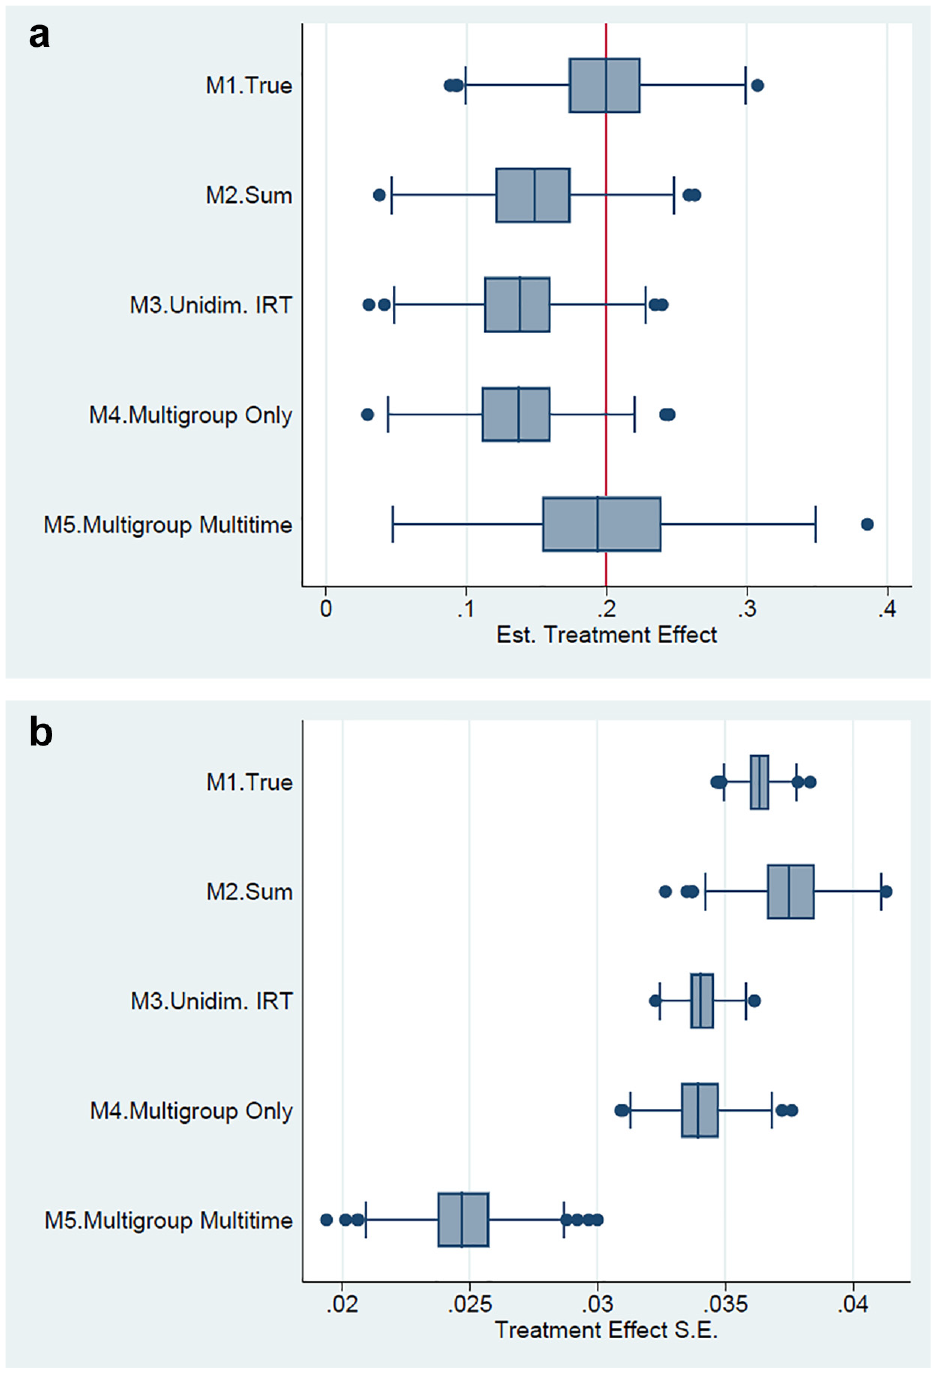
(a) Boxplots of estimated treatment effects across 500 replications by calibration/scoring approach (Question 1). (b) Boxplots of treatment effect standard errors (SEs) across 500 replications by calibration/scoring approach (Question 1). IRT = item response theory.
However, all the other methods show nonnegligible bias in the estimated treatment effect. For example, when using a rescaled sum score, the mean treatment effect was ~.15 logits, understating the true treatment effect by a quarter. The multigroup IRT model calibrated at Time 1 also shows considerable bias, with a mean treatment effect across replications of ~.14 logits.
While the single timepoint IRT model (Approach 1) did not perform as well as the multigroup MIRT model, it did perform fairly well dependent on the scoring and standardization decisions made. As shown in Table 5, when using EAP scoring without standardization (akin to the multigroup MIRT results), the estimated treatment effect was ~.14 logits. However, the standardized EAP score produced a mean treatment effect of .17 standard deviations, and the scores produced using ML generated a mean treatment effect of .22 units. These results indicate that much of the bias in the treatment effect for EAP scoring was, unsurprisingly, due to shrinking the scores toward a single mean. Further, while the bias was larger than for the multigroup MIRT model, one could argue that bias was relatively small from a practical significance perspective.
Figure 1(b) similarly shows boxplots by calibration/scoring approach but presents the standard errors (SEs) across replications instead. As the figure shows, the SEs for the multigroup longitudinal MIRT model were smallest on average, though they were slightly more variable (perhaps due to the increased number of parameters being estimated with uncertainty relative to the other models). SEs tended to be largest for the sum scores. Notably, the SEs were larger for the true scores than the multigroup longitudinal MIRT model scores. This result occurred because the latter shrunk the estimates to the means for the two groups specific to each timepoint, which reduced their overall variance relative to the true scores. Finally, while virtually all of the treatment effects were significant across replications and scoring approaches (as shown in Table 5) due to a fairly large true treatment effect of .2 logits and sample size of 2,000 participants, these differences in SEs would likely affect power in RCTs with smaller true effects and sample sizes.
Sensitivity Analysis With 10 Items
Table 6 shows the results from the 10-item scale sensitivity check. To make comparisons easier, the results from the four-item scale shown in Table 5 are provided again. Given results from the main part of Study 1, only results from the ML-based scores for the unidimensional IRT model are provided. Results using the 10-item scale generally match what one might expect for a more reliable scale. First, the treatment effects based on true scores and the multigroup MIRT model do an excellent job of recovering the true treatment effect, as before. Second, the other calibration/scoring approaches still do not perform as well, but the bias in the treatment effect estimates when using those other approaches is lower when using a longer survey scale. For example, when using a sum score, the estimated treatment effect is ~.15 units with a four-item scale, but ~.18 units with a 10-item scale.
Point Estimates of Treatment Effects by Comparing Four- and 10-Item Scale Results.

Note. IRT = item response theory; MIRT = multidimensional item response theory; ML = maximum likelihood.
Sensitivity Analysis With Serial Correlation
As described earlier, data were also generated to include serial correlation. Yet even when the true model included serial correlation, differences in the recovery of true treatment effects across calibration/scoring approaches changed marginally compared with simulations with no serial correlation. In particular, the performance of the multigroup MIRT models relative to the non-MIRT models was substantively unchanged, with the performance of the MIRT models remaining superior.
Simulation Study 2: Measurement Invariance Failures Between Control and Treatment
To answer Question 2, data were simulated in a manner similar to Question 1, but introducing failures of measurement invariance between control and treatment groups. Such a phenomenon could result due to response shifts, which occur when being in the treatment actually changes how those study participants understand the construct, in turn affecting the measurement model parameters (Oort, 2005; Oort et al., 2005; Soland, in press). To ensure that the measurement invariance failures were plausible, differences in item parameters across groups were based on those reported by Oort et al. (2005) and by Fokkema et al. (2013), who found noninvariance of items on the Beck Depression Inventory over time. Similar to their findings, noninvariance was induced in two discrimination parameters and three difficulties. In some cases, parameters differed between groups, but remained consistent pre-/postintervention. In other cases, treatment group parameters differed relative to those in the control group, as well as over time within the treatment group. Thus, there were failures of both group invariance and longitudinal invariance to mirror the effects of response shifts (Oort et al., 2005). The magnitude of the noninvariance in parameter estimates between timepoints mirrored those of Fokemma et al. (2013). Generating item parameters for the measurement invariance failure condition can also be found in Tables 3 and 4.
Once observed item responses were generated, they were then scored as before (unless otherwise stated, the parameters and data generation followed what was used in the first study). In these simulations, it was assumed that the researcher would have looked for noninvariance a priori and accurately identified items on which to loosen restrictions (partial measurement invariance). For Approach 4 (true model), the noninvariant parameters were appropriately identified. When using a multigroup IRT model calibrated at Time 1 (Approach 3), it was assumed that any noninvariance of the Time 1 parameters would have been detected, but not at Time 2.
Results
Figure 2(a) shows the same boxplot as in Figure 1(a), but under the measurement invariance failure condition. As in the prior study, the true scores and true model scores were nearly perfect in recovering the true treatment. And once again, the sum score approach produced substantial bias. Unlike in prior questions, however, the sum score performed worse than many of the other IRT-based approaches. For the sum score estimates, the treatment effect was found to be ~.12 logits. For both Approach 3 and Approach 1 using EAP scoring, the estimated treatment effect was approximately .13 logits (on average across replications). As in Study 1 (and as shown in Table 5), the ML scores for the unidimensional IRT model improved its performance significantly, though there was still more bias than for the data-generating model. There were also higher rates of Type 2 errors for the unidimensional model with ML scoring (91% of treatment effect estimates were found significant at the .05 level compared with 99.6% for the multigroup MIRT model), likely due in part to the exclusion of respondents who used only the extremes of the Likert-type scale. Figure 2(b) shows the SEs across approaches and replications. Once again, SEs were lowest for the true model, and largest for the sum score approach, likely with implications for power.

(a) Boxplots of estimated treatment effects across 500 replications by calibration/scoring approach (Question 2: measurement noninvariance). (b) Boxplots of treatment effect standard errors (SEs) across 500 replications by calibration/scoring approach (Question 2: measurement noninvariance). IRT = item response theory.
Simulation Study 3: Attrition
To answer Question 3, Study 1 was repeated, but with study participants leaving the sample (attrition). A form of attrition that occurs often in applied RCTs was simulated, namely attrition of participants with low baseline scores between Time 1 (pre) and Time 2 (post; Soland, in press). Such a result might occur if, say, low-income students with poor academic self-efficacy were more likely to leave the study due to logistical complications impeding their participation. Attrition was replicated by identifying simulees in the treatment group with true scores at Time 1 (pre) that were at or below the 25th percentile. Then, half of those simulees were removed from the sample at random, leading to one out of every eight students in the treatment leaving the study. Calibration and scoring was then based on this revised sample of participants. Given results from the first two simulation studies, only multigroup longitudinal MIRT model, sum, and true scores were compared.
Results
Figure 3(a) shows the same boxplots as in Figure 1(a), but for the attrition study. Once again, the true scores and multigroup longitudinal MIRT model scores led to virtually no bias, on average. By contrast, in this study, using sum scores led to an upward bias in the estimated treatment effect. Specifically, the mean sum score–based treatment effect across replications was .26 units, leading to a bias of .06 units. Thus, attrition of the lowest scoring simulees led to an upwardly biased treatment effect compared with using a MIRT model that better accounted for the nature of the data-generating mechanism.

(a) Boxplots of estimated treatment effects across 500 replications by calibration/scoring approach (Question 3: Attrition). (b) Boxplots of treatment effect standard errors (SEs) across 500 replications by calibration/scoring approach (Question 3: Attrition).
Empirical Study
In the empirical demonstration, data from a large-scale RCT that examined the impact of the GREAT Families Program on student aggressive behavior (among other outcomes) were used. The sample is from several states and includes over 5,000 students in the middle school grades. The initial study found a significant effect of the intervention on school norms for aggression, the outcome of interest in this empirical demonstration (Henry et al., 2012; Simon et al., 2009).
Intervention Being Studied
The GREAT Families Program is a 15-week intervention conducted in groups of four to six high-risk students and their parents (see Smith et al., 2004, for details). GREAT’s aim is to help families with child rearing within the constraints and opportunities of their social context. The program includes a Home-School Communication Plan wherein parents received weekly feedback from one of their child’s teachers on the child’s progress meeting academic and behavioral goals (Tolan et al., 2004). The program progressed from an orientation in basic parenting skills to handling issues in emerging adolescent relationships, including in school. Meetings started with sharing a meal provided by the project, reviewing the prior week’s assignment, and discussing a topic related to the core program. Role plays and other activities designed to engage parents and their children in interactive tasks related to real-life family matters provided opportunities to develop and practice new skills.
Participants
Participants were students at 37 schools from four communities: Chicago; Durham, North Carolina; northeastern Georgia; and Richmond, Virginia. All participating schools included a high percentage of students from low-income families based on eligibility for the federal free or reduced-price lunch program (42%—96% across sites). Additional details regarding school recruitment and community characteristics are reported in Henry, Farrell, and Multisite Violence Prevention Project (2004). Students were randomized to one of four conditions: universal intervention, selective intervention, combined (universal and selective) intervention, and no-intervention control. Data were collected from students during the fall and spring of the sixth-grade school year and in the Spring of the next two school years. For the purposes of the empirical demonstration, any student not in the no-intervention control was deemed to have received treatment.
Measures
School norms for aggression were assessed using the Norms for Aggression and Alternatives scale (α = .80). The School Norms for Aggression subscale was a shortened version of a scale developed by Henry, Cartland, et al. (2004) to measure students’ perceptions about whether peers at their school approved or disapproved of aggressive behaviors (e.g., “How would the kids at your school feel if a kid hit someone who hit first?”). Items with a similar format were developed to create a School Norms for Nonviolent Behavior scale (e.g., “How Would the kids at your school feel if a kid ignored a rumor that was being spread about him or her?”). The final measure used consisted of 10 items rated on a 3-point scale including the following response categories: 1 (disapprove), 2 (neutral), and 3 (approve).
Method
Results from the simulation studies were replicated using the empirical RCT data. 3 Specifically, the same calibration/scoring approaches as employed in the simulation studies were used to estimate scores on the School Norms for Aggression subscale. Treatment effects were estimated for those different scores using a simple model that regressed postintervention scores on preintervention scores and treatment status. The model also included a site random intercept. Treatment effects were estimated in this way to match those from the original study, which used sum scores as the dependent variable (Tolan et al., 2004).
Results
Table 7 presents treatment effect estimates by scoring method for the empirical data. One should note that the construct of interest here is capturing an adverse behavior, thus a larger negative treatment effect represents an improvement for the treatment group. Not unlike in the simulation studies, using a sum score produced a treatment effect estimate that was ~20% lower than when using a multigroup MIRT model. Further, the sum score approach closely matches the treatment effect reported in Simon et al. (2009), which may indicate that the reported treatment effect understated the true treatment effect. Also similar to the simulation studies, the other IRT-based approaches tended to produce treatment effects that were comparable to those using sum scores and a multigroup MIRT model.
Estimated Treatment Effects from the Empirical Study.

Note. IRT = item response theory.
Discussion
RCTs are considered the gold standard when evaluating the effect of interventions, programs, and policies in education and psychology. Thus, considerable attention is given to their design, including factors like how to randomize participants, address attrition, and ensure sufficient statistical power. Yet, in these fields, when survey scores are the outcome of interest, measurement is often an afterthought (Flake et al., 2017), with sum scores typically being used despite their reliance on assumptions that are extreme and often unwarranted (Bauer & Curran, 2016; Gorter et al., 2016; Kuhfeld & Soland, 2020; McNeish & Wolf, 2020). Further, little is known about how well several available IRT-based alternatives perform when trying to recover a true treatment effect. In this study, that gap in the literature is addressed through simulation and empirical studies that compare estimated treatment effects using a variety of different calibration and scoring approaches. The results provide several pieces of evidence that will likely be useful to applied researchers conducting RCTs.
First, results indicate that MIRT models that account for both the longitudinal and multigroup facets of the data do the best job of recovering true treatment effects. For example, these multigroup MIRT models barely showed more bias then when using actual true scores from the simulations. Further, these estimated treatment effects were almost always higher than when using other scoring approaches, suggesting that applied researchers using other scoring approaches may not only be introducing bias into estimates when using other scoring approaches, but also producing downwardly biased estimates. Moreover, this approach consistently yielded the smallest SEs; combined with reducing downward bias in point estimates using other approaches, there are likely nonnegligible implications for Type 2 error rates (there were few Type 2 errors in our study given the true treatment effect of .2 logits and consistent sample size of 2,000 simulees). While the true treatment effect was unknown in our empirical analyses, the multigroup MIRT nonetheless produced the highest treatment effect estimates, just as in the simulation studies.
The performance of the multigroup longitudinal MIRT calibration/scoring approach was also better relative to the others when there were failures of measurement invariance across control and treatment groups. For all other approaches, including sum scores, estimated treatment effects understated true treatment effects, oftentimes by upward of 40%. This result is important in light of empirical research showing that response shifts can occur in RCTs spanning medicine, psychology, and education (Oort, 2005; Oort et al., 2005; Soland, in press). Additionally, this approach mitigated bias in treatment effect estimates when attrition occurred, which happens often in real RCTs and can compound the effects of invariance failures on RCTs (Soland, in press).
Second, in the first two simulation studies, sum score–based approaches understated the true treatment effect by at least 25%. In Question 1, which was the most generic of the three simulations, the true treatment effect was understated by ~25%. Notably, in the empirical study, the sum score estimate was ~20% below the multigroup MIRT estimate, mirroring the results from Question 1 in the simulation study. Sum scores did exceptionally poorly when there was a modest failure of measurement invariance between control and treatment groups. This last finding is troubling given the previously discussed evidence that undergoing an intervention can induce noninvariance (e.g., Oort et al., 2005) and use of sum scores, which is the most common scoring approach in most of education and psychology (McNeish & Wolf, 2020), limits options for testing measurement invariance. Sum scores also performed poorly in the face of attrition, with treatment effect estimates upwardly biased by ~.06 units.
Third, other IRT-based scoring approaches tended to do worse not only than the multigroup MIRT, but also the sum score approach under certain conditions. Further, the performance of the unidimensional model was highly dependent on the scoring approach used and whether the scores were standardized. For example, bias was much smaller when using ML scoring compared with EAP scoring for the unidimensional model.
Guidance for Applied Researchers
Given these results, applied researchers have a few options at their disposal. Clearly, the best approach is likely to use a multigroup longitudinal MIRT model that accounts for differences by control/treatment status and timepoint. Beyond the simulation results, this model is likely the most justifiable for several reasons. For one, in RCTs, one can be more certain than in other settings that the data-generating mechanism involves changes over time that are different by group. The whole objective of most RCTs is to generate differential changes across control and treatment groups, and the experimental manipulation of the data helps avoid other confounding factors. Thus, while one can never be certain of the true model when using empirical data, there is likely more certainty in an RCT that there are longitudinal group differences. In addition, fitting this more complex model if there are no true group or time differences is probably less problematic than when there are true group or time differences that are ignored when scoring (as results suggest). That is, if one fits a multigroup MIRT model, but there are no group differences, then those models will converge to a simpler model that ignores group differences. In short, damage is likely to be less when overcompensating for complexity than when ignoring it.
There is also an argument for fitting a multigroup longitudinal MIRT model in terms of power. This calibration approach did the most to reduce downward bias in the estimates and the produced the smallest SEs. Thus, this approach appears least likely to result in Type 2 error rates. In fact, due to shrinkage toward group- and time-specific means, variances were actually lower for these scores than for true scores. Examining the effect of calibration/scoring approach on Type 1 errors is warranted in future research.
Three caveats to these recommendations about using the multigroup MIRT model bear mention. First, researchers who fit the multigroup MIRT should be aware that, due to the shrinking of the standard deviations from such models under EAP scoring, scores should not be used to describe the distribution of effects. As an example, researchers should not standardize treatment effects by dividing by the standard deviation of the EAP scores due to this shrinkage issue. If one does want to estimate the true distribution of effects, the most direct approach likely involves applying the multigroup MIRT using the group parameters for the latent distributions (means, variances), which avoids use of the EAP estimates. Second, if researchers are unaware of multigroup MIRT models and how to fit them, the unidimensional IRT model calibrated at Time 1 performed reasonably well when using ML scoring. Thus, if a simpler alternative is needed, such an approach is a candidate. However, researchers should also be aware that using ML will not produce scores for individuals who only use the highest or lowest response categories, which can be a problem for short survey scales. Third, as the length of the scale increases and reliability improves, differences across calibration/scoring approaches become less pronounced. Thus, the issues examined in this study are particularly consequential for very short survey scales.
Additionally, the results indicate that sum scores are typically not a defensible choice, as has been pointed out elsewhere (Gorter et al., 2016). For instance, sum scores always produced bias in the treatment effect estimates (oftentimes downward) and virtually always had the largest SEs. Given how often sum scores are used in educational and psychological studies, and how often reported treatment effects in those fields are just below thresholds for statistical significance (e.g., Schochet, 2009), one cannot help but ponder the effect that using sum scores has had on Type 2 error rates in the social sciences. They performed particularly poorly under failures of measurement invariance, and produced bias when attrition occurred. Thus, there is little argument for their use in the context of RCTs using survey scores.
Applied researchers should also note that, while this study is focused on a two-stage approach by which surveys are scored then those scores are used in models to estimate treatment effects, one could simply combine these steps using SEM. For example, one could fit an SEM with latent variables for item responses at each timepoint, and allow the measurement model parameters (including latent means) to differ by control and treatment groups. Such models are no more difficult to implement than the IRT models used in this study; the choice of whether to use SEM versus IRT may simply come down to the researcher’s relative familiarity with the two methods.
Limitations and Future Directions
At least a couple of study limitations bear mention. First, the empirical demonstration involved one scale from one RCT. Generalizability of results should be explored. However, the strong concordance between simulation and empirical results might provide some comfort that the latter are not purely driven by the particular study and measures used.
Second, this set of studies emphasizes survey scales that use Likert-type items. The findings should also be examined when achievement tests and dichotomous items are used. While the principles described herein would still apply, the results may be different when fewer response categories and more items are used. Further, examining covariate-based scoring approaches like those used with PISA, which are explicitly designed to avoid shrinkage to a common mean, could be explored in the context of scoring surveys used as outcomes in RCTs.
Third, only one relatively large sample size (2,000 simulees) and one true treatment effect were used in the simulation studies, and that effect was quite large at .2 logits. If a more modest sample size and treatment effect had been used, then Type 2 error rates would likely have increased drastically when using any model that did not account for the longitudinal, multigroup nature of the data. The relationship between power and scoring approach should be investigated in subsequent research.
Fourth, we conducted our second simulation study examining noninvariance under circumstances that may be somewhat optimistic in an applied setting, especially in relation to the performance of the multigroup MIRT model. Specifically, the simulations assumed noninvariance occurred for one specific threshold parameter on a given item. By contrast, in many empirical studies, a more general item parameter shift (i.e., all threshold parameters change for a specific item) occurs. Additionally, the simulation assumed that the noninvariant parameters could be identified fairly effectively a priori by using the multigroup MIRT. If either of those two assumptions (and associated conditions) were changed, the performance of the multigroup MIRT could also shift.
Finally, the sensitivity analyses in Study 1 related to serial correlation were quite limited. Only one set of parameters was used rather than vary those parameters. This decision was made because the issue of serially correlated errors is not the main focus of this study. However, while our limited findings do not indicate that correlated errors over time substantially affect the performance of different calibration approaches when trying to recover true treatment effects, we do not provide enough evidence to conclude as much beyond our small simulation, especially given that Paek et al. (2014) found large impacts on person parameter recovery.
Conclusion
Oftentimes, RCTs in education and psychology use surveys to measure psychological and social–emotional constructs pre- and posttreatment. Those surveys are typically scored using sum scores (McNeish & Wolf, 2020). In this study, we examine how different IRT-based approaches to calibrating and scoring survey item responses perform when trying to recover true treatment effects, including compared with sum scores. We find that using a multigroup multi-timepoint MIRT model does a markedly better job in recovering treatment effects than other models, including sum scores. Further, scoring approaches that do not take into account the multigroup, longitudinal nature of the data typically lead to treatment effect estimates that are downwardly biased and to larger SEs, raising the specter of Type 2 error rates.
As a final note, considerable effort is often put into designing RCTs. From power analyses and complex sampling designs implemented preintervention to complex quasi-experimental models used to estimate treatment effects and make causal claims postintervention, much thought goes into RCTs. Monetarily, large-scale evaluations of programs in education can cost millions of dollars to fully execute. The results from this study indicate that being casual about measurement—and calibration/scoring in particular—in such RCTs can downwardly bias treatment effect estimates needlessly. Further, the magnitude of that bias could likely wash out many of the benefits of increasing sample size on the basis of power calculations, which are considered table stakes in most RCT planning. Given the time and investment in RCTs, not to mention the weight they carry among researchers, findings from these simulation and empirical studies suggest that increased attention to measurement is more than warranted.
Supplemental Material
sj-docx-1-epm-10.1177_00131644211007551 – Supplemental material for Evidence That Selecting an Appropriate Item Response Theory–Based Approach to Scoring Surveys Can Help Avoid Biased Treatment Effect Estimates
Supplemental material, sj-docx-1-epm-10.1177_00131644211007551 for Evidence That Selecting an Appropriate Item Response Theory–Based Approach to Scoring Surveys Can Help Avoid Biased Treatment Effect Estimates by James Soland in Educational and Psychological Measurement
Footnotes
Declaration of Conflicting Interests
The author declared no potential conflicts of interest with respect to the research, authorship, and/or publication of this article.
Funding
The author received no financial support for the research, authorship, and/or publication of this article.

Supplemental Material
Supplemental material for this article is available online.
Notes
References
Supplementary Material
Please find the following supplemental material available below.
For Open Access articles published under a Creative Commons License, all supplemental material carries the same license as the article it is associated with.
For non-Open Access articles published, all supplemental material carries a non-exclusive license, and permission requests for re-use of supplemental material or any part of supplemental material shall be sent directly to the copyright owner as specified in the copyright notice associated with the article.
